Is AAVE About to Explode Above or Collapse? Key Levels to WatchYello Paradisers! Is #AAVE quietly prepping for a major breakout… or is this just another setup to wipe out the impatient bulls before the real move begins?
💎#AAVEUSDT is moving in a textbook ascending channel, respecting both trendline resistance and support beautifully. The structure is clean, but deceptive. While many may assume this is an easy path higher, seasoned traders know better — especially with what’s happening near the critical resistance zone.
💎The red resistance zone ($270–$280) that was previously a major support during the last cycle is now acting as heavy resistance again. #AAVEUSD is currently battling this zone after several failed attempts to break through. But the structure still leans bullish as long as we stay within the ascending channel.
💎Both the 50 & 200 EMA are now acting as dynamic support. This is key — if the price remains above these EMAs and the lower channel boundary, momentum favors the bulls. A decisive breakout above $280 could trigger a parabolic rally toward the $375–$410 range, a level where serious resistance and profit-taking are expected.
💎However… if bulls get lazy and we see a strong breakdown below the ascending channel, especially below $237, the setup gets shaky fast. A complete invalidation of the bullish case occurs if AAVE loses $209 — from there, expect a breakdown structure to unfold with a likely test of much lower levels and a possible retest of the $150 zone.
Trade smart, Paradisers. This setup will reward only the disciplined.
MyCryptoParadise
iFeel the success🌴
Cryptoanalysis

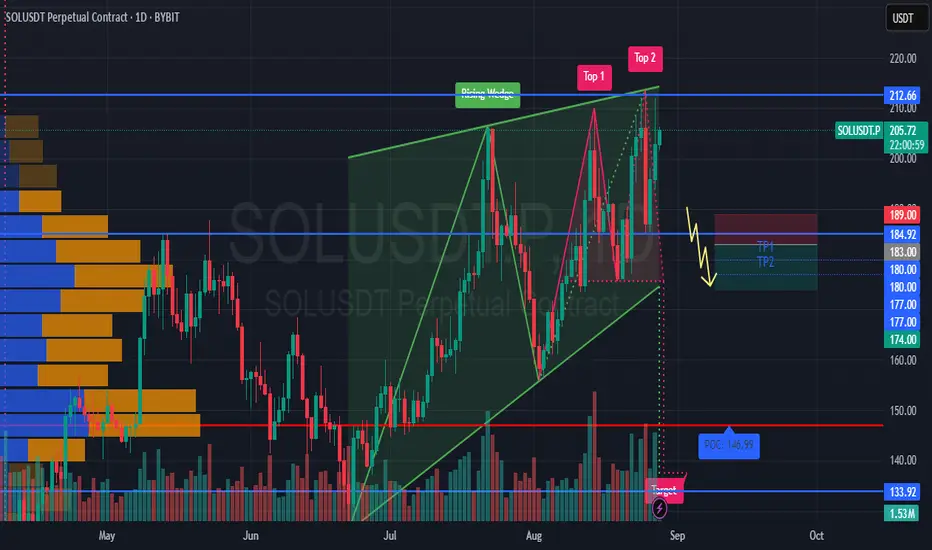
#SOLUSDT maintains a bearish setup📉 SHORT from $183.00
🛡 Stop loss $189.00
🕒 Timeframe: 1D
❗ If the price consolidates above $189, the setup becomes invalid.
⚡ Overview:
➡️ On the daily chart, a Rising Wedge has formed — a bearish pattern signaling potential reversal.
➡️ The $183.00 level is the key zone where the short scenario gets activated.
➡️ The POC at $146.99 remains a strong long-term magnet for price.
➡️ Increasing volumes on red candles confirm seller interest.
🎯 TP Targets:
💎 TP 1: $180.00
💎 TP 2: $177.00
💎 TP 3: $174.00
📢 Short entry is optimal from $183 with a clear stop at \$189.
📢 Focus on holding below $183 — this will confirm the bearish continuation.
📢 In the long term, if $174 breaks, the target could extend to the $147 (POC) zone.
🚀 #SOLUSDT maintains a bearish setup — as long as price holds below $183, expect a move toward $174 and potentially further downside.
BTCUSDT - high placed ? What's next ??#BTCUSDT... so far market placed a very reasonable day high that is 122600-700 around.
So if market holds that then drop expected.
Above current day high it will be invalidate.
Gold luck
Trade wisely

Can #BAND Bulls Maintain this Momentum or Will Bears Win? Yello, Paradisers! Is #BANDProtocol breakout from the falling wedge legit—or are bulls walking straight into a trap? Let's dig into the latest setup of #BANDUSDT:
💎After trading for weeks inside a falling wedge, #BAND has finally broken out with solid momentum. The breakout above the resistance trendline at around $0.66 has already occurred, and the price is currently hovering near the $0.72 zone. While this move is promising, it’s now all about whether this breakout can hold or fake out.
💎The structure here is clear: #BANDUSD reclaimed the demand zone between $0.60–$0.66 after bouncing off strong support at $0.504. This zone now becomes the most important area to watch in the short term. A retest of this level would offer a high-probability continuation setup, especially since the 50EMA is now acting as dynamic support beneath the price.
💎If bulls can maintain control, we have a clear path toward the moderate resistance at $0.992. That’s where the next wave of selling pressure is expected. But the real prize is the strong resistance zone near $1.180. That’s the level where major distribution could occur, and it's where we’ll be watching closely for profit-taking signs.
💎However, the bullish thesis breaks down completely if the price drops back below the $0.60–$0.66 demand zone. In that case, our invalidation point sits firmly at $0.504. A close below that support would indicate bears are back in control, and we’d shift to a defensive stance, targeting lower re-entry zones.
Stay patient, Paradisers. Let the breakout confirm, and only then do we strike with conviction.
MyCryptoParadise
iFeel the success🌴

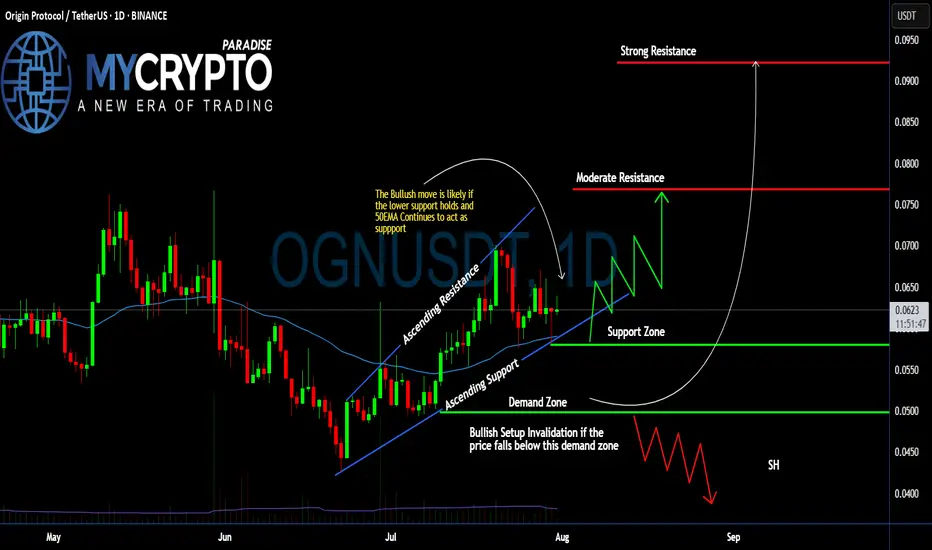
#OGN Ready For a Massive Bullish Move | Must Watch For BullsYello, Paradisers! Is #OriginProtocol about to explode to the upside, or is this a bull trap in disguise waiting to liquidate the impatient? Let’s break down what’s brewing on #OGNUSDT:
💎After forming a clean ascending channel, #OGN has been respecting both the ascending resistance and ascending support levels. Price is currently trading just above the 50 EMA, which has been acting as a dynamic support line since early July. This structure shows clear buyer interest around the $0.058–$0.062 zone—an area that aligns with volume cluster support.
💎The bullish scenario remains valid as long as #OGNUSD holds above the demand zone between $0.0499–$0.0580, and especially if it stays above the 50 EMA. As long as this structure is maintained, we could see a bounce toward the moderate resistance level at $0.076, where previous sellers stepped in and price stalled.
💎If buyers can break through that moderate resistance with strength and rising volume, the next key target lies at $0.092, which aligns with a strong resistance level and high-volume node on the visible range. This area is likely to trigger a reaction, so traders should remain agile.
💎However, if price breaks down below the demand zone, this would invalidate the current bullish setup and open the door for a potential move back toward the $0.045–$0.040 area. A broader shakeout would likely accompany this and could trap many late long entries.
Stay patient, Paradisers. Let the breakout confirm, and only then do we strike with conviction.
MyCryptoParadise
iFeel the success🌴
SKLUSDT – Possible Reversal in PlaySKL shows a change of character (ChoCH) after long consolidation and now trying to push upward. Price already retested the zone, giving a chance for continuation if momentum holds.
Entry: 0.0310 - 0.0307
Stoploss: 0.0297
Targets:
0.0326
0.0339
0.0360
Let’s see if SKL can maintain strength and push into higher targets.

Chainlink (LINK/USDT) – Two Key Scenarios AheadChainlink is currently trading at $24.9, right below a major resistance zone around $27.3. The price has been moving within a long-term ascending channel since mid-2022, and right now it’s at a decisive point.
🔹 Scenario 1 (More Probable – Bearish Rejection)
If LINK fails to break $27.3, we could see a rejection that triggers a correction towards the lower boundary of the ascending channel, around $15–17 (SC1). This aligns with the overextended move and prior rejection patterns.
🔹 Scenario 2 (Bullish Breakout)
A successful breakout above $27.3 with strong volume could fuel a rally toward the channel top, targeting the $45–52 zone (SC2).
📊 Technical Notes:
• Current resistance: $27.3 (critical decision point).
• Support levels: $18–19, then $15–17 (channel support).
• Next resistance above $27.3: $34, then $45–52.
• Structure: Ascending channel since mid-2022.
✅ Conclusion
While both scenarios are valid, the bearish rejection (Scenario 1) seems more likely unless LINK breaks $27.3 with conviction. Traders should watch for rejection signals at current levels before committing.

Is #VET Ready for Massive Bullish Rebound or Not? Watch CloselyYello, Paradisers! Is #VET setting up for a breakout play, or are we about to witness another classic bull trap unfold? Let’s dig into what the chart is telling us on #VeChain:
💎After climbing steadily inside an ascending channel, #VETUSDT is now approaching a major resistance zone around $0.02–$0.02. A confirmed breakout above this area would significantly boost the probability of a bullish continuation, especially with the 50EMA providing dynamic support from below.
💎The immediate support zone to watch is between $0.020–$0.022, which aligns with the channel’s lower boundary and a visible demand zone. This is the key level where bulls are expected to step in if #VETUSD pulls back.
💎If buyers defend this zone successfully and price breaks above the current resistance, the next upside target lies at the moderate resistance of $0.031. Beyond that, the strong resistance level at $0.038 will be the real decision point for any sustained move higher.
💎On the flip side, a breakdown below $0.020 would send it to the lower demand zone at $0.016. It would invalidate the bullish setup and open the door for a deeper selloff, potentially forming a new swing low as shown on the chart.
Stay patient, Paradisers. Let the breakout confirm, and only then do we strike with conviction.
MyCryptoParadise
iFeel the success🌴

Recent Dip & What It Means for the Trojan Cycle: Fact Check1. Stablecoin Capital Flow — Not a Typical Sell-Off
On August 14–15 , Binance saw $1.82 billion in net stablecoin inflows, one of the highest recent figures.
Simultaneously, Tether and Circle minted a combined $9.5 billion in stablecoins over the past 30 days , signaling significant on-ramp activity.
These patterns contradict what we'd expect in a pure capitulation. Instead, they suggest capital is being positioned to buy into dips , not exit markets—hallmarks of the positioning-reset phase in the Trojan Cycle.
2. Institutional Accumulation Aligns with Thesis
Spot Ether ETFs just recorded over $1 billion in net inflows in one day (led by BlackRock’s ETHA and Fidelity’s FETH), bringing total ETF inflows to $10.8 billion.
Two whales accumulated $150 million in ETH , reinforcing institutional interest at these levels.
This indicates institutional players are using the dip as an opportunity to accumulate—consistent with the Trojan framework's “Trojan vehicles” mechanics.
3. Market Structural Trends Support Rotation Setup
Ethereum price dipped ~3% , suggesting short-term weakness but providing a potential entry zone.
Network activity remains robust: ETH daily on-chain transactions recently neared all-time highs at ~1.87 million , driven primarily by stablecoin transfers .
Strong on-chain activity alongside stablecoin flow indicates capital preparation for a rotation phase, rather than a breakdown.
Trojan Cycle Thesis — Data Review
Aspect --> What Trojan Cycle Predicts --> What Data Shows
Stablecoin Inflows --> Increases ahead of rotation --> Binance saw $1.82B in inflows; $9.5B minted overall
Institutional Buying --> Accumulation during dips --> $1B+ ETF inflows; $150M ETH whales buying
Network Activity --> Pre-rotation buildup --> High ETH txn volume, stablecoin activity peaking
Conclusion: All three key indicators align with the Trojan Cycle model. This dip appears to be a positioning flush, not the start of a structural downturn.
KAS Setup – Retest of Broken Resistance as SupportKASPA (KAS) has recently broken above a key resistance zone, and is now retesting that level as support — a classic bullish continuation signal.
📌 Entry Zone: $0.090 – $0.095
🎯 Targets:
• TP1: $0.105 – $0.12
• TP2: $0.13 – $0.15
• TP3: $0.17 – $0.19
🛑 Stop Loss: Just below $0.08
If the support holds, this area offers a low-risk, high-reward opportunity for spot traders targeting the next leg up.
📈 Always manage your risk. Wait for confirmation on lower timeframes if needed.

Is #XTZ Ready For a Major Breakout or Another Trap Ahead?Yello Paradisers! Are you prepared for what might be one of the sneakiest reversals brewing quietly on #XTZUSDT? Let's see the current setup of #Tezos:
💎#XTZ is trying to break out of a descending broadening wedge formation, a setup that typically signals the end of a corrective structure and the potential beginning of a major impulsive move. We’re likely witnessing the very first wave of this new impulse, and what happens next will depend entirely on how the price reacts to the overhead dynamic resistance.
💎The 1st impulsive wave appears to be nearing completion, and based on structure and current momentum, a minor pullback is both expected and healthy. This retracement will likely serve as a reset before the next leg higher begins, offering a potential entry for those who missed the breakout. However, we do not expect this correction to break below the origin of the first wave — doing so would undermine the integrity of the new trend.
💎Currently, the #XTZUSD is facing strong resistance from the EMA, which it must convincingly break and reclaim. This EMA level has repeatedly acted as a lid on price action, and until it’s cleared, any upside move remains tentative. However, if buyers step in with real volume, we could see a rapid acceleration toward the mid-term resistance at $0.916. That level has historically marked a shift in market control. And beyond it, the next major resistance lies at $1.134, a key supply zone that could trigger heavy distribution.
💎On the downside, the structure remains clean. The $0.491 – $0.516 zone is now our major support, and it must hold. If the price falls below this support and closes with weakness, it will invalidate the current bullish thesis and likely lead to a deeper correction.
Play it safe, respect the structure, and let the market come to you!
MyCryptoParadise
iFeel the success🌴

#ONDO Ready to Make a Bullish Move | Must Watch For BullsYello, Paradisers! Is #ONDO getting ready for a powerful breakout, or are we about to witness yet another bull trap? Let’s break down the real picture on #ONDOUSDT:
💎After steadily climbing inside an ascending wedge, #ONDOUSD is now pressing against a key resistance area around $1.05–$1.07. A breakout above this zone would significantly boost the probability of a bullish continuation, especially with the 50EMA providing underlying support.
💎The immediate support zone to watch is between $0.84–$0.85, aligning with the lower boundary of the channel and overlapping with a visible demand area. This is where we expect buyers to defend the trend if any pullback occurs.
💎If bulls manage to hold this zone and break through the current resistance, our next upside target is the moderate resistance level at $1.34. From there, the strong resistance sits at $1.72, which will be the key decision point for any further upside momentum.
💎On the flip side, a breakdown below $0.72, our bullish invalidation level, would nullify this setup entirely and open the door for a deeper drop, where sellers are likely to step in aggressively.
Stay patient, Paradisers. Let the breakout confirm, and only then do we strike with conviction.
MyCryptoParadise
iFeel the success🌴

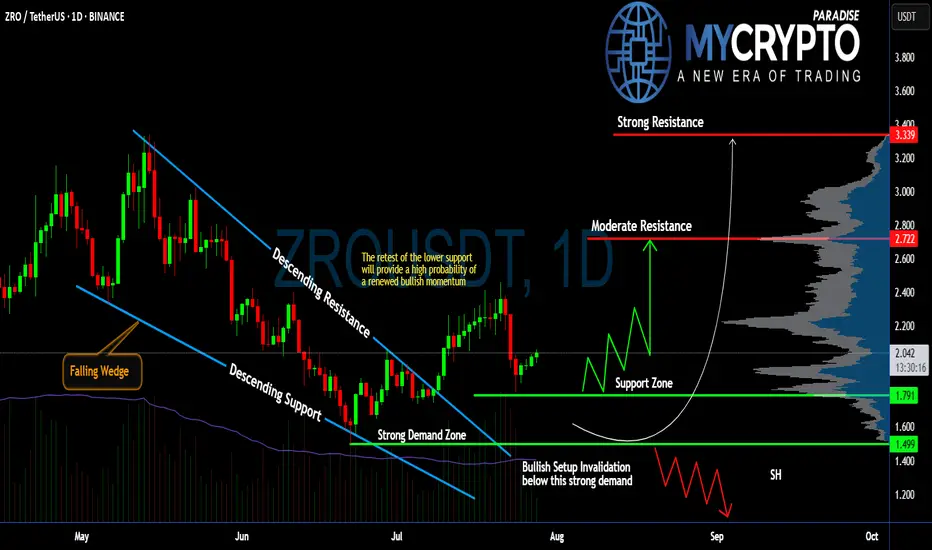
Will #ZRO Continue to Climb or Not? Must Watch For BullsYello, Paradisers! Are we witnessing the beginning of a powerful bullish reversal on #ZROUSDT, or is this just a fakeout setup? Let’s dissect this setup of #LayerZero:
💎After weeks of consistent bleeding, #ZRO has printed a classic falling wedge pattern, often a precursor to bullish reversals. This wedge has now been broken to the upside, with price currently trading around $2.037, suggesting renewed buyer interest following the breakout from descending resistance.
💎What’s crucial here is the retest of the wedge’s descending support, which aligns perfectly with a strong demand zone between $1.499 and $1.791. As long as #ZROUSD respects this zone, the probability of a bullish continuation remains high. This zone also serves as a clear invalidator for the setup—if price closes below $1.499, the bullish thesis will be off the table.
💎From here, if bulls can maintain control, we’re eyeing a potential move toward the moderate resistance at $2.722. That’s the first real hurdle where profit-taking or short interest could spike. A clean break above that level would open the path to the strong resistance around $3.339, where a heavy supply zone is likely to cap further upside.
💎Until then, we expect a series of zigzag corrections above the support zone before any sustained push higher. However, be cautious, losing the $1.499 support turns the structure bearish and could drag the price toward the $1.20 region, or lower.
Stay patient, Paradisers. Let the breakout confirm, and only then do we strike with conviction.
MyCryptoParadise
iFeel the success🌴
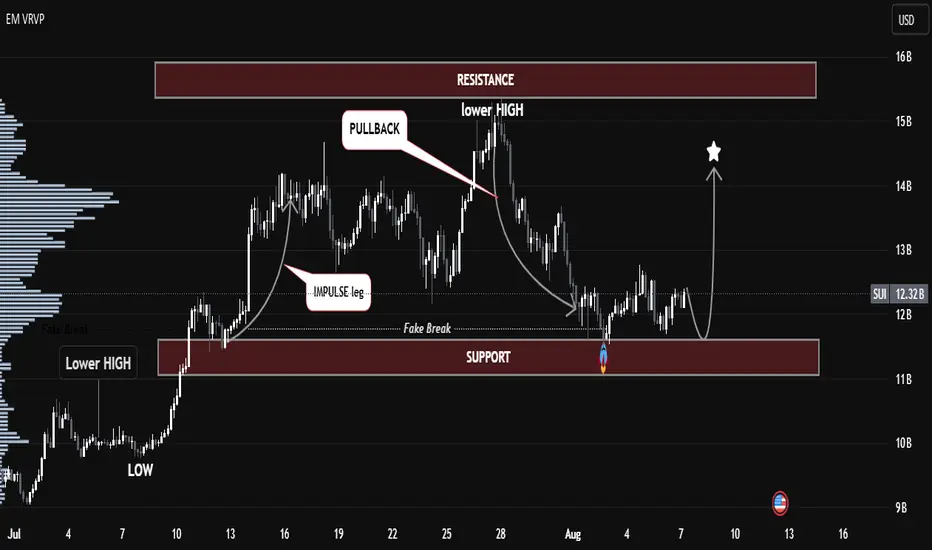
SUI/USDT – Smart Money Accumulation at Key Demand Zone📊 SUI/USDT – Smart Money Accumulation at Key Demand Zone | Bullish Outlook Ahead 🚀
The current SUI/USDT structure highlights a textbook Smart Money accumulation phase playing out at a key support zone, following a clear impulse–pullback–lower high formation.
🔍 Key Technical Insights:
🔻 Lower Highs Formation: A strong bearish structure led price back into the previous demand zone, sweeping liquidity below the support.
🎭 Fake Break Identified: Price action broke below the support briefly, indicating a liquidity grab (stop-hunt), often a precursor to bullish reversals.
🌀 Volume Node Alignment: Strong volume interest is building at the current support area, adding confluence for potential accumulation.
⚡ Projection Path: If the demand holds, expect a potential bullish reversal, targeting the previous resistance zone between 14–15B.
🧠 SMC Concepts in Play:
Fake Breakout = Liquidity Sweep
Impulse Leg = Institutional Activity
Pullback = Re-Entry for Smart Money
📈 Bullish Scenario:
Watch for confirmation around the support zone (~11B). A higher low or bullish engulfing pattern could trigger a rally toward 14B–15B resistance.
🛑 Bearish Invalidator:
A clean break and close below the 11B zone would invalidate the current bullish thesis.
BTC.D , Bitcoin Dominance Ready to RiseAfter a descending wedge pattern, Bitcoin Dominance has shown the first signs of an upward move. A CHoCH (Change of Character) has formed on the 4-hour timeframe, signaling a potential trend reversal.
We are now awaiting a retest of the broken resistance level before continuation of the bullish trend. However, the price might skip the retest and proceed directly higher.
Stay tuned for confirmation and manage your positions accordingly.

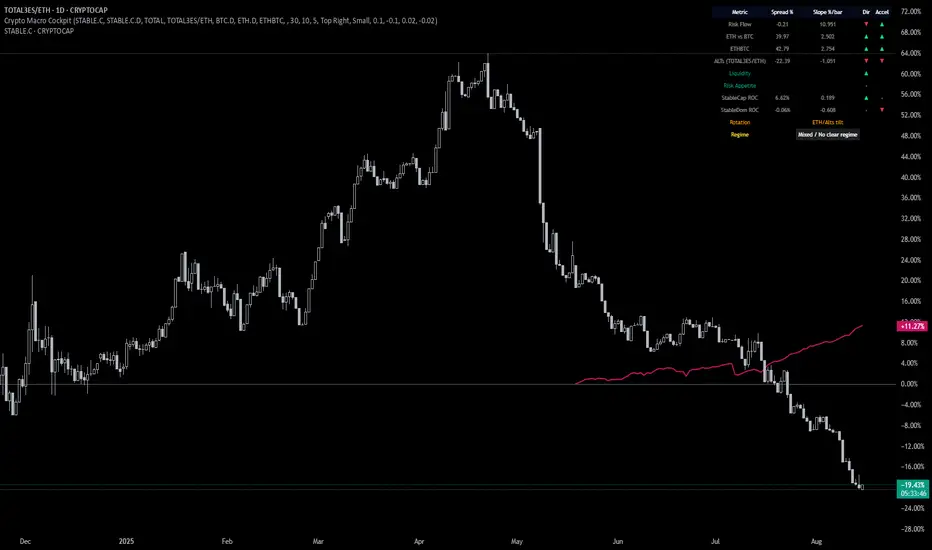
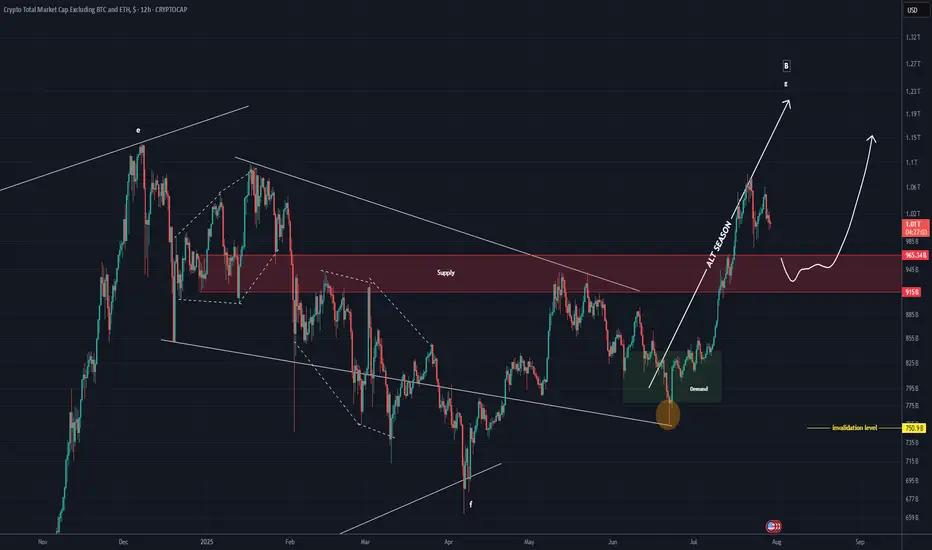
TOTAL 3 New Update (12H)This analysis is an update of the analysis you see in the "Related publications" section
This index has broken below the red zone; if a pullback to this area occurs, it may act as support again and the index could move upward
For risk management, please don't forget stop loss and capital management
Comment if you have any questions
Thank You
BTCUSD – Bearish Retracement Towards Key Liquidity Zone📊 BTCUSD – Bearish Retracement Towards Key Liquidity Zone
BTCUSD is currently trading near 116,425, showing signs of a potential bearish retracement after testing the previous resistance zone around 117,000–119,000. The chart structure highlights multiple Break of Structure (BOS) points, confirming shifts in market sentiment.
Technical Breakdown
Previous Resistance Rejection
Price failed to hold above the 117,000 mark, indicating strong selling pressure from the prior supply zone.
The rejection aligns with a liquidity grab above the recent highs, suggesting smart money distribution.
Liquidity & Fair Value Gaps
There’s a visible Liquidity/Fair Value Gap from the late July rally, which may now act as a magnet for price.
The market tends to fill these inefficiencies before deciding the next major trend move.
Target & Support Zone
The next key support and liquidity pool rests between 113,500 – 114,000, highlighted as the target zone.
This area has confluence with previous accumulation phases, making it a probable point for a bullish reaction if tested.
Volume Profile Context
Volume nodes indicate heavier trading activity below current levels, suggesting that a drop towards 114,000 could be met with increased buyer interest.
Market Outlook
Primary Bias: Short-term bearish retracement.
Immediate Target: 114,000 liquidity zone.
Invalidation: A daily close above 117,500 may shift sentiment back to bullish, opening the path toward 119,000–121,000.
Trading Insight:
Aggressive traders may look for short setups below 116,500, targeting 114,000. Conservative traders may wait for price to tap into the support/target zone for potential long opportunities with tight risk management.

"BTCUSD Technical Outlook: Support Holds, Bulls Aim for $117K""BTCUSD Technical Outlook: Support Holds, Bulls Aim for $117K"
Market Structure Overview
BOS (Break of Structure): Multiple BOS points indicate strong shifts in market direction, confirming both bullish and bearish trends across different zones.
Bearish Fair Value Gap (FVG): This zone, marked after a BOS on July 23–24, acted as a rejection area, initiating a sharp sell-off — a classic bearish imbalance fill and reversal.
Equal Lows & Sell-side Liquidity: This area attracted liquidity grabs, as smart money hunts resting stop losses below these equal lows before reversing direction.
🔸 Key Supply & Demand Zones
Previous Resistance Zone (~118,000 - 120,000): Price rejected this area after filling the imbalance, confirming it as a strong supply zone.
Support Zone (~112,000 - 113,000): Currently acting as a high-probability demand zone. Liquidity accumulation here suggests a possible bullish reversal.
📉 Liquidity Zones
Sell-side Liquidity Sweep: Price dipped below equal lows to collect liquidity, often a signal of institutional accumulation.
Liquidity/Fair Value Zone (~116,000): Acts as a magnet for price, offering potential retracement targets before any major trend continuation.
📈 Forecast & Target
Current Price: $114,061
Short-term Target: $117,546 — aligning with previous FVG imbalance and liquidity zone.
Bias: Bullish Reversal expected from support zone toward the previous inefficiency and resistance levels.
🎓 Educational Takeaways
BOS Confirmation is critical in validating trend shifts and structure breaks.
FVGs (Fair Value Gaps) highlight inefficiencies and offer high-probability reversal or continuation zones.
Liquidity Sweeps near equal lows/highs often precede smart money moves — useful for spotting entries and exits.
Volume Profile (left side) suggests higher activity zones — these areas often align with major turning points.
✅ Conclusion
BTCUSD has swept liquidity below support and is showing signs of reversal. If the bullish pressure holds above $113,000, a move toward the $117,500 zone is likely, targeting previously unfilled imbalance and trapped liquidity.

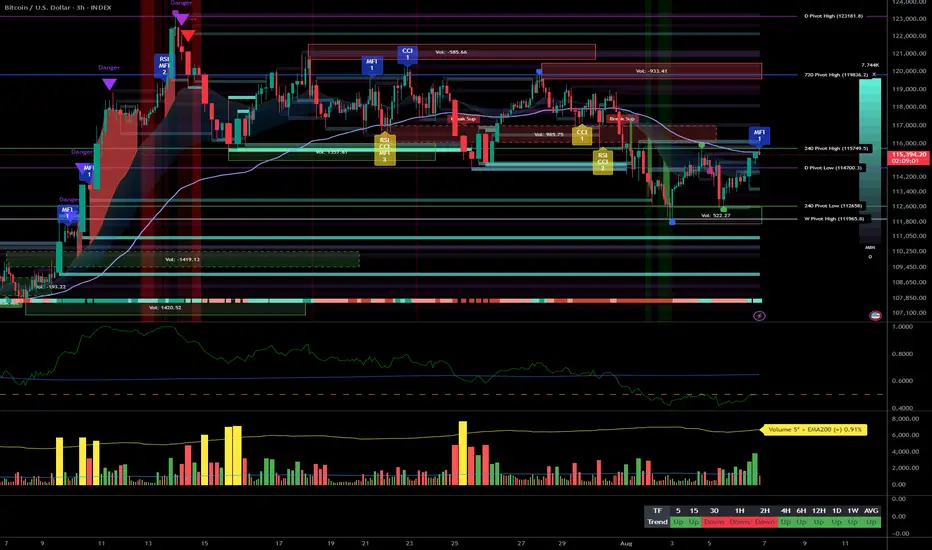
Bullish momentum holds, 111-113k breakdown will be decisive__________________________________________________________________________________
Technical Overview – Summary Points
__________________________________________________________________________________
Momentum: Structurally bullish bias on HTF (1D/12H/6H/4H) confirmed by Risk On / Risk Off Indicator showing consistent “Strong Buy” signal. Technical consolidation on LTF (2H→15min) with emerging selling pressure.
Supports / Resistances: Major supports: 1D/weekly at 111-115k. Dense resistance between 116.9-119k. Structure remains valid if price holds >111k.
Volume: Normal on HTF; episodes of extreme spikes on 30min-15min indicating possible liquidations/flush but no widespread capitulation.
Multi-TF behavior: No panic in HTF; LTF selling pressure looks more like leveraged exhaustion than a lasting bearish reversal.
__________________________________________________________________________________
Strategic Summary
__________________________________________________________________________________
Global bias: Bullish (HTF). Holding support at 111-113k is the key condition to favor accumulation.
Opportunities: Tactical accumulation ≥111k, watch for breakout >117-119k, intraday scalps on LTF volume extremes.
Risk zones: Breakdown <111k = risk of fast flush towards 107-110k; rejection below 116.9-119k = potential bull trap.
Macro catalysts: Awaiting Fed decision (September), increased volatility around calendar events, global liquidity at highs, geopolitics on watch.
Action plan: Accumulate on major supports, confirm bullish leg on break >117-119k with volume, swing stop-loss <110k.
__________________________________________________________________________________
Multi-Timeframe Analysis
__________________________________________________________________________________
1D: Uptrend structure active, weekly/daily support 114-115k, Risk On / Risk Off Indicator bullish. Healthy consolidation below old resistance ≥119k.
12H/6H/4H: Trend Up, strong range zone, sector momentum steady, no sell stress.
2H/1H: Intermediate consolidation/selling pressure. Downtrend confirmed on 1H/2H, but volume controlled.
30min/15min: Very high volumes, ISPD DIV sell signal (15min), probable distribution/exhaustion. 111-113k key support = front-line to monitor.
Summary: Bullish structural alignment on HTF, consolidation/profit-taking on LTF but no major breakdown of key supports.
__________________________________________________________________________________
Macro & On-Chain Analysis (Technical x Fundamental)
__________________________________________________________________________________
Macro: Expected Fed pivot (Sept), global liquidity at ATH, geopolitics remain uncertain but stable, weaker dollar.
BTC on-chain: Accumulation in 110-115k area, ETF outflows, no STH stress, reclaim 116.9-119k resistance is crucial for bullish reversal.
Calendar: Fed/FOMC 30/07 (pause expected), US earnings & oil data 06/08. Watch for surprise events.
R/R: Favorable long ≥111k; break >119k = validation, short on failure at 116.9-119k if support lost, swing stop <110k.
__________________________________________________________________________________
Actionable Synthesis
__________________________________________________________________________________
Swing bias: Favor tactical accumulation or active management as long as support ≥111k holds and Risk On / Risk Off Indicator remains “Strong Buy”. LTF = trading ground, HTF = maintain core positioning.
Heightened vigilance at 116.9-119k: Potential trap/breakout activation zone. Watch liquidity on pullbacks and during volume “climax”.
Stay agile, adjust stops tactically according to intraday volatility and price reaction at key support levels.
__________________________________________________________________________________
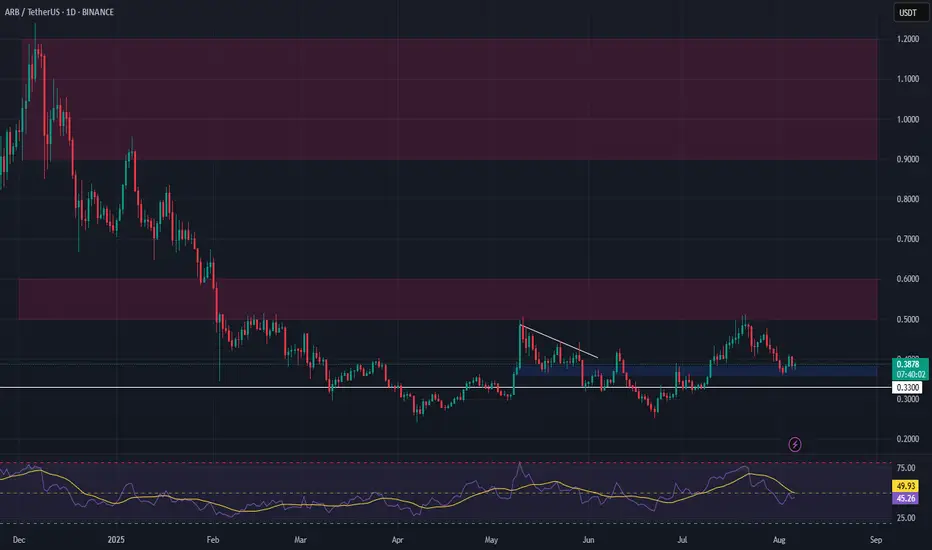
ARB Setup – Watching Key Support for Long EntryArbitrum (ARB) has pulled back into a critical support zone after recent declines. This level is showing strong buyer interest, and we’re eyeing a potential spot long entry as price consolidates near the lows.
📌 Trade Setup:
• Entry Zone: $0.386 – $0.38
• Take Profit Targets:
o 🥇 $0.50 – $0.60
o 🥈 $0.95 – $1.20
• Stop Loss: Just below $0.33
BTCUSD Technical Analysis – Smart Money Concept Based
🔍 BTCUSD Technical Analysis – Smart Money Concept Based
🕒 Timeframe: Intraday (likely 1H or 4H)
📅 Date: August 5, 2025
📉 Price: ~114,445 USD
📌 Key Zones and Observations
🔴 Previous Resistance (117,000–119,000)
This area has a strong high formed after multiple equal highs (EQH), indicating a liquidity pool above.
Price sharply rejected this zone, validating it as a significant supply zone.
🔵 Support Zone & Liquidity Pool (~112,600–113,200)
This is a high-volume node (visible on VRVP) where price consolidated previously.
Market structure suggests liquidity resting below, as indicated by the marked “Target” area at 112,648.
Smart Money may aim to sweep liquidity below this support zone before any meaningful reversal.
🟤 Order Block & Rejection at 115,210–116,065
Price tapped into a bearish order block, creating a minor change of character (ChoCH) and then started to decline.
Rejection from this zone signals distribution by institutions or Smart Money, leading toward bearish continuation.
🟢 Value Gap and Imbalance (Above 115,000)
A visible value gap still remains unfilled; however, current momentum is bearish, and price failed to reclaim it, hinting downside continuation.
🔄 Market Structure
BOS (Break of Structure) to the upside confirmed short-term bullish momentum.
CHoCH back to the downside near current price reflects bearish shift in order flow.
Price is respecting lower highs, and failing to break above 115,210 confirms a bearish bias.
🎯 Target and Outlook
Primary Bearish Target: 112,648 USD
This is a liquidity pool and previous support area where institutions may look to rebalance and accumulate.
Scenario:
If price retests 115,000–115,210 again and fails, expect strong continuation downward toward the 112,648 target.
If price breaks and holds above 116,065, bullish invalidation may occur, and we can look for higher retracement toward 117,000–119,000.
✅ Conclusion
BTCUSD is currently respecting a bearish order block, with Smart Money likely targeting liquidity resting below at 112,648 USD. Unless price breaks above 116,065 with strong volume, the bias remains bearish short-term.

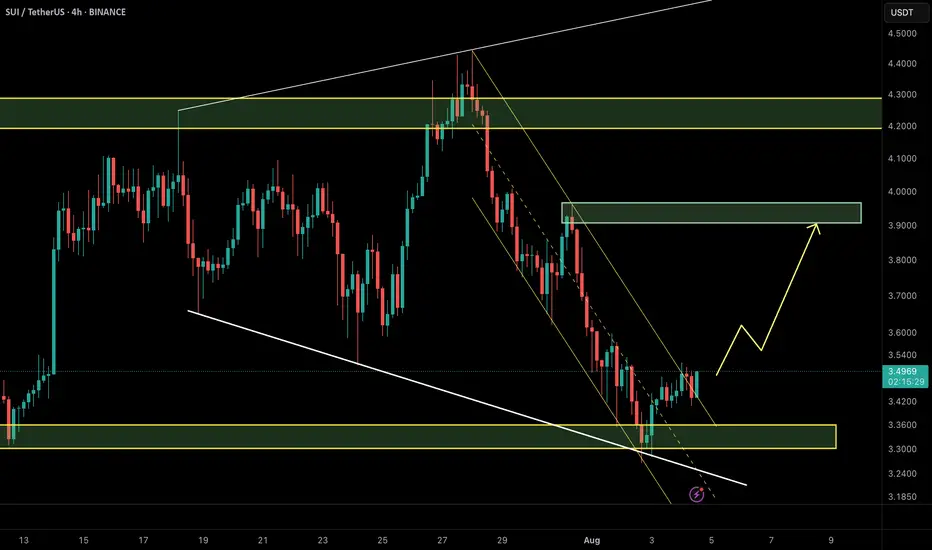
SUI/USDT – Price Outlook (2H TF)🔍 Updated Aug 4, 2025 | SMC + NeoWave
SUI has broken out of the descending channel and is currently holding above the strong demand zone around $3.35–$3.40. This zone overlaps with a bullish order block and prior trendline support.
📌 Bullish Scenario (preferred):
Price confirms support → Push toward $3.90–$4.00 supply zone.
📌 Invalidation:
A close below $3.35 invalidates the setup and suggests continuation of the correction.
💡 Tip: A breakout of structure (BOS) + mitigation of OB = solid confluence for long setups.
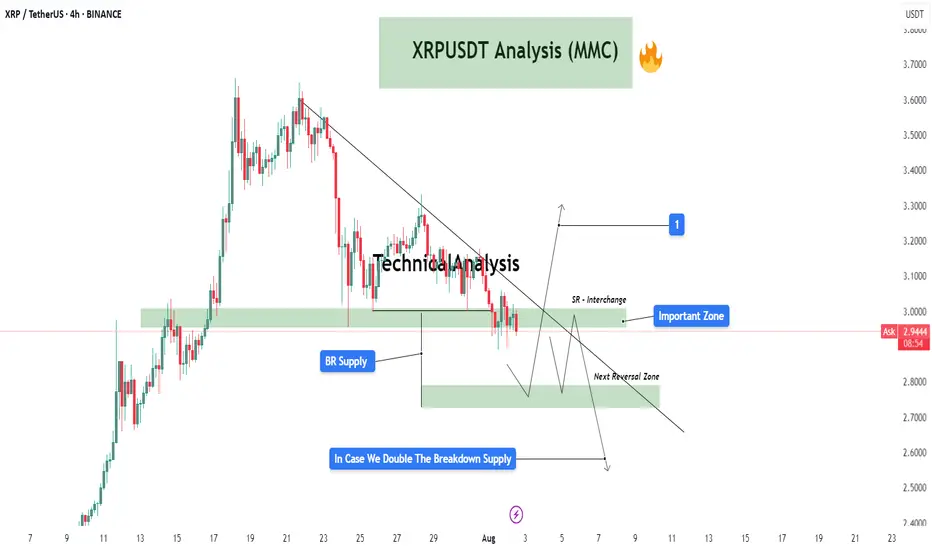
XRPUSDT Analysis (MMC) : Decision Point + Next Move Loading In this 4-hour chart of XRP/USDT, we're observing a critical structure forming under the Mirror Market Concepts (MMC) framework. Price action is compressing near an important descending trendline, suggesting that a breakout or breakdown is imminent. Let’s break it down zone by zone:
🔍 Key Zones & Price Structure:
Important Zone (SR Interchange Zone – $2.95 - $3.05)
This is a major supply-to-demand flip zone. It has served as both resistance and support in the past and is now acting as a potential interchange level. The price is hovering just below this area, retesting it after a significant bearish structure.
BR Supply Zone (Breakdown Retest Supply – $2.93 - $2.98)
After price broke down from this zone, it created a base for a retest. This level has since acted as a cap to further upside movement. It also coincides with the descending trendline, adding confluence to its strength as resistance.
Next Reversal Zone ($2.75 - $2.85)
In case the price fails to reclaim the Important Zone, we could see a bearish continuation move into the next zone of interest. This is a likely reversal or reaction area based on previous demand imprints and price imbalance.
SR Flip Watch
If price breaks above the trendline and sustains above the SR Interchange Zone, this could trigger a potential bullish breakout toward the $3.20+ region (labeled as target “1”). This move would be backed by trapped sellers and liquidity above the descending structure.
📈 Potential Scenarios:
✅ Bullish Case:
Break and close above the descending trendline.
Successful retest of the Important Zone as demand.
Push toward $3.20 - $3.30 where the next supply awaits (target 1).
❌ Bearish Case:
Rejection at the Important Zone and trendline resistance.
Breakdown below $2.90 confirms bearish pressure.
Possible liquidity sweep and reaction from the Next Reversal Zone ($2.75-$2.85).
If this zone fails to hold, continuation toward lower zones becomes likely.
🧠 MMC Perspective:
From a Mirror Market Concepts (MMC) standpoint, the market is currently at a reflection point where a decision between bulls and bears is about to play out. The clean diagonal structure plus clear horizontal liquidity pockets makes this setup ideal for anticipating manipulation traps and smart money moves.