BNB THE $1000 ATH on wayBNB did a new ATH and can complete it over $1000 in the coming time, which makes BNB a strong coin movement.
Cryptocurrency

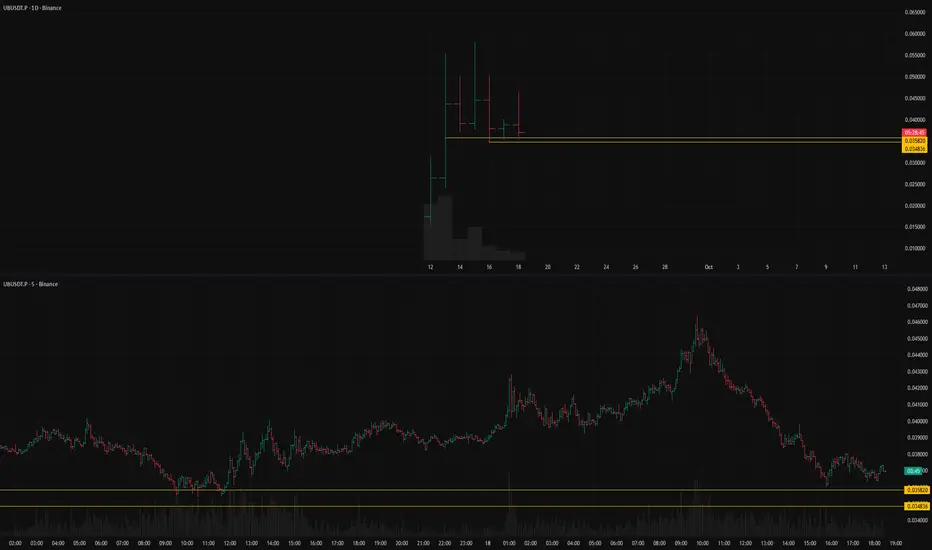
UBUSDT: short setup from daily support at 0.035820BINANCE:UBUSDT.P looks very attractive for a short setup.
There is a clear support level whose strength is not in doubt, as it has been confirmed multiple times.
Today, the asset showed a strong move up, but it ended with an even stronger drop that completely engulfed the prior rally.
Key factors for this scenario
Price void / low liquidity zone beyond level
Liquidity grab (false move against the trend)
Volatility contraction on approach
Immediate retest
Closing near the bar's extreme
Closing near the level
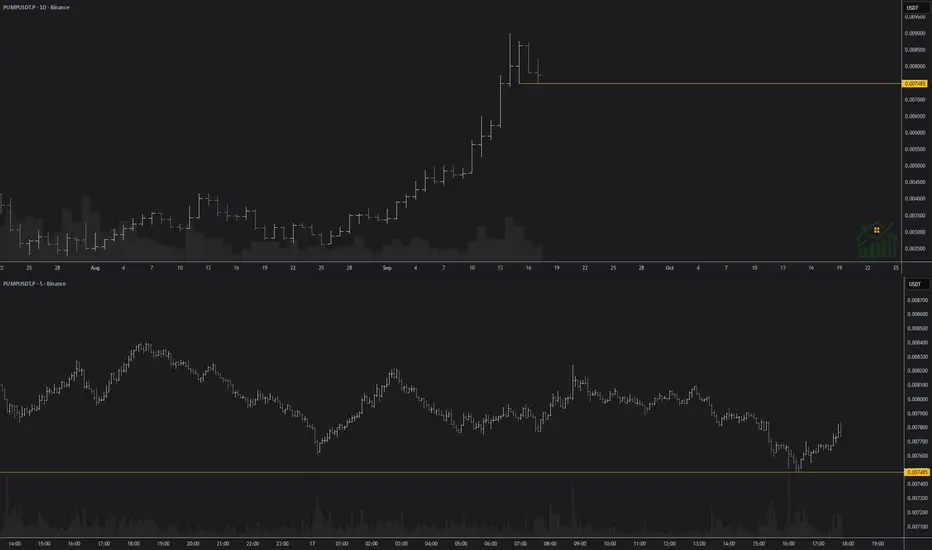
PUMPUSDT: short setup from daily support at 0.007485Today, BINANCE:PUMPUSDT.P confirmed the 0.007485 level with a precise test, which is clearly visible on the lower timeframes.
Without this confirmation, the level couldn't be considered strong. Now, we have a clear reference point to work from.
Important! The key is how, when, and from where the price approaches this level.
Key factors for this scenario
Price void / low liquidity zone beyond level
Volatility contraction on approach
Immediate retest
Closing near the level
Closing near the bar's extreme
Of course, we must remember that the asset can reverse and move up sharply at any moment. This scenario should not be ruled out.
Bitcoin’s 1.5-2 year downtrend has begun. (Phase 1)As predicted in the previous analysis, Bitcoin saw its two-year price ceiling at around $109K when Trump entered the White House, and Bitcoin will have downtrend for about a 1.5-2 year.
This decline will have 3 phases, which I have shown in the first phase chart in 3 stages.
As you can see in the chart, in the first phase, Bitcoin will fall to around $81K and then rise again to near the price ceiling. But in my opinion, it will not be able to create a new price ceiling and will have a heavier decline towards the $50K-$60K range.
@JalilRafieefard
February 18, 2025

BNBUSD Is it about to have the run of its life??Binance Coin (BNBUSD) made yet another All Time High (ATH) this week, extending the strong rally it's been having since June 23 2025. That was when it hit its 1W MA50 (blue trend-line) and rebounded as it confirmed it s a Support.
That was the very same action that BNB took during the accumulation phase (blue Channel Up) of its previous Cycle on August 31 2020. As you can see, even the 1W RSI sequences between the two fractals match and what happened then was a massive parabolic rally (green) 3 months later that peaked a little above the 2.618 Fibonacci extension level.
With BNB coming off the current accumulation phase rather aggressively, do you think the market can repeat such rally to the 2.618 Fib ext, which would place us a little over $5000? Conservative targets still have BNB's peak zone within $1600 - 2000.
-------------------------------------------------------------------------------
** Please LIKE 👍, FOLLOW ✅, SHARE 🙌 and COMMENT ✍ if you enjoy this idea! Also share your ideas and charts in the comments section below! This is best way to keep it relevant, support us, keep the content here free and allow the idea to reach as many people as possible. **
-------------------------------------------------------------------------------
💸💸💸💸💸💸
👇 👇 👇 👇 👇 👇

Altseason Confirmed?The crypto total market cap excluding BTC and ETH has officially broken out of a multi-year consolidation, completing a textbook Cup & Handle pattern on the weekly chart. This structure has been forming since the 2021 peak, followed by the deep 2022 bear market and a steady recovery through 2023–2025. The breakout above the $1.1T–$1.16T resistance zone is a strong signal of renewed strength in altcoins, with volume confirming bullish momentum.
With this breakout, the market opens the door for a potential rally toward the $2.0T level;, which aligns with previous highs and measured move targets. As BTC and ETH dominance stabilizes, capital rotation into altcoins could accelerate, fueling this next leg higher.
Cheers
Hexa

BE AWARE OF 118K BTC REVERSALMorning folks,
here is just a light update on situation. BTC now stands at 118K resistance area and here it could either to keep going higher, or, start forming the right arm of our bigger H&S pattern.
Just watch for signs of reversal, say H&S pattern here is possible. Depending on what you want to do - either wait (if you bullish) or you could use it (bearish).

XRPUSD Is $5.00 next??XRP (XRPUSD) has been trading within a Channel Up since the April 07 'Trade War' market bottom and in the past 6 days it has been testing (and holding) the 1D MA50 (blue trend-line) as a Support.
Given that this is being done after the Bearish Leg bottomed (green Arc pattern) on the 1D MA100 (green trend-line), this 1D MA50 test is probably the last technical confirmation that the current Bullish Leg needs before it starts rising aggressively, similar to what happened in July.
That Bullish Leg peaked on the 2.0 Fibonacci extension level. If this sequence is repeated, expect the next high to be around $5.00.
-------------------------------------------------------------------------------
** Please LIKE 👍, FOLLOW ✅, SHARE 🙌 and COMMENT ✍ if you enjoy this idea! Also share your ideas and charts in the comments section below! This is best way to keep it relevant, support us, keep the content here free and allow the idea to reach as many people as possible. **
-------------------------------------------------------------------------------
💸💸💸💸💸💸
👇 👇 👇 👇 👇 👇

ETH re-distribution patternHere we have a classic Wyckoff re-distribution pattern for a continuation to the downside. I'm looking for 4200 by Friday.

ETHEREUM Is it realistic to expect last Cycle's rally?Ethereum (ETHUSD) has been practically consolidating since the mid-August High, following an impressive rally on the April 07 Low. Technically it is coming off a 1W MA50/100 Bullish Cross.
It is the exact same pattern that confirmed ETH's massive parabolic rise (green Channel Up) during the previous Cycle in August 17 2020. The 1W RSI fractals between the two sequences are similar.
However, time-wise we are not in the same stage as last Cycle, in fact we are much closer to the end of the 4-year Cycle model. If there is still some time to repeat such a parabolic run, the price is 'limited' by the 1.618 Fibonacci extension at $13500, which again will be a wonderful and increasingly optimistic target for this Cycle Top.
Do you think it is realistic to expect such repeat at this stage?
-------------------------------------------------------------------------------
** Please LIKE 👍, FOLLOW ✅, SHARE 🙌 and COMMENT ✍ if you enjoy this idea! Also share your ideas and charts in the comments section below! This is best way to keep it relevant, support us, keep the content here free and allow the idea to reach as many people as possible. **
-------------------------------------------------------------------------------
💸💸💸💸💸💸
👇 👇 👇 👇 👇 👇

BITCOIN 1W Stoch RSI completed a Bullish Cross. Expect new ATH.Bitcoin (BTCUSD) just completed a Bullish Cross on its 1W STOCH RSI and that's the first time it does so since April 07 2025. That was as we know, the previous market bottom of the Trade War correction.
In fact, every 1W STOCH RSI Bullish Cross has been a buy signal within this Bull Cycle's Channel Up (since November 2022), most of which huge. The April 2025 Bullish Leg rose by +65.92% and that has been the 'weakest' one of this Channel Up.
As a result, if we get the bear minimum of +65.92% this time around too, expect a new High around $175000, which should be the Cycle Top and in our opinion the absolute maximum that this Cycle can give.
Do you think we will go that high? Feel free to let us know in the comments section below!
-------------------------------------------------------------------------------
** Please LIKE 👍, FOLLOW ✅, SHARE 🙌 and COMMENT ✍ if you enjoy this idea! Also share your ideas and charts in the comments section below! This is best way to keep it relevant, support us, keep the content here free and allow the idea to reach as many people as possible. **
-------------------------------------------------------------------------------
💸💸💸💸💸💸
👇 👇 👇 👇 👇 👇

BTC idea for the weekWithin this range, we have what I have posted is a temporary bear trap that runs us to the range high which is also called supply. I don't believe we'll make it past this point and we will continue the downward trend from 120+ K this should run us to around 90,000 maybe less before a significant accumulation and short markup phase

PEPE ANALYSIS🔮#PEPE Analysis 💰💰
#PEPE is trading in a symmetrical triangle in a daily time frame and if it breakouts with high volume then we can see a bullish momentum in #PEPE. Before that we will see little bit bearish movement towards its support zone and than a bullish movement.
🔖 Current Price: $0.00001091
⏳ Target Price: $0.00001413
⁉️ What to do?
- We can trade according to the chart and make some profits in #PEPE. Keep your eyes on the chart, observe trading volume and stay accustom to market moves.💲💲
#PEPE #Cryptocurrency #Pump #DYOR

BTC Price Action: Bulls vs BearsBitcoin has shown a gradual recovery after a prolonged corrective phase, with market structure leaning toward a constructive buildup. Fundamentally, sentiment is influenced by global macro conditions—investors are watching U.S. monetary policy signals, while stable demand from institutions and long-term holders continues to provide a supportive backdrop. On-chain activity remains steady, with balanced exchange inflows and outflows suggesting no extreme directional pressure in the near term.
From a technical perspective, the market has shifted momentum from bearish flows into a developing bullish sequence. The recent break of structure on the 4H timeframe highlights strengthening upside intent, though price is still moving within a broader accumulation phase. Current flows suggest the possibility of a short-term dip for liquidity before continuation to higher levels, aligning with the overall constructive weekly outlook.

Ripple Finished A Correction Within Bullish TrendRipple Finished A Correction Within Bullish Trend, as we see it recovering in an impulsive fashion, which can extend the rally from technical perspective and by Elliott wave model.
Ripple with ticker XRPUSD is waking up from projected support after an ABC correction in wave IV, so bulls could be back, as we see it breaking above channel resistance line and important 3.08 level. So after current short-term pullback, we may see more gains and another push toward all-time highs for wave V, possibly to the 4-5 area.

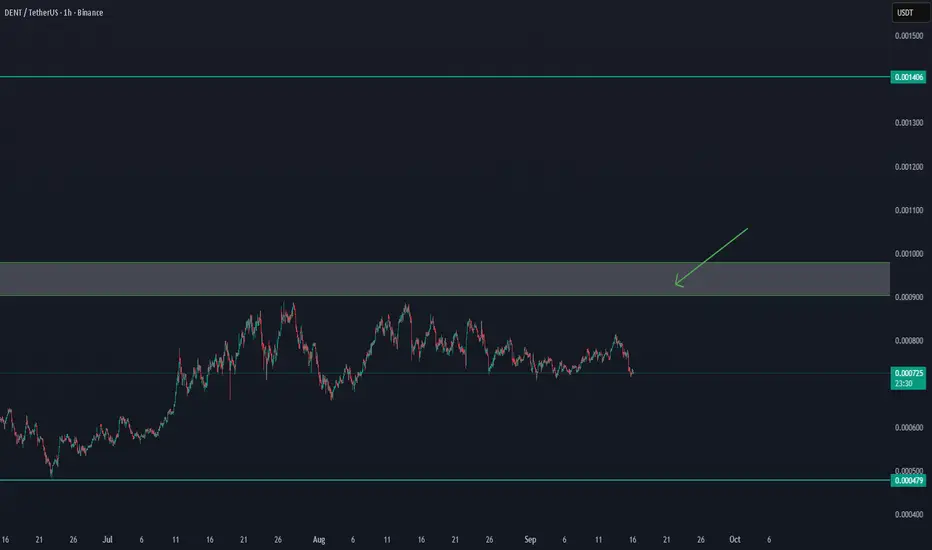
DENT'/USDT UPDATE Confirmation after $0,00093DENT/USDT UPDATE
DENT is showing signs of strength, but we need confirmation.
Key level to watch: $0.00093
✅ A clear breakout and hold above $0.00093 could trigger further upside momentum.
⚠️ Until then, price remains in a consolidation zone and risk of pullback is present.
Plan:
Wait for confirmation above $0.00093 before re-entering longs.
Next resistance levels to monitor: $0.00105 – $0.00120
Support remains around $0.00085 – $0.00080
Conclusion: Break and retest of $0.00093 will be the bullish signal for continuation.
Long Term Btc PlanI can see BTC going to take 85k.
People think "Below 90k bull run is over"
Would cause extreme fear/panic in the markets if broken below 90k. basically reaching 85-86k would be cause just by paper hands at the end being scared out of their positions.
Currently Looking for bigger shorts and small longs only. Exception if BTC breaks above 118.5k and shows bullish signals.
Will look for reenter spot below 90/100k depends on situation.
Want to see Diamond Top playout on 4h, then break above it or reject from 786/886 fibb and enter big short to 105/90s.
The Long/Short Positions on chart is worth looking at, I have alerts near all entries/SL/Tp and even S/R.
I had a thought that next big crash might be caused by an exchange going tits up at near top, and I have intuition it might be MEXC.
NOT YOUR KEYS NOT YOUR ASSETS.

BTC short at 116000 to 110500Short BTC116000 looks doable.
E: 116000
SL: 117500
TP1: 113555
TP2: 110500
TP3: 105000
Possibility of 96k, but I doubt it at this moment. would need to take 119k first in my belief, and now there is too many bearish signs for that.
Currently BTC moving after bearish Symmetrical Triangle, forming Diamond Top pattern, perfect entry would be around 116000.
Looks like February 2025

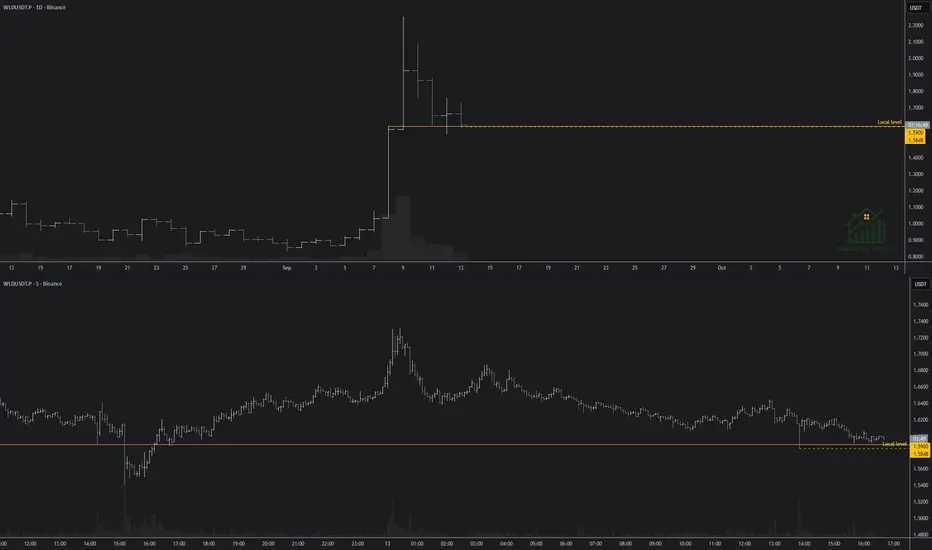
WLDUSDT: Short setup from daily support at 1.5900BINANCE:WLDUSDT.P has a mirror level, which was first resistance and is now support. Although a deep false breakout occurred yesterday, the asset reacted to the level, confirming its relevance. Today, another anomalously large bar on the 5-minute timeframe confirmed the presence of this level. Currently, a gradual squeeze toward the level with low volatility is observed.
Additional consolidation is needed to make a decision about opening a trade. I am adjusting the level to 1.5848, considering the latest false breakout.
In case of increased volatility or another false breakout, I will remove the asset from the watchlist, as it will become choppy price action at the level.
Scenario:
Price void / low liquidity zone beyond level
Volatility contraction on approach
Immediate retest
No reaction after a false break
No reaction after a false break:
Volatility contraction on approach
Momentum stall at the level
Repeated precise tests of the level ("sticking")
Consolidation with price compression (squeeze)
No reaction after a false break
BITCOIN Will it pull back??Bitcoin (BTCUSD) just formed a 4H Golden Cross, technically a bullish pattern, which usually emerges at the start of uptrends.
Such a formation emerged on both main Channel Up patterns since the April 07 Trade War bottom. The interesting feature however is that, following every 4H Golden Cross, the price always pulled back to its 4H MA200 (orange trend-line).
With BTC having started the week on the back foot, the 4H MA200 currently stands at $113600. Ahead of the Fed Rate Decision this week, a 'volatility' pull-back would align the news with this technical need.
Do you think we'll get that pull-back? Feel free to let us know in the comments section below!
-------------------------------------------------------------------------------
** Please LIKE 👍, FOLLOW ✅, SHARE 🙌 and COMMENT ✍ if you enjoy this idea! Also share your ideas and charts in the comments section below! This is best way to keep it relevant, support us, keep the content here free and allow the idea to reach as many people as possible. **
-------------------------------------------------------------------------------
💸💸💸💸💸💸
👇 👇 👇 👇 👇 👇

Bitcoin — resistance test and growth targetsBitcoin is trading near the 115,000 zone, facing key resistance at the 0.705–0.79 Fibonacci levels. A breakout above 116,900 would pave the way toward the next target at 125,000. In case of a pullback, support lies at 112,000 and 110,000, with deeper support near 104,000.
From a fundamental perspective, cryptocurrencies remain supported by institutional inflows and the demand for digital assets as an inflation hedge. Growth potential persists as long as equity markets show strength and the US dollar remains under pressure.
A stock you buy and forget — the longer you hold, the more you earn.

DOGE rejected on its 6-month Resistance. What's next?Dogecoin (DOGEUSD) eventually made the bullish break-out we talked about on our last analysis above the top (Lower Highs trend-line) of the Triangle but got emphatically rejected on its 6-month Higher Highs trend-line.
That is the main Resistance holding since March 03. Last time it delivered a rejection that tested the 1D MA50 (red trend-line) before a new rebound. As a result, if the price closes a candle below the 4H MA50 (blue trend-line), it is more likely to see a new 1D MA50 test around 0.23000 before the decisive rebound that might attempt to break above the 6-month Resistance.
If the 4H MA50 holds, we could go for the Resistance break-out immediately. In either case, our 0.4100 medium-term Target stands.
-------------------------------------------------------------------------------
** Please LIKE 👍, FOLLOW ✅, SHARE 🙌 and COMMENT ✍ if you enjoy this idea! Also share your ideas and charts in the comments section below! This is best way to keep it relevant, support us, keep the content here free and allow the idea to reach as many people as possible. **
-------------------------------------------------------------------------------
💸💸💸💸💸💸
👇 👇 👇 👇 👇 👇

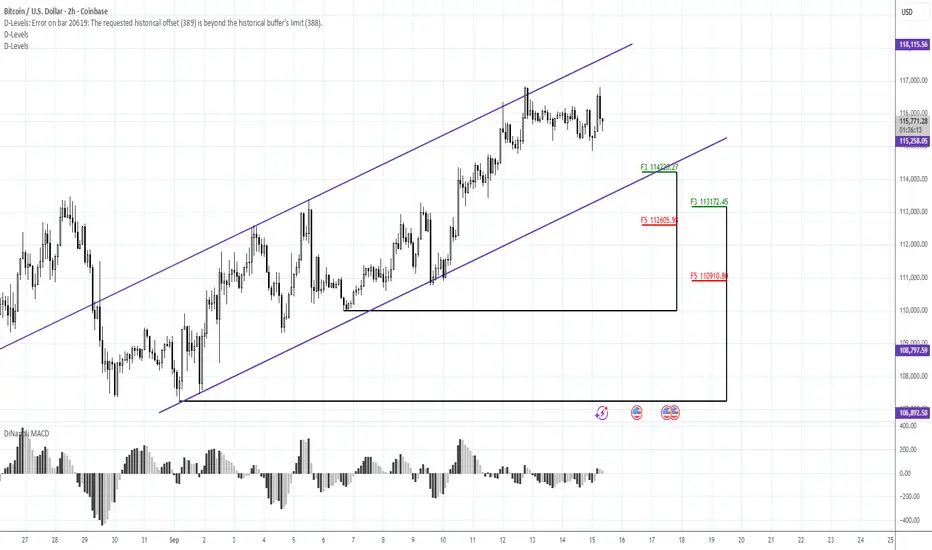
BE AWARE OF 111K BTC RETRACEMENT IF LARGER H&S STARTS FORMINGMorning folks,
So, our 116.15K target is perfectly met. What's next? First is, some quiet time should be until the Fed meeting. As market hits upside AB=CD, forming daily "222" Sell around resistance area, it is reasonable to suggest a pullback.
Normally, (before BTC proceeds to 119K target here) is to expect the pullback to nearest two levels - 114+K and 112.60-113.17K K-area as it is shown on 1H chart. But, we also do not exclude scenario of a bigger reverse H&S
So, if you will see that market is dropping further - keep an eye on 111K support. This is the last bullish outpost for short-term tendency. Drop to 111K doesn't mean yet that the upside game is over.
So, let's watch first for most common scenario of retracement, but also keep in mind 111K level. We do not consider any bearish trades for now and watch for deeps to buy.
I mark this idea as "bearish" just because of expected retracement. In general we have a bullish view.