BTC 108-110K Vital area is TestingMorning folks,
Not many things to say for now, as major problem stands in fundamental area - US liquidity drought. S. Bessent grabs everything that he could and even more. He already finished RRP source totally and now US Treasury intends to put his hands in Banking Reserves. They still need ~ 350 Bln for their TGA Fed account and another 250Bln of net debt borrowing.
The major question whether BTC will able to hold this? So we do not want to take part in this adventure, especially with Jackson Hole meeting right around the corner.
We suggest to watch for market reaction on this support area and rely on clear patterns. If somehow this area will be broken, BTC could return back into 80-100K trading range. Many things will depend on close price of this week.
So, stay aside for now.
Cryptocurrency

VARUN BEVERAGES 1D TIMEFRAMEWATCH VBL on daily timeframe, entry after trendline break(525)
2% stop loss and 1target 6% and 2target 12%
add in your watchlist
this is for education purpose only.
do your analysis first.

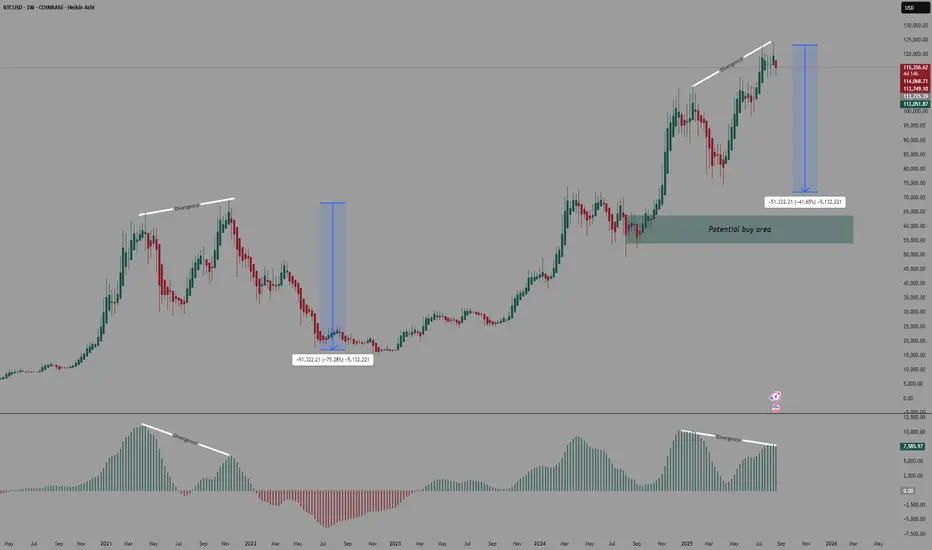
Bitcoin going back homeMy analysis indicates that there is a high chance that Bitcoin starts a major correction right now.
This is not financial advice; do your own research.
Price should plummet ~30% in the next 6 weeks.
This idea can be totally wrong, and the upside move can continue, but the probability makes it worth it for me to take the risk, so I'm going short.
What do you think will happen in the next 6 weeks?
A. We will see a new ATH.
B. Nothing will happen; the price will go sideways.
C. The price will break down the 100k support.
Let me know in the comments.

BTCUSD set to rise $124482?BTCUSD trade setup for today :
Before we look at potential entry in this pair first let’s look at multiple timeframe analysis in this market.
Monthly: 124482 Monthly resistance price has got rejection strongly from the top
Weekly: Price has just got just broken out of the support
Daily: Price on the daily significant support level
Entry timeframe 4H : Price has printed 4h has got rejected strongly from the daily support level.
Possible trade recommendation : Bullish trade with high probability set up

BITCOIN 2020 fractal gives huge buy signal now.Bitcoin (BTCUSD) broke below its 1D MA50 (blue trend-line) emphatically for the first time in 2 months, sounding short-term fear alarms ahead of the key macroeconomic news of this week. The 1D RSI hit 40.00 however, which has been an automatic buy on both major recent lows (August 01 and June 21).
Short-term aside, it is a fractal from BTC's last Cycle in 2020 (chart on the right) that perhaps offers the most comprehensive long-term outlook, which is what has always helped us maintain an objective, stress-free perspective.
As you can see, both today and 2020 fractals display not only similar price actions but also RSI sequences. Even though naturally the 2020 rebound on the Pivot trend-line has been way more aggressive as the market was still recovering and adjusting the price from the COVID crash, today's price action display's similar phases but in a more sustainable rise.
Based on the RSI fractals, we could be in similar phase as early December 2020. This suggests that there is still upside potential that may extend to as high as 150 - 170k before this Cycle is over.
Do you think that this is a solid Profit Zone for the Cycle? Feel free to let us know in the comments section below!
-------------------------------------------------------------------------------
** Please LIKE 👍, FOLLOW ✅, SHARE 🙌 and COMMENT ✍ if you enjoy this idea! Also share your ideas and charts in the comments section below! This is best way to keep it relevant, support us, keep the content here free and allow the idea to reach as many people as possible. **
-------------------------------------------------------------------------------
💸💸💸💸💸💸
👇 👇 👇 👇 👇 👇

Bitcoin possible correction?📈 Hey Traders!
Here’s a fresh outlook from my trading desk. If you’ve been following me for a while, you already know my approach:
🧩 I trade Supply & Demand zones using Heikin Ashi chart on the 4H timeframe.
🧠 I keep it mechanical and clean — no messy charts, no guessing games.
❌ No trendlines, no fixed sessions, no patterns, no indicator overload.
❌ No overanalyzing market structure or imbalances.
❌ No scalping, and no need to be glued to the screen.
✅ I trade exclusively with limit orders, so it’s more of a set-and-forget style.
✅ This means more freedom, less screen time, and a focus on quality setups.
✅ Just a simplified, structured plan and a calm mindset.
💬 Let’s Talk:
💡Do you trade supply & demand too ?
💡What’s your go-to timeframe ?
💡Ever tried Heikin Ashi ?
📩 Got questions about my strategy or setup? Drop them below — ask me anything, I’m here to share.
Let’s grow together and keep it simple. 👊
Will Bitcoin Able to Breakdown Below $111,950?On the daily timeframe, Bitcoin CRYPTOCAP:BTC is showing signs of potentially forming a Double Top reversal pattern , indicating a possible trend shift from bullish to bearish. Should the price break below $111,950, Bitcoin could decline toward the $104,320 range, which also coincides with a fair value gap area.
Although the liquidation map from Coinglass highlights liquidation clusters between $110,841 and $111,905, traders and investors are advised to remain cautious in anticipating Bitcoin’s volatile price movements.

BTCUSDTHello Traders! 👋
What are your thoughts on BITCOIN?
After setting a new high, Bitcoin failed to hold above the broken resistance zone and was rejected, falling back below the previously breached level.
The ascending trendline has also been broken, and price is currently attempting a pullback to the broken structure. As long as BTC stays below the resistance zone, we expect a move lower toward the next key support levels.
Bigger picture outlook remains bullish on higher timeframes, but in the short term, a deeper correction is likely.
Invalidation: A strong breakout and daily close above the resistance zone would negate the bearish short-term scenario and resume the broader uptrend.
Don’t forget to like and share your thoughts in the comments! ❤️

ENAUSD 1D Golden Cross targets 1.10500.Ethena (ENAUSD) has been trading within a Triangle pattern ever since it's very start and since the June 22 Low it's been unfolding the new Bullish Leg
Following the formation of a 1D Golden Cross (August 08), this sequence resembles the November 28 2024 Bullish Cross, which was the pattern's previous Bullish Leg that peaked just above the 0.9 Fibonacci retracement level.
Based on that, our short-term Target is 1.10500 right at the top of the Triangle.
-------------------------------------------------------------------------------
** Please LIKE 👍, FOLLOW ✅, SHARE 🙌 and COMMENT ✍ if you enjoy this idea! Also share your ideas and charts in the comments section below! This is best way to keep it relevant, support us, keep the content here free and allow the idea to reach as many people as possible. **
-------------------------------------------------------------------------------
💸💸💸💸💸💸
👇 👇 👇 👇 👇 👇

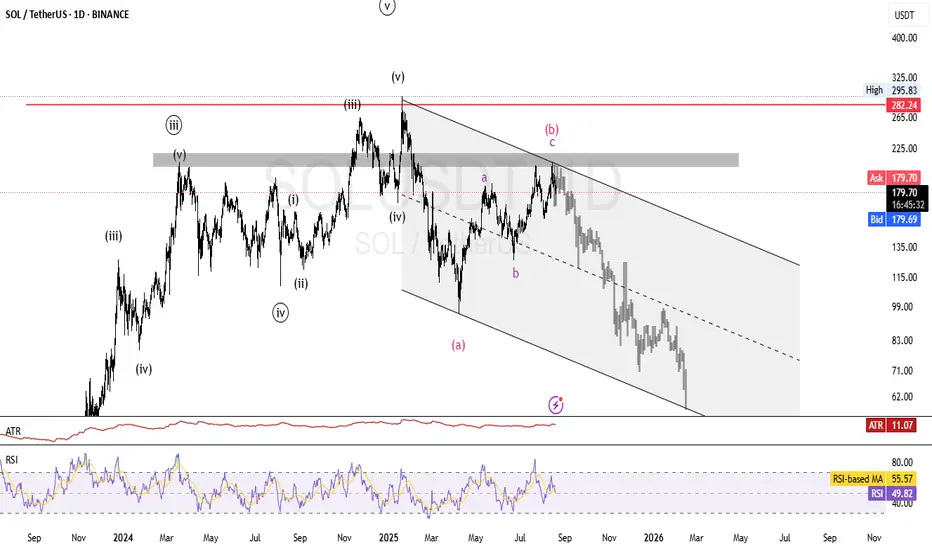
SOLUSDT: Elliot waves Analysis Hello. As you can see in the Solana chart, the analysis is based on Elliott waves in the long term. This is only a perspective and cannot be the basis for trading, but it seems that after reaching the deadline area, we can expect a continuation of the correction for wave C. So keep this perspective in mind, as it is possible.
BITCOIN Below its 1D MA50. Is there any Support?Bitcoin (BTCUSD) broke today below its 1D MA50 (blue trend-line) for the first time since July 02, having previously rebounded on it (August 02) on a perfect technical bounce that delivered a new All Time High (ATH).
Naturally, the 1D MA50 is the first medium-term line of Support and last time it broke convincingly, the price found a bottom (June 22) closer to the 1D MA100 (green trend-line). That was during BTC's previous Accumulation Phase of the 4-month Channel Up.
If that pattern is repeated, then Bitcoin's next Support could be within 112000 - 111000. On top of that, it would be useful to keep an eye on the 1D RSI, which is printing a pattern similar to he previous Accumulation Phase that bottomed on the 39.00 level.
As far as the next High is concerned, if it repeats the +22.72% rise that the previous Bullish Legs delivered from the 1D MA50 contact, then we're potentially looking at $137000 as the pattern's next Higher High.
So what's your view? Do you think the 1D MA100 will come to BTC's rescue and push it to $137k? Feel free to let us know in the comments section below!
-------------------------------------------------------------------------------
** Please LIKE 👍, FOLLOW ✅, SHARE 🙌 and COMMENT ✍ if you enjoy this idea! Also share your ideas and charts in the comments section below! This is best way to keep it relevant, support us, keep the content here free and allow the idea to reach as many people as possible. **
-------------------------------------------------------------------------------
💸💸💸💸💸💸
👇 👇 👇 👇 👇 👇

114-114.50K is Vital in short-termMorning folks,
So, potential patterns that we discussed last time even had no chances to be formed, market just collapsed. It is not a surprising moment. In our weekly reports we paid a lot of attention to the US liquidity as a main fundamental driving factor. The maths here is very simple 1+Trln borrowing in 2 months. It is yet to borrow net ~250-300 Bln, while RRP liquidity source is exhausted already. Additionally US Treasury need to accumulate 300 Bln more on its TGA account. All this liquidity will be drained from the market. BTC will be under direct impact of this stuff.
Now 114 K support area seems vital in short term. We intend to watch for patterns around it and week close price. If BTC drops lower, next area to watch is 110-111K support. I do not want to speak what will happen if it will be broken, but don't exclude retracement back to 70-80K area in this case.
To remind you we still have all-time 127K target. At least following normal technical behavior, I hope that BTC will try to reach it first, before collapse will happen. This is the reason of our special attention to 114K support.

LUMIA/USDT WILL THIS COIN FINALLY BREAK UP $1Lumia shows strong potential for new volume. Real-time data will confirm this. Once confirmation is in place, the coin is likely to rise — and we’ll provide follow-up updates
This coin can have risk, and it's not a high-quality choice.

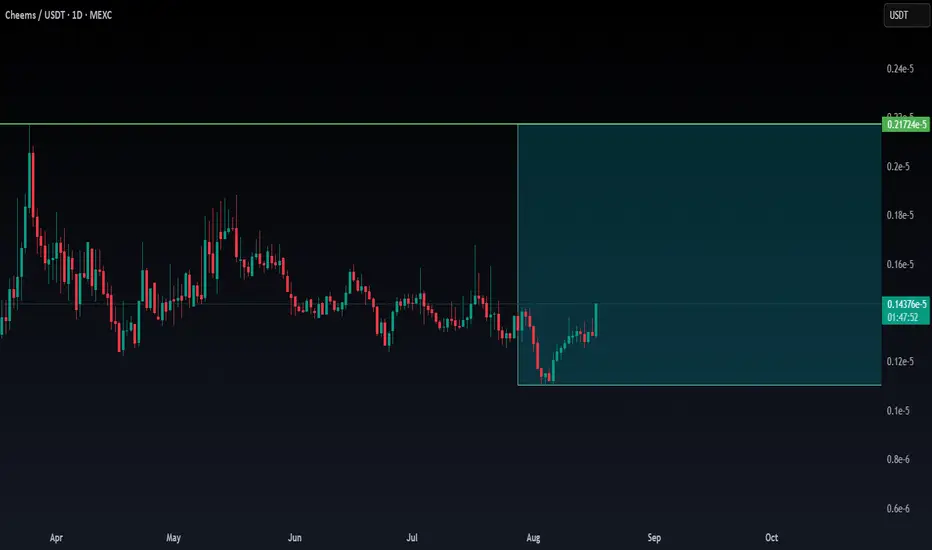
CHEEMS_USDT Can this coin make it on low time frame?Cheems seems to have interesting level confirmation. What could be confirmed in the coming hours?
For this reason, follow this day trade option to see the possibility.
In case there is a confirmation, the update will get a follow-up.
Chainlink (LINK)LINK doesn't need any introduction; it has a great project, a great community, and has also given great growth. It seems the corrective wave has ended at 0.382 Fibonacci retracement and now the price is about to break the consolidation triangle-shaped area. Let's see how things unfold.

GALA Breakout Alert!🚨 INDEX:GALA Breakout Alert! 🚨
INDEX:GALA is currently testing the red resistance zone 🔴
If price breaks out, the first target will be the green line level 🎯
A confirmed breakout here would signal bullish continuation and could push price higher ✅

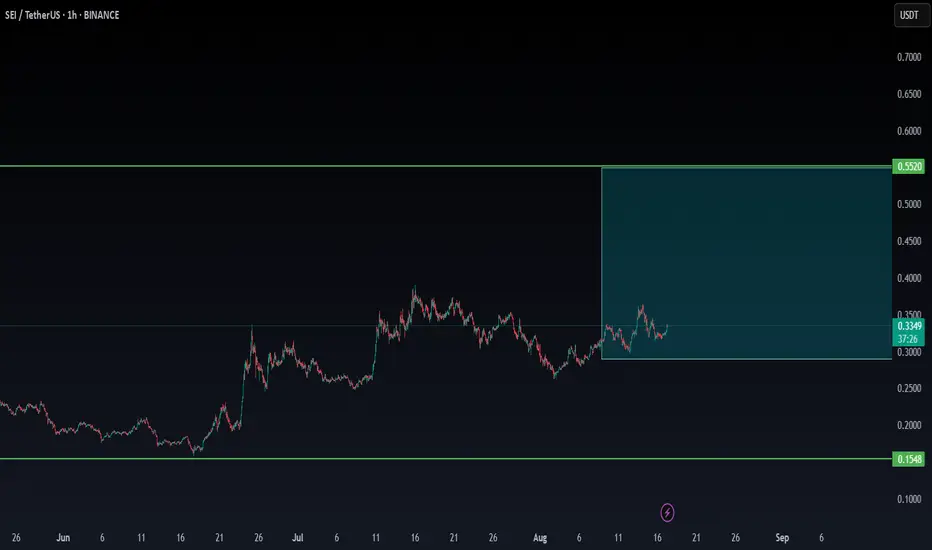
SEI/USDT NEW INCREASE VOLUMESEI is showing a new trend in volume, which may be confirmed in the coming time frames. We will continue to monitor the trend to see if confirmation occurs
SCRT/USDT NEW VOLUME TRADESCRT is showing a new trend in volume, which may be confirmed in the coming time frames. We will continue to monitor the trend to see if confirmation occurs.

POND/USDT AT A BREAK LEVELPOND/USDT: If it breaks and holds above $0.00938 with confirmation, it could get interesting over time. For now, I’m just watching to see how it behaves; without confirmation, it remains risky.
When it's able to confirm the $0,00938 with confirmation, the coin could break to up $0,012
We will follow the coin if it's able to confirm the break and for updates/new targets.
If there is real interest, it should be confirmed in the coming 4H

Bitcoin Dominance and DXY pattern correlation!Is the bitcoin dominance correlated to the DXY?
So far... I think so. Chart pattern wise anyway.
So, according to the DXY, if the Dominance follows this pattern we should be in the biggest altseason to date. But it could be the last one for a while as there could be a 90% to 95% flush out of alts coming.
This would crush all altcoin belief and get rid of all the shit coins. Lets be honest at this point it's needed to flush out all this garbage, it's too much.
Then knew cycle would start over and follow with a massive altseason bigger than anything ever. Don't get excited just yet, it not happen until 2033 or later.
Also according to this chart, dominace can go a bit higher to 72% before it starts to fall. lets see
That's all I have here, I just wanted to put it out here. If you want more analysis on this I have put out a comprehensive video on my tictik and youtube page.
Remember, this is not financial advice.
Kind regards,
Demetrios

BTCUSDT:Elliot Waves Analysis DailyHello friends, after the Bitcoin price rose to 124,000 and fell to 117,000 as the fourth wave, matching the 38.2% Fibonacci retracement level and pulling back to the broken area, I expect growth to 129,500 to 130,000.

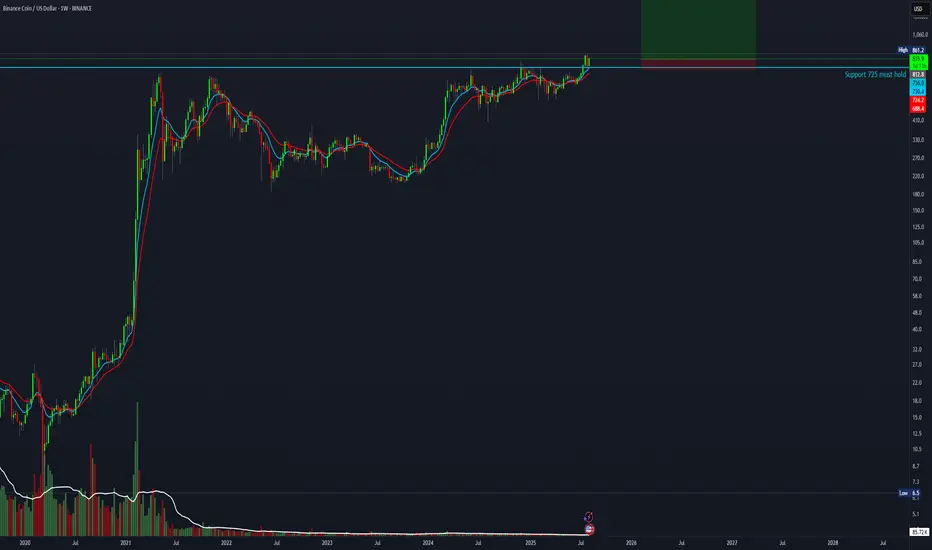
25R setup for BNBEveryone is talking about ETH right now, but don’t forget about this monster — BNB. BNB is about to break out after a successful retest of macro support. Where’s the end after the $850 breakout? Do you really want to bet against CZ? Stop-loss below support at $725.
Good luck — not financial advice.
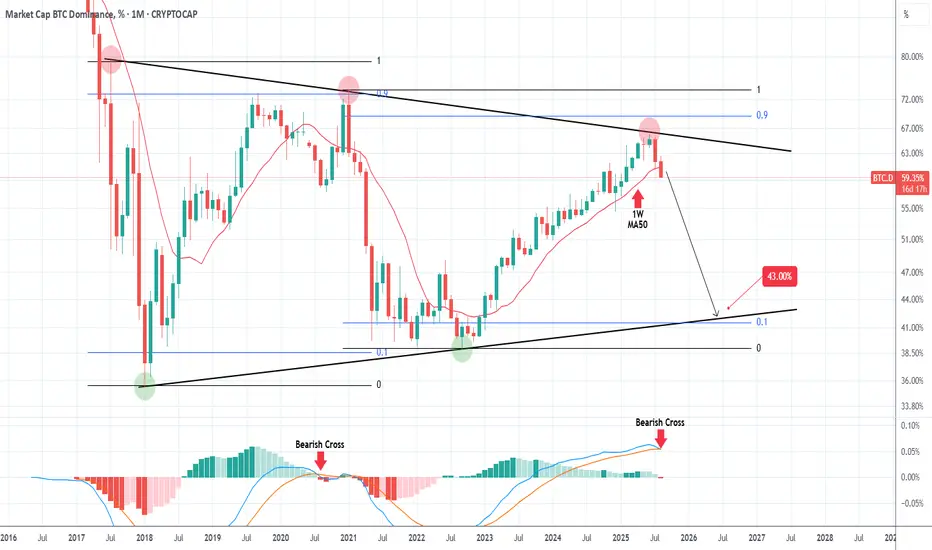
ALTSEASON has already started!The BTC Market Cap Dominance (BTC.D) has made an emphatic rejection at the top (Lower Highs trend-line) of the 8-year Triangle and if it closes the 1M candle of August below the 1W MA50 (red trend-line), it will largely confirm the new Bearish Leg.
With the 1M LMACD about to complete its first Bearish Cross in more than 4 years, it is more probable to see this strong and lengthy downtrend target the bottom (Higher Lows trend-line) of the Triangle near the 0.1 Fibonacci level, similar to the previous one.
The Target is 43.00%.
-------------------------------------------------------------------------------
** Please LIKE 👍, FOLLOW ✅, SHARE 🙌 and COMMENT ✍ if you enjoy this idea! Also share your ideas and charts in the comments section below! This is best way to keep it relevant, support us, keep the content here free and allow the idea to reach as many people as possible. **
-------------------------------------------------------------------------------
💸💸💸💸💸💸
👇 👇 👇 👇 👇 👇