Bullish rise?Bitcoin (BTC/USD) is reacting off the pivot and could bounce to the pullback resistance.
Pivot: 109,846.88
1st Support: 104,701.40
1st Resistance: 115,813.42
Disclaimer:
The above opinions given constitute general market commentary, and do not constitute the opinion or advice of IC Markets or any form of personal or investment advice.
Any opinions, news, research, analyses, prices, other information, or links to third-party sites contained on this website are provided on an "as-is" basis, are intended only to be informative, is not an advice nor a recommendation, nor research, or a record of our trading prices, or an offer of, or solicitation for a transaction in any financial instrument and thus should not be treated as such. The information provided does not involve any specific investment objectives, financial situation and needs of any specific person who may receive it. Please be aware, that past performance is not a reliable indicator of future performance and/or results. Past Performance or Forward-looking scenarios based upon the reasonable beliefs of the third-party provider are not a guarantee of future performance. Actual results may differ materially from those anticipated in forward-looking or past performance statements. IC Markets makes no representation or warranty and assumes no liability as to the accuracy or completeness of the information provided, nor any loss arising from any investment based on a recommendation, forecast or any information supplied by any third-party.
Cryptocurrencysignals

Could we see a bullish reversal?Ethereum (ETH/USD) has bounced off the pivot and could rise to the 1st resistance.
Pivot: 3,938.14
1st Support: 3,694.19
1sst Resistance: 4,279.64
Disclaimer:
The above opinions given constitute general market commentary, and do not constitute the opinion or advice of IC Markets or any form of personal or investment advice.
Any opinions, news, research, analyses, prices, other information, or links to third-party sites contained on this website are provided on an "as-is" basis, are intended only to be informative, is not an advice nor a recommendation, nor research, or a record of our trading prices, or an offer of, or solicitation for a transaction in any financial instrument and thus should not be treated as such. The information provided does not involve any specific investment objectives, financial situation and needs of any specific person who may receive it. Please be aware, that past performance is not a reliable indicator of future performance and/or results. Past Performance or Forward-looking scenarios based upon the reasonable beliefs of the third-party provider are not a guarantee of future performance. Actual results may differ materially from those anticipated in forward-looking or past performance statements. IC Markets makes no representation or warranty and assumes no liability as to the accuracy or completeness of the information provided, nor any loss arising from any investment based on a recommendation, forecast or any information supplied by any third-party.

Aster – From Master to DisasterAster’s chart doesn’t look promising right now — quite the opposite, it’s starting to form a bearish setup that could push the price lower.
I’m expecting a move down toward the $1.05 area from the current levels.
Scenario gets invalidated once the price reaches $1.165

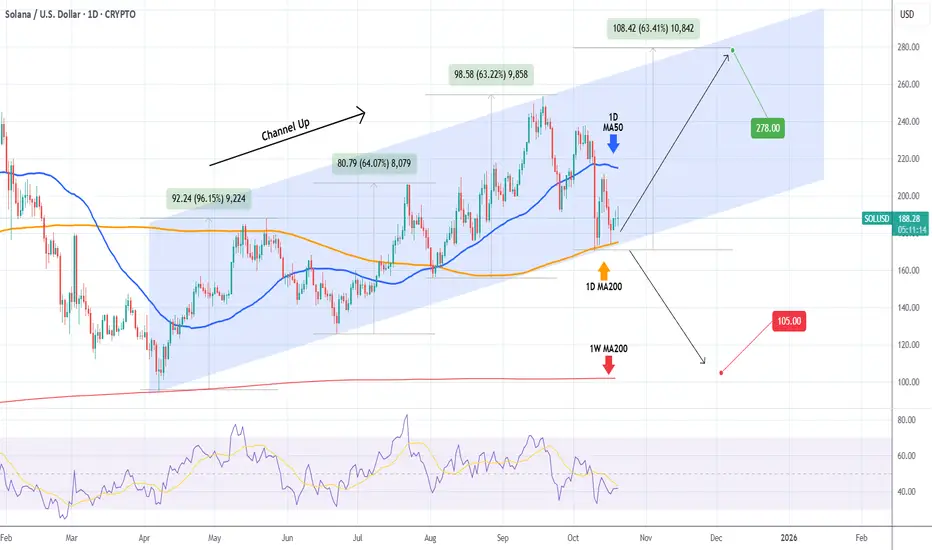
SOLANA 1D MA200 is the only level holding it from falling apart.Solana (SOLUSD) has been trading within a very structured Channel Up pattern since the April 07 bottom, which was priced exactly on its 1W MA200 (red trend-line). The recent pull-back though (Bearish Leg) has got the market testing another key Support level, the 1D MA200 (orange trend-line).
So far this has held on 4 successive tests, technically pricing a new Higher Low on the bottom of the Channel Up. This is what separates the start of the new Bullish Leg towards at least $278.00 (representing a +63.00% rise, the minimum rally so far inside this pattern) from a complete collapse to $105.00 and the 1W MA200. SOL needs to keep closing its 1D candles above the 1D MA200 to maintain the bullish trend.
-------------------------------------------------------------------------------
** Please LIKE 👍, FOLLOW ✅, SHARE 🙌 and COMMENT ✍ if you enjoy this idea! Also share your ideas and charts in the comments section below! This is best way to keep it relevant, support us, keep the content here free and allow the idea to reach as many people as possible. **
-------------------------------------------------------------------------------
💸💸💸💸💸💸
👇 👇 👇 👇 👇 👇
BITCOIN Did the 1W MA50 save the Cycle again??Bitcoin (BTCUSD) has now completed two straight weeks since the Friday 10 flash-crash of almost touching the 1W MA50 (blue trend-line) but managing to hold it and rebound. This is not the first time we see this pattern during this Cycle. In fact it is a frequent one that systemically fuels the 3-year Channel Up of this Bull Cycle.
As you can see, ever since the November 21 2022 bottom of the previous Bear Cycle, the current Bull Cycle has been trading within this Channel Up pattern, which after it broke above the 1W MA50 and in March 2023, turned it into its long-term Support.
More specifically, since that day, every time BTC broke and closed a weekly candle below its 1W MA20 (red trend-line), it dropped further to its 1W MA50 to find Support, priced the Channel Up Higher Low and rebounded.
This has happened so far 3 times (excluding now), in September 2023 it almost touched the 1W MA50 and rebounded but in August 05 2024 and April 07 2025, it marginally breached it and then rebounded. Based on this, BTC is currently at or very close to the new Higher Low (Support), hence a buy opportunity.
The only condition that hasn't been fulfilled, is the 1W RSI entering its 2-year Support Zone. If the 1W MA50 indeed holds and manages to keep closing the 1W candles above it, that would be an indication that the Bull Cycle is still in effect. The minimum rally a pull-back has given throughout the Cycle has been +92.44%, so as long as it holds, there are strong probabilities that BTC may reach a least $143000.
Do you share that model's optimism or you think the new Bear Cycle has already started? Feel free to let us know in the comments section below!
-------------------------------------------------------------------------------
** Please LIKE 👍, FOLLOW ✅, SHARE 🙌 and COMMENT ✍ if you enjoy this idea! Also share your ideas and charts in the comments section below! This is best way to keep it relevant, support us, keep the content here free and allow the idea to reach as many people as possible. **
-------------------------------------------------------------------------------
💸💸💸💸💸💸
👇 👇 👇 👇 👇 👇

XRPUSD Bearish Cross pushing it down to $1.9350 t least.XRP (XRPUSD) has been trading within a Channel Up for almost 1 year (since November 26 2024) and just before last Friday's flash crash, it formed a 1D MA50/100 Bearish Cross. This came after the pattern has already started its 2nd Bearish Leg (red Channel).
The last 1D MA50/100 Bearish Cross was formed post half-way through the previous Bearish Leg and resulted into a bottom just below the 0.786 Fibonacci retracement level. Since there are no news in the market that can drastically alter the bearish sentiment following the renewed U.S. - China trade tensions, we have no reason to expect that the current Bearish Leg won't reach again the bottom of the Channel Up at least.
Our Target is therefore 1.9350 (marginally below the 0.786 Fib). If the Bearish Leg repeats the % drop of the previous one (-52.42%), it can even break to 1.7500 (still within the Channel Up on a logarithmic scale). A break above the 1D MA100 (green trend-line) would invalidate this bearish structure.
-------------------------------------------------------------------------------
** Please LIKE 👍, FOLLOW ✅, SHARE 🙌 and COMMENT ✍ if you enjoy this idea! Also share your ideas and charts in the comments section below! This is best way to keep it relevant, support us, keep the content here free and allow the idea to reach as many people as possible. **
-------------------------------------------------------------------------------
💸💸💸💸💸💸
👇 👇 👇 👇 👇 👇

Bearish momentum to extend?Bitcoin (BTC/USD) is rising towards the pivot and could reverse to the 1st support.
Pivot: 109,846.88
1st Support: 105,491.44
1st Resistance: 113,040.57
Disclaimer:
The above opinions given constitute general market commentary, and do not constitute the opinion or advice of IC Markets or any form of personal or investment advice.
Any opinions, news, research, analyses, prices, other information, or links to third-party sites contained on this website are provided on an "as-is" basis, are intended only to be informative, is not an advice nor a recommendation, nor research, or a record of our trading prices, or an offer of, or solicitation for a transaction in any financial instrument and thus should not be treated as such. The information provided does not involve any specific investment objectives, financial situation and needs of any specific person who may receive it. Please be aware, that past performance is not a reliable indicator of future performance and/or results. Past Performance or Forward-looking scenarios based upon the reasonable beliefs of the third-party provider are not a guarantee of future performance. Actual results may differ materially from those anticipated in forward-looking or past performance statements. IC Markets makes no representation or warranty and assumes no liability as to the accuracy or completeness of the information provided, nor any loss arising from any investment based on a recommendation, forecast or any information supplied by any third-party.

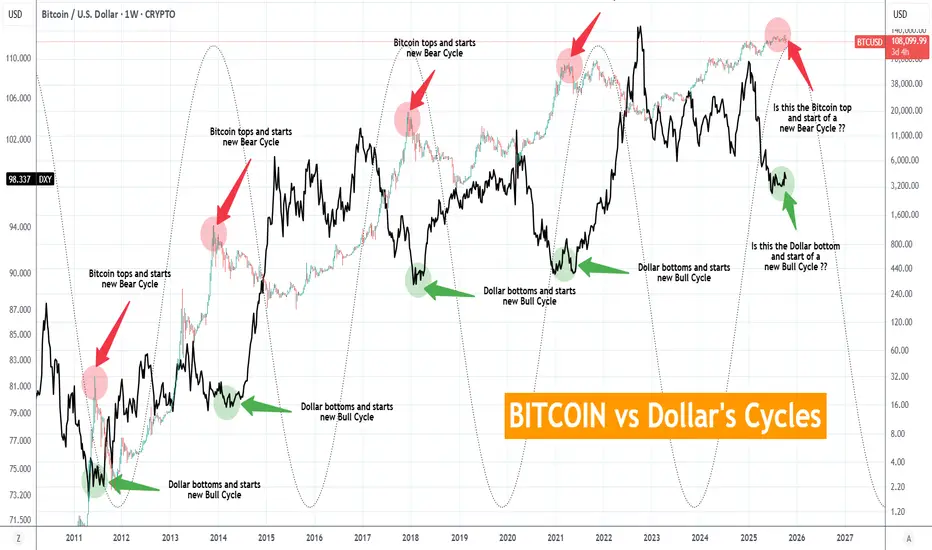
BITCOIN vs Dollar's Cycles. Has the new BTC Bear Cycle started?This is as simple as it can get. And obviously, it is not the first time we give you this chart. This is a cross-asset comparison between Bitcoin (BTCUSD) and the U.S. Dollar Index (DXY) illustrated by the black trend-line. It represents the Cycles of the two assets, typically negatively correlated across the span of 15 years.
As you can see, when the USD bottoms and starts a new Bull Cycle, BTC tops and starts a new Bear Cycle. Similarly vice versa with USD's Bull Cycle tops against BTC's Bear Cycle bottoms.
So the million dollar question is whether the USD has bottomed again. Based on the 4-year Cycle Model and as the Sine Waves illustrate on this chart, it may have. It is no surprise that while the DXY has formed Higher Lows since July 07, BTC has topped and turned sideways on ranged trading with a new Low made on last Friday's crash.
It is not necessary for the USD to break upwards aggressively in order for BTC to start dropping aggressively into its new Bear Cycle. As Jan - March 2018, Jan - March 2013 and May - August 2011 have shown, the USD may range sideways, as long as it is a clear sign of bottom formation, while Bitcoin is already into its Bear Cycle.
So the conclusion is that as long as the USD keeps trading sideways without making a new Low, it is quite like for Bitcoin to be entering its new Bear Cycle. Sound planning, calculated profit taking and gradual (to say the least) de-risking may be required.
So do you think Bitcoin's new Bear Cycle has started? Feel free to let us know in the comments section below!
-------------------------------------------------------------------------------
** Please LIKE 👍, FOLLOW ✅, SHARE 🙌 and COMMENT ✍ if you enjoy this idea! Also share your ideas and charts in the comments section below! This is best way to keep it relevant, support us, keep the content here free and allow the idea to reach as many people as possible. **
-------------------------------------------------------------------------------
💸💸💸💸💸💸
👇 👇 👇 👇 👇 👇
ETHEREUM Only the 1D MA50 can save the day.Ethereum (ETHUSD) marginally broke its 1W MA20 (red trend-line) on last Friday's flash crash and rebounded. The bullish continuation wasn't enough however to break above its 1D MA50 (blue trend-line) and so far it's been rejected.
This is the exact same reaction it had the last time it hit its 1W MA20 (June 22), technically the previous Higher Low of the Fibonacci Channel Up. Both crashes have been around -27%. It took the market some days of consolidation below the 1D MA50 but when it finally broke it, the new Bullish Leg was confirmed.
With a 1D RSI Bullish Divergence already under ETH's belt (Higher Lows against the price's Lower Lows), the market looks like it has bottomed but this can only be validated by a 1D MA50 break-out. The next Bullish Leg can lead ETH to a least $7150 (+108.31% rise similar to the first Bullish Leg).
A break and candle closing below the 1W MA20 however, opens the way to further decline towards the 1W MA100 (green trend-line, the natural long-term Support of the Bull Cycle) around $3050.
-------------------------------------------------------------------------------
** Please LIKE 👍, FOLLOW ✅, SHARE 🙌 and COMMENT ✍ if you enjoy this idea! Also share your ideas and charts in the comments section below! This is best way to keep it relevant, support us, keep the content here free and allow the idea to reach as many people as possible. **
-------------------------------------------------------------------------------
💸💸💸💸💸💸
👇 👇 👇 👇 👇 👇

BTCUSD H4 | Bearish Reversal UnfoldingBitcoin (BTC/USD) has reacted off the sell entry, which is a pullback resistance, and could drop from this level to the downside.
Sell entry is at 113,026.28, which is a oullback resistance.
Stop loss is at 117,878.92, whichis a pullback resistance.
Take profit is at 106,045.28, which is a pullback support.
High Risk Investment Warning
Trading Forex/CFDs on margin carries a high level of risk and may not be suitable for all investors. Leverage can work against you.
Stratos Markets Limited (tradu.com ):
CFDs are complex instruments and come with a high risk of losing money rapidly due to leverage. 65% of retail investor accounts lose money when trading CFDs with this provider. You should consider whether you understand how CFDs work and whether you can afford to take the high risk of losing your money.
Stratos Europe Ltd (tradu.com ):
CFDs are complex instruments and come with a high risk of losing money rapidly due to leverage. 66% of retail investor accounts lose money when trading CFDs with this provider. You should consider whether you understand how CFDs work and whether you can afford to take the high risk of losing your money.
Stratos Global LLC (tradu.com ):
Losses can exceed deposits.
Please be advised that the information presented on TradingView is provided to Tradu (‘Company’, ‘we’) by a third-party provider (‘TFA Global Pte Ltd’). Please be reminded that you are solely responsible for the trading decisions on your account. There is a very high degree of risk involved in trading. Any information and/or content is intended entirely for research, educational and informational purposes only and does not constitute investment or consultation advice or investment strategy. The information is not tailored to the investment needs of any specific person and therefore does not involve a consideration of any of the investment objectives, financial situation or needs of any viewer that may receive it. Kindly also note that past performance is not a reliable indicator of future results. Actual results may differ materially from those anticipated in forward-looking or past performance statements. We assume no liability as to the accuracy or completeness of any of the information and/or content provided herein and the Company cannot be held responsible for any omission, mistake nor for any loss or damage including without limitation to any loss of profit which may arise from reliance on any information supplied by TFA Global Pte Ltd.
The speaker(s) is neither an employee, agent nor representative of Tradu and is therefore acting independently. The opinions given are their own, constitute general market commentary, and do not constitute the opinion or advice of Tradu or any form of personal or investment advice. Tradu neither endorses nor guarantees offerings of third-party speakers, nor is Tradu responsible for the content, veracity or opinions of third-party speakers, presenters or participants.

ETHUSD H4 | Bullish Reversal FormationEthereum (RTH/USD) is falling towards the buy entry, which is a pullback support that aligns with the 61.8% Fibonacci projection and the 127.2% Fibonacci extension, and could bounce from this level to the take profit.
Buy entry is at 3,712.02, which is a pullback support that aligns with the 61.8% Fibonacci projection and the 127.2% Fibonacci extension.
Stop loss is at 3,514.48, whichis a pullback support.
Take profit is at 4,2756.43, which is a pullback resistance.
High Risk Investment Warning
Trading Forex/CFDs on margin carries a high level of risk and may not be suitable for all investors. Leverage can work against you.
Stratos Markets Limited (tradu.com ):
CFDs are complex instruments and come with a high risk of losing money rapidly due to leverage. 65% of retail investor accounts lose money when trading CFDs with this provider. You should consider whether you understand how CFDs work and whether you can afford to take the high risk of losing your money.
Stratos Europe Ltd (tradu.com ):
CFDs are complex instruments and come with a high risk of losing money rapidly due to leverage. 66% of retail investor accounts lose money when trading CFDs with this provider. You should consider whether you understand how CFDs work and whether you can afford to take the high risk of losing your money.
Stratos Global LLC (tradu.com ):
Losses can exceed deposits.
Please be advised that the information presented on TradingView is provided to Tradu (‘Company’, ‘we’) by a third-party provider (‘TFA Global Pte Ltd’). Please be reminded that you are solely responsible for the trading decisions on your account. There is a very high degree of risk involved in trading. Any information and/or content is intended entirely for research, educational and informational purposes only and does not constitute investment or consultation advice or investment strategy. The information is not tailored to the investment needs of any specific person and therefore does not involve a consideration of any of the investment objectives, financial situation or needs of any viewer that may receive it. Kindly also note that past performance is not a reliable indicator of future results. Actual results may differ materially from those anticipated in forward-looking or past performance statements. We assume no liability as to the accuracy or completeness of any of the information and/or content provided herein and the Company cannot be held responsible for any omission, mistake nor for any loss or damage including without limitation to any loss of profit which may arise from reliance on any information supplied by TFA Global Pte Ltd.
The speaker(s) is neither an employee, agent nor representative of Tradu and is therefore acting independently. The opinions given are their own, constitute general market commentary, and do not constitute the opinion or advice of Tradu or any form of personal or investment advice. Tradu neither endorses nor guarantees offerings of third-party speakers, nor is Tradu responsible for the content, veracity or opinions of third-party speakers, presenters or participants.

BCHUSD H4 | Bearish Reversal in PlayBCH/USD has rejected off the sell level, which is an overhead resistance could drop this level to the downside.
Sel entry is at 534.31
Stop loss is at 567.75, which is a pullback resistance that aligns with the 61.8% Fibonacci retracement.
Take profit is at 490.25, which is a pullback support that aligns with the 61.8% Fibonacci projection.
High Risk Investment Warning
Trading Forex/CFDs on margin carries a high level of risk and may not be suitable for all investors. Leverage can work against you.
Stratos Markets Limited (tradu.com ):
CFDs are complex instruments and come with a high risk of losing money rapidly due to leverage. 65% of retail investor accounts lose money when trading CFDs with this provider. You should consider whether you understand how CFDs work and whether you can afford to take the high risk of losing your money.
Stratos Europe Ltd (tradu.com ):
CFDs are complex instruments and come with a high risk of losing money rapidly due to leverage. 66% of retail investor accounts lose money when trading CFDs with this provider. You should consider whether you understand how CFDs work and whether you can afford to take the high risk of losing your money.
Stratos Global LLC (tradu.com ):
Losses can exceed deposits.
Please be advised that the information presented on TradingView is provided to Tradu (‘Company’, ‘we’) by a third-party provider (‘TFA Global Pte Ltd’). Please be reminded that you are solely responsible for the trading decisions on your account. There is a very high degree of risk involved in trading. Any information and/or content is intended entirely for research, educational and informational purposes only and does not constitute investment or consultation advice or investment strategy. The information is not tailored to the investment needs of any specific person and therefore does not involve a consideration of any of the investment objectives, financial situation or needs of any viewer that may receive it. Kindly also note that past performance is not a reliable indicator of future results. Actual results may differ materially from those anticipated in forward-looking or past performance statements. We assume no liability as to the accuracy or completeness of any of the information and/or content provided herein and the Company cannot be held responsible for any omission, mistake nor for any loss or damage including without limitation to any loss of profit which may arise from reliance on any information supplied by TFA Global Pte Ltd.
The speaker(s) is neither an employee, agent nor representative of Tradu and is therefore acting independently. The opinions given are their own, constitute general market commentary, and do not constitute the opinion or advice of Tradu or any form of personal or investment advice. Tradu neither endorses nor guarantees offerings of third-party speakers, nor is Tradu responsible for the content, veracity or opinions of third-party speakers, presenters or participants.

$ZEREBRO Performing a bullish pennant A bullish pennant is a chart pattern in technical analysis that signals a continuation of an uptrend. It is formed when a sharp, strong upward price movement (the "flagpole") is followed by a short period of consolidation, creating a small symmetrical triangle (the "pennant"). A breakout above the pennant's upper trendline indicates that the uptrend will likely continue.

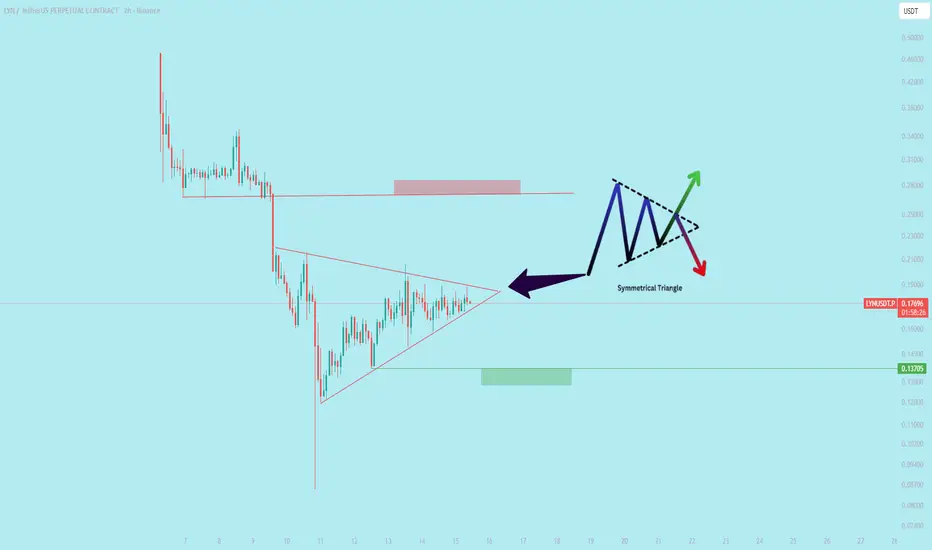
$LYN Performing a symmetrical triangle**$LYN** **Performing a symmetrical triangle** `symmetrical triangle is a chart pattern formed by two converging trendlines that connect a series of lower highs and higher lows. It represents a period of market consolidation and indecision, with neither buyers nor sellers having a clear advantage. The price range narrows as it moves toward the triangle's apex, or point of convergence.`
DOTUSD Can this Channel save it from complete obsolescence?Polkadot (DOTUSD) has been trading within a Channel Down since the December 26 2022 Low and it only broke momentarily during last Friday's flash crash. Having recovered instantly above it and closing the 1W candle inside the pattern, it technically counts as a Lower Low.
The last two Lower Lows (both inside 2025), delivered rebound that hit tested the 1W MA50 (blue trend-line). As a result, the obvious technical Target on the medium-term is the 1W MA50 and our (a but more conservative) estimation is $4.600, which is right on the 0.382 Fibonacci Channel level. Of course that's assuming the market doesn't close any 1W candles below the Channel Down. The current price levels offer an excellent Risk/ Reward ratio on this.
If the 1W MA50 breaks, we can see an even more aggressive extension towards the top (Lower Highs trend-line) of the Channel Down. The best indicator for a Sell Signal in that scenario is the 1W RSI Resistance Zone. It has priced the last three major Highs since 2023. Naturally the 1W MA200 (orange trend-line) is the obvious long-term Resistance and potential Target in that scenario but can go even as high as 9.5000 if we repeat the previous +225.10% Bullish Leg.
-------------------------------------------------------------------------------
** Please LIKE 👍, FOLLOW ✅, SHARE 🙌 and COMMENT ✍ if you enjoy this idea! Also share your ideas and charts in the comments section below! This is best way to keep it relevant, support us, keep the content here free and allow the idea to reach as many people as possible. **
-------------------------------------------------------------------------------
💸💸💸💸💸💸
👇 👇 👇 👇 👇 👇

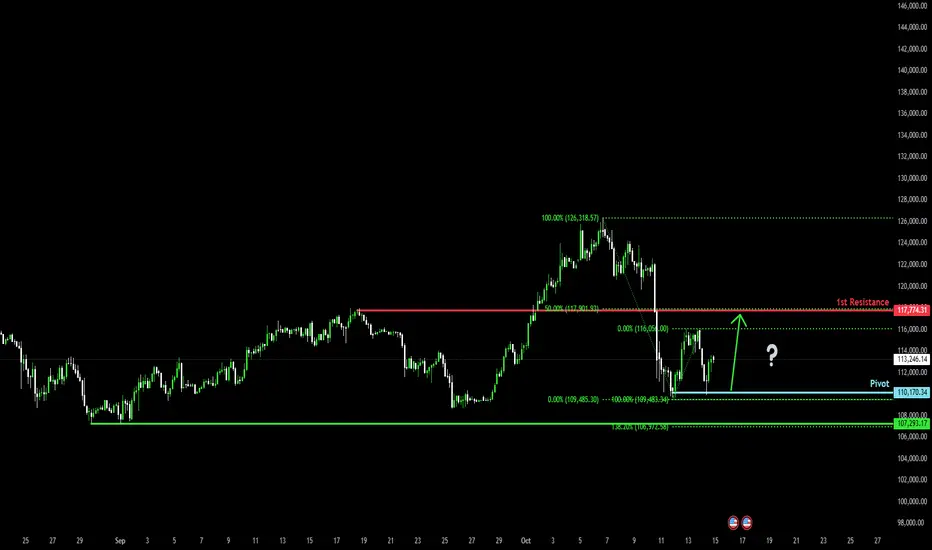
Bullish reversal for Bitcoin?The price has bounced off the pivot, which is a pullback support, and could rise to the 50% Fibonacci resistance.
Pivot: 110,170.34
1st Support: 107,293.17
1st Resistance: 117,774.31
Disclaimer:
The above opinions given constitute general market commentary, and do not constitute the opinion or advice of IC Markets or any form of personal or investment advice.
Any opinions, news, research, analyses, prices, other information, or links to third-party sites contained on this website are provided on an "as-is" basis, are intended only to be informative, is not an advice nor a recommendation, nor research, or a record of our trading prices, or an offer of, or solicitation for a transaction in any financial instrument and thus should not be treated as such. The information provided does not involve any specific investment objectives, financial situation and needs of any specific person who may receive it. Please be aware, that past performance is not a reliable indicator of future performance and/or results. Past Performance or Forward-looking scenarios based upon the reasonable beliefs of the third-party provider are not a guarantee of future performance. Actual results may differ materially from those anticipated in forward-looking or past performance statements. IC Markets makes no representation or warranty and assumes no liability as to the accuracy or completeness of the information provided, nor any loss arising from any investment based on a recommendation, forecast or any information supplied by any third-party.
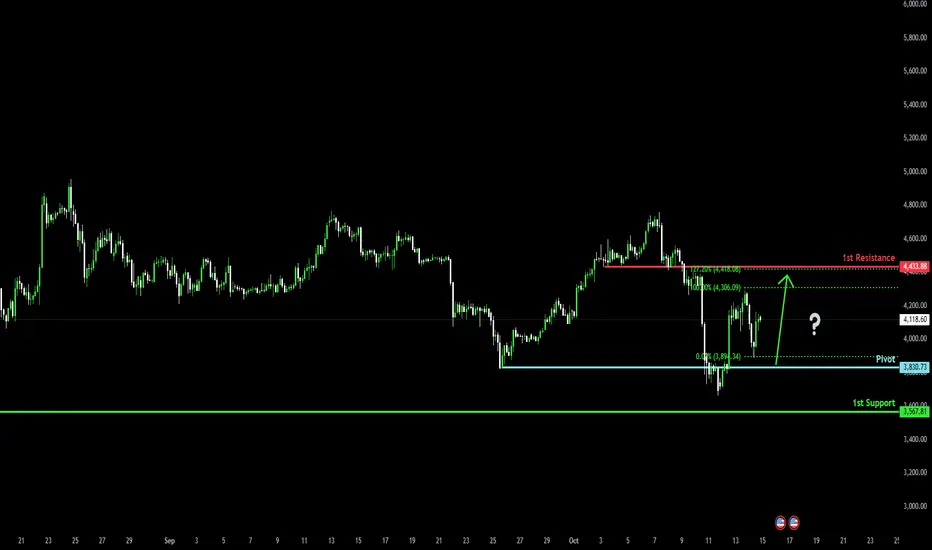
Bullish reversal setup?The Ethereum (ETH/USD) is falling towards the pivot and could bounce to the 1st resistance that aligns with hte 127.2% Fibonacci extension.
Pivot: 3,830.73
1st Support: 3,567.83
1st Resistance: 4,433.88
Disclaimer:
The above opinions given constitute general market commentary, and do not constitute the opinion or advice of IC Markets or any form of personal or investment advice.
Any opinions, news, research, analyses, prices, other information, or links to third-party sites contained on this website are provided on an "as-is" basis, are intended only to be informative, is not an advice nor a recommendation, nor research, or a record of our trading prices, or an offer of, or solicitation for a transaction in any financial instrument and thus should not be treated as such. The information provided does not involve any specific investment objectives, financial situation and needs of any specific person who may receive it. Please be aware, that past performance is not a reliable indicator of future performance and/or results. Past Performance or Forward-looking scenarios based upon the reasonable beliefs of the third-party provider are not a guarantee of future performance. Actual results may differ materially from those anticipated in forward-looking or past performance statements. IC Markets makes no representation or warranty and assumes no liability as to the accuracy or completeness of the information provided, nor any loss arising from any investment based on a recommendation, forecast or any information supplied by any third-party.
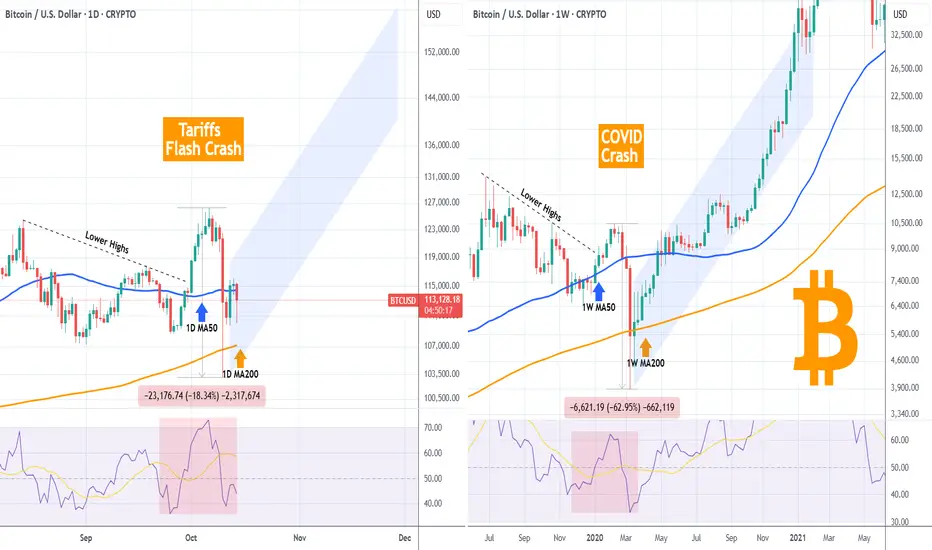
BITCOIN Is last Friday's flash crash similar to COVID's?Bitcoin (BTCUSD) made a strong flash crash last Friday following President Trump's tariff threats to China. That brought back memories of the March 2020 COVID crash. But are those that similar??
Quick answer: strength/ aggression wise no. Last Friday's crash marked 'just' a -18.34% decline from its top on a week basis. COVID's crash, which was longer admittedly, pulled the price down by -62.95% from February's 2020 High. Massive difference in market psychology and dynamics (even though we may have not seen the last of the current Tariff Crash). And that is the reason one chart is on the 1D time-frame and the other on the 1W time-frame.
However this is the exact reason that they look so similar in technical structure. As you can see both started on a Lower Highs downtrend, which broke to the upside that led to the eventual crash that broke below both the MA50 and MA200 (blue and orange trend-lines respectively). Even their RSI structures are similar.
The COVID crash taught us that as long as the MA200 closed the candles above it, a massive rally was sustained to new Highs. If the same structure is followed on the current fractal, we may see BTC rising by as high as $150k.
So what do you think? Do those two crashes share similarities that can justify a market recovery now? Feel free to let us know in the comments section below!
-------------------------------------------------------------------------------
** Please LIKE 👍, FOLLOW ✅, SHARE 🙌 and COMMENT ✍ if you enjoy this idea! Also share your ideas and charts in the comments section below! This is best way to keep it relevant, support us, keep the content here free and allow the idea to reach as many people as possible. **
-------------------------------------------------------------------------------
💸💸💸💸💸💸
👇 👇 👇 👇 👇 👇
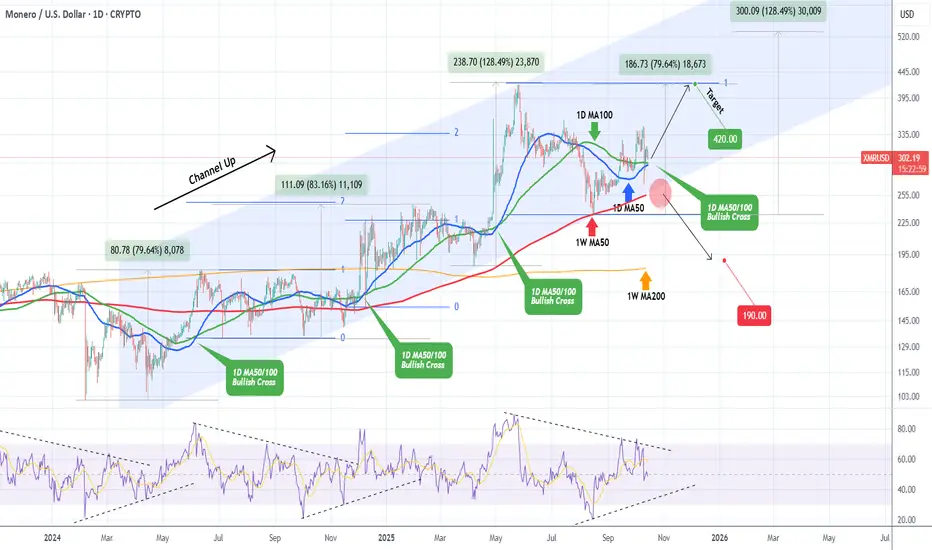
XMRUSD Can this Channel Up hold and push it higher?Monero (XMRUSD) has been trading within a Channel Up since the February 06 2024 Low and last Friday's flash crash almost tested its bottom (Higher Lows trend-line).
The last time this got hit was on the August 16 2025 Low, which also touched the 1W MA50 (red trend-line), the market's natural Support since November 27 2024. As long as this level holds, the Channel Up will remain intact and should technically push for a new Higher High.
Ahead of a 1D MA50/100 Bullish Cross formation (possibly even today), we can assume that XMR will go for at least a +79.64% rally from the recent Low, which has been the 'weakest' Bullish Leg within this pattern.
That gives us a $420 Target that would match the May 26 2025 High. Technically the Bullish Leg can also complete a +128.49% rise (strongest Bullish Leg of the pattern), even go as high as the 2.0 Fibonacci extension, again as long as the 1W MA50 holds.
If it fails to support though, be ready for a potential 1W MA200 (orange trend-line) test around $190.00.
-------------------------------------------------------------------------------
** Please LIKE 👍, FOLLOW ✅, SHARE 🙌 and COMMENT ✍ if you enjoy this idea! Also share your ideas and charts in the comments section below! This is best way to keep it relevant, support us, keep the content here free and allow the idea to reach as many people as possible. **
-------------------------------------------------------------------------------
💸💸💸💸💸💸
👇 👇 👇 👇 👇 👇
BTCUSD H4 | Bearish Momentum To ExtendBitcoin (BTC/USD) is rising towards the sell entry at 117,225.08, which is a pullback resistance that is slightly above the 23.6% Fibonacci retracement.
Stop loss is at 121,603.58, which is a pullback resistance that lines up with the 61.8% Fibonacci retracement.
Take profit is at 109,369.55, which is a multi swing low support.
High Risk Investment Warning
Trading Forex/CFDs on margin carries a high level of risk and may not be suitable for all investors. Leverage can work against you.
Stratos Markets Limited (tradu.com ):
CFDs are complex instruments and come with a high risk of losing money rapidly due to leverage. 65% of retail investor accounts lose money when trading CFDs with this provider. You should consider whether you understand how CFDs work and whether you can afford to take the high risk of losing your money.
Stratos Europe Ltd (tradu.com ):
CFDs are complex instruments and come with a high risk of losing money rapidly due to leverage. 66% of retail investor accounts lose money when trading CFDs with this provider. You should consider whether you understand how CFDs work and whether you can afford to take the high risk of losing your money.
Stratos Global LLC (tradu.com ):
Losses can exceed deposits.
Please be advised that the information presented on TradingView is provided to Tradu (‘Company’, ‘we’) by a third-party provider (‘TFA Global Pte Ltd’). Please be reminded that you are solely responsible for the trading decisions on your account. There is a very high degree of risk involved in trading. Any information and/or content is intended entirely for research, educational and informational purposes only and does not constitute investment or consultation advice or investment strategy. The information is not tailored to the investment needs of any specific person and therefore does not involve a consideration of any of the investment objectives, financial situation or needs of any viewer that may receive it. Kindly also note that past performance is not a reliable indicator of future results. Actual results may differ materially from those anticipated in forward-looking or past performance statements. We assume no liability as to the accuracy or completeness of any of the information and/or content provided herein and the Company cannot be held responsible for any omission, mistake nor for any loss or damage including without limitation to any loss of profit which may arise from reliance on any information supplied by TFA Global Pte Ltd.
The speaker(s) is neither an employee, agent nor representative of Tradu and is therefore acting independently. The opinions given are their own, constitute general market commentary, and do not constitute the opinion or advice of Tradu or any form of personal or investment advice. Tradu neither endorses nor guarantees offerings of third-party speakers, nor is Tradu responsible for the content, veracity or opinions of third-party speakers, presenters or participants.

ETHUSD H1 | Bullish BounceETH/USD is falling towards the buy entry at 4,199.93, which is a pullback support that aligns with the 23.6% Fibonacci retracement and could bounce from this level to the upside.
Stop loss is at 4,080.59, which is a pullback support that lines up with the 50% Fibonacci retracement.
Take profit is at 4,412.84, which is an overlap resistance that lines up with the 61.8% Fibonacci retracement.
High Risk Investment Warning
Trading Forex/CFDs on margin carries a high level of risk and may not be suitable for all investors. Leverage can work against you.
Stratos Markets Limited (tradu.com ):
CFDs are complex instruments and come with a high risk of losing money rapidly due to leverage. 65% of retail investor accounts lose money when trading CFDs with this provider. You should consider whether you understand how CFDs work and whether you can afford to take the high risk of losing your money.
Stratos Europe Ltd (tradu.com ):
CFDs are complex instruments and come with a high risk of losing money rapidly due to leverage. 66% of retail investor accounts lose money when trading CFDs with this provider. You should consider whether you understand how CFDs work and whether you can afford to take the high risk of losing your money.
Stratos Global LLC (tradu.com ):
Losses can exceed deposits.
Please be advised that the information presented on TradingView is provided to Tradu (‘Company’, ‘we’) by a third-party provider (‘TFA Global Pte Ltd’). Please be reminded that you are solely responsible for the trading decisions on your account. There is a very high degree of risk involved in trading. Any information and/or content is intended entirely for research, educational and informational purposes only and does not constitute investment or consultation advice or investment strategy. The information is not tailored to the investment needs of any specific person and therefore does not involve a consideration of any of the investment objectives, financial situation or needs of any viewer that may receive it. Kindly also note that past performance is not a reliable indicator of future results. Actual results may differ materially from those anticipated in forward-looking or past performance statements. We assume no liability as to the accuracy or completeness of any of the information and/or content provided herein and the Company cannot be held responsible for any omission, mistake nor for any loss or damage including without limitation to any loss of profit which may arise from reliance on any information supplied by TFA Global Pte Ltd.
The speaker(s) is neither an employee, agent nor representative of Tradu and is therefore acting independently. The opinions given are their own, constitute general market commentary, and do not constitute the opinion or advice of Tradu or any form of personal or investment advice. Tradu neither endorses nor guarantees offerings of third-party speakers, nor is Tradu responsible for the content, veracity or opinions of third-party speakers, presenters or participants.

LTCUSD H4 | Could We See a Bullish Reversal?Litecoin has bounced off the buy entry which is a pullback support and could rise from this level to the upside.
Buy entry is at 97.36, which i a pullback support.
Stop loss is at 90.92, which is an overlap support that aligns with the 127.2% Fibonacci extension.
Take profit is at 111.13, which is a pullback resistance that lines up with the 38.2% Fibonacci retracement.
High Risk Investment Warning
Trading Forex/CFDs on margin carries a high level of risk and may not be suitable for all investors. Leverage can work against you.
Stratos Markets Limited (tradu.com ):
CFDs are complex instruments and come with a high risk of losing money rapidly due to leverage. 65% of retail investor accounts lose money when trading CFDs with this provider. You should consider whether you understand how CFDs work and whether you can afford to take the high risk of losing your money.
Stratos Europe Ltd (tradu.com ):
CFDs are complex instruments and come with a high risk of losing money rapidly due to leverage. 66% of retail investor accounts lose money when trading CFDs with this provider. You should consider whether you understand how CFDs work and whether you can afford to take the high risk of losing your money.
Stratos Global LLC (tradu.com ):
Losses can exceed deposits.
Please be advised that the information presented on TradingView is provided to Tradu (‘Company’, ‘we’) by a third-party provider (‘TFA Global Pte Ltd’). Please be reminded that you are solely responsible for the trading decisions on your account. There is a very high degree of risk involved in trading. Any information and/or content is intended entirely for research, educational and informational purposes only and does not constitute investment or consultation advice or investment strategy. The information is not tailored to the investment needs of any specific person and therefore does not involve a consideration of any of the investment objectives, financial situation or needs of any viewer that may receive it. Kindly also note that past performance is not a reliable indicator of future results. Actual results may differ materially from those anticipated in forward-looking or past performance statements. We assume no liability as to the accuracy or completeness of any of the information and/or content provided herein and the Company cannot be held responsible for any omission, mistake nor for any loss or damage including without limitation to any loss of profit which may arise from reliance on any information supplied by TFA Global Pte Ltd.
The speaker(s) is neither an employee, agent nor representative of Tradu and is therefore acting independently. The opinions given are their own, constitute general market commentary, and do not constitute the opinion or advice of Tradu or any form of personal or investment advice. Tradu neither endorses nor guarantees offerings of third-party speakers, nor is Tradu responsible for the content, veracity or opinions of third-party speakers, presenters or participants.

SOLUSD H4 | Bullish ReversalSOL/USD is reacting off the buy entry which is a pullback support and oculd rise from this level to the upside.
Buy entry is at 204.32, which is a pullback support.
Stop loss is at 187.97, which is an overlap support.
Take profit is at 228.36, which is an overlap resistance that aligns with the 78.6% Fibonacci retracement.
High Risk Investment Warning
Trading Forex/CFDs on margin carries a high level of risk and may not be suitable for all investors. Leverage can work against you.
Stratos Markets Limited (tradu.com ):
CFDs are complex instruments and come with a high risk of losing money rapidly due to leverage. 65% of retail investor accounts lose money when trading CFDs with this provider. You should consider whether you understand how CFDs work and whether you can afford to take the high risk of losing your money.
Stratos Europe Ltd (tradu.com ):
CFDs are complex instruments and come with a high risk of losing money rapidly due to leverage. 66% of retail investor accounts lose money when trading CFDs with this provider. You should consider whether you understand how CFDs work and whether you can afford to take the high risk of losing your money.
Stratos Global LLC (tradu.com ):
Losses can exceed deposits.
Please be advised that the information presented on TradingView is provided to Tradu (‘Company’, ‘we’) by a third-party provider (‘TFA Global Pte Ltd’). Please be reminded that you are solely responsible for the trading decisions on your account. There is a very high degree of risk involved in trading. Any information and/or content is intended entirely for research, educational and informational purposes only and does not constitute investment or consultation advice or investment strategy. The information is not tailored to the investment needs of any specific person and therefore does not involve a consideration of any of the investment objectives, financial situation or needs of any viewer that may receive it. Kindly also note that past performance is not a reliable indicator of future results. Actual results may differ materially from those anticipated in forward-looking or past performance statements. We assume no liability as to the accuracy or completeness of any of the information and/or content provided herein and the Company cannot be held responsible for any omission, mistake nor for any loss or damage including without limitation to any loss of profit which may arise from reliance on any information supplied by TFA Global Pte Ltd.
The speaker(s) is neither an employee, agent nor representative of Tradu and is therefore acting independently. The opinions given are their own, constitute general market commentary, and do not constitute the opinion or advice of Tradu or any form of personal or investment advice. Tradu neither endorses nor guarantees offerings of third-party speakers, nor is Tradu responsible for the content, veracity or opinions of third-party speakers, presenters or participants.
