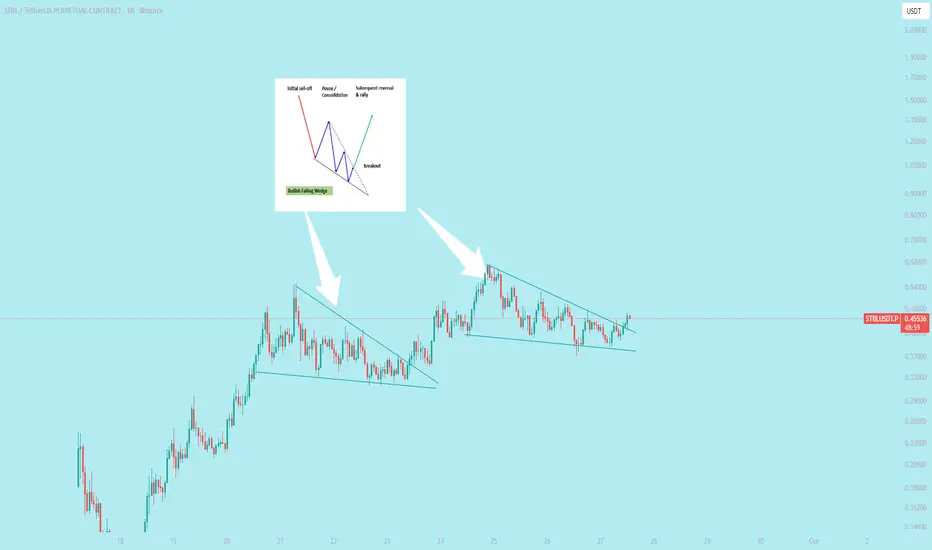
$STBL Breakout falling wedge pattern
`A falling wedge breakout is a bullish signal in technical analysis, occurring when the price of an asset, which has been trending downward in a tightening range, pushes decisively above the upper resistance line of the wedge formation. This indicates that selling pressure is weakening and a potential trend reversal to the upside is underway.`
**How to Trade a Falling Wedge Breakout (Simple)**:
1. **Spot the Pattern**: Find a falling wedge—price forms lower highs and lows, converging into a tighter range.
2. **Wait for Breakout**: Buy when price breaks and closes above the upper trendline with strong volume.
3. **Entry**: Enter long at the breakout or on a retest of the trendline as support.
4. **Stop-Loss**: Set below the lower trendline or recent low.
5. **Target**: Measure the wedge’s height at its widest, add it to the breakout point for the target.
6. **Manage Risk**: Use low leverage (3x-5x), risk 1-2% of your account, and trail stops to lock profits.
@everyone
Cryptocurrrency
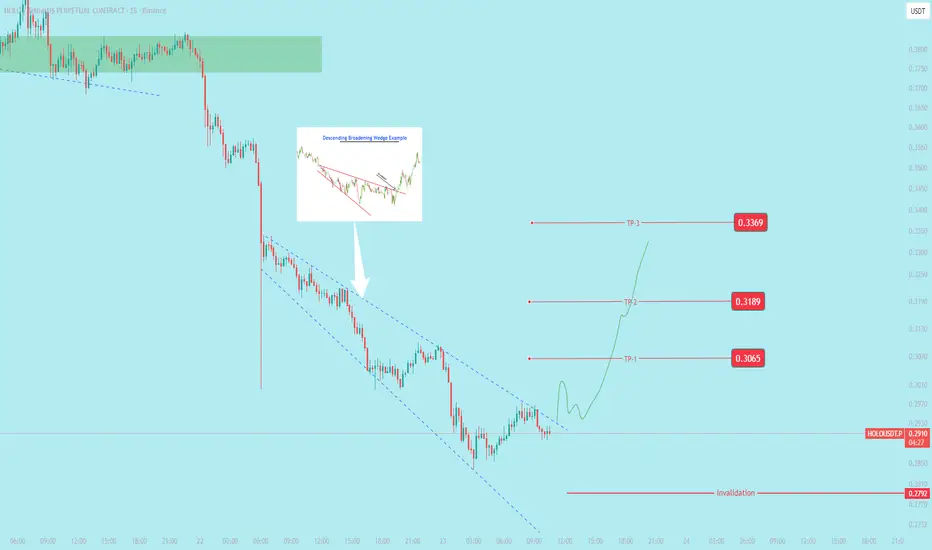
$holoworld forming descending broadening wedge pattern; await bbullish chart pattern that signals a potential reversal of a downtrend. Unlike a normal wedge, where trendlines converge, the trendlines in a broadening wedge diverge, showing increased volatility
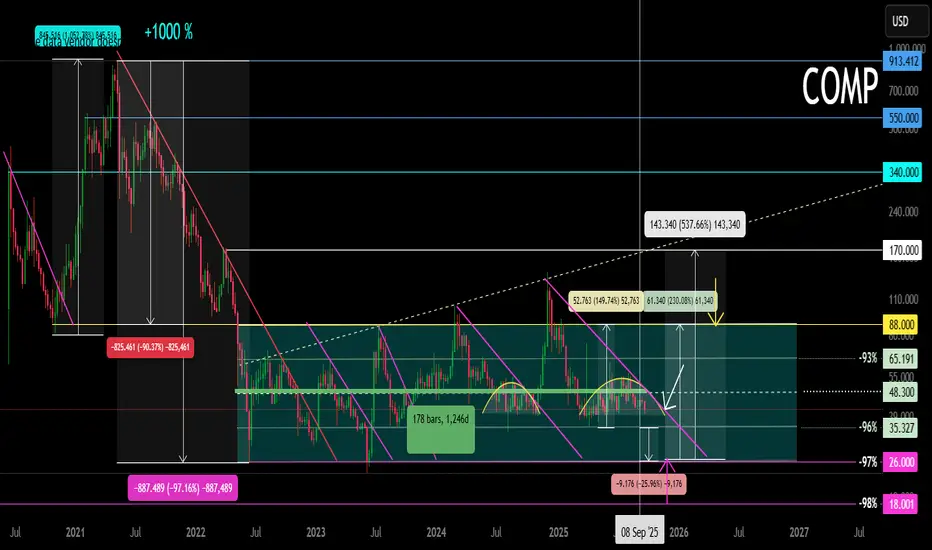
COMP Main trend. 09/24/2025Logarithm. Time frame: 1 week.
Declines from the pump high +1000% to -97%
A horizontal channel has formed, with rising highs (outer boundaries). The inner channel range is -93-96%.
Typical trading in horizontal channels (from zones or on breakouts) and upon exiting them, while adhering to money management.
Buy fear in pieces, sell joy in pieces.
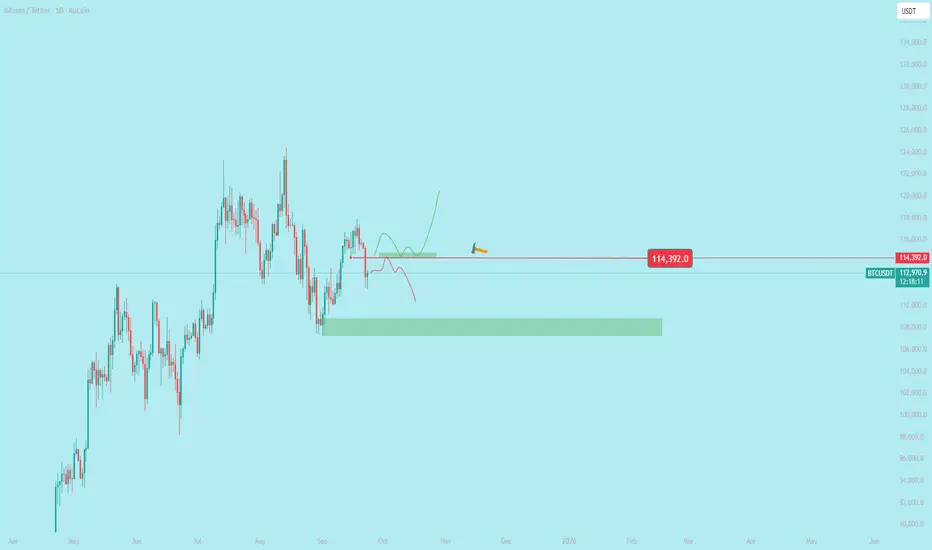
Bitcoin Price Update and Trading Plan
**Current Situation**:
Bitcoin (BTC) is at a critical level, and its weekly closing price is highly important for traders. A strong bounce from the current price, followed by a weekly close above **$114,500**, is needed to confirm bullish momentum. This could lead to a significant upward move, allowing traders to capitalize on the next strong price movement. However, BTC should first retest its key support level, which it previously broke, to confirm its strength. If rejected at this support, a downward move toward **$108,000** is possible.
**Trading Plan**:
1. **Bullish Case**:
- **Condition**: If BTC bounces from its current level and closes above **$114,500** on the weekly chart, it signals strong bullish momentum.
- **Action**: Enter a long position targeting higher levels, such as **$117,200-$120,000**.
- **Stop Loss**: Place below **$114,000** to manage risk.
- **Rationale**: A close above **$114,500** confirms support and sets the stage for the next upward move.
2. **Bearish Case**:
- **Condition**: If BTC fails to hold above **$114,500** and breaks below the key support, it may retest the **$108,000-$110,000** zone, where it previously found support.
- **Action**: Wait for confirmation of a bounce at **$108,000** for a potential long trade, or short if rejection occurs at this level.
- **Stop Loss**: For shorts, place above **$115,000** to limit risk.
- **Target**: A downward move could target **$108,000**, with further declines possible if selling pressure increases.
- **Rationale**: A rejection at **$108,000** after breaking key support indicates bearish pressure, potentially leading to a deeper correction.
**Key Levels to Monitor**:
- **Support**: **$114,500** (immediate), **$108,000-$110,000** (major support zone).
- **Resistance**: **$117,200-$118,000** (immediate), **$120,000+** (next target).
- **Weekly Close**: The weekly close on September 28, 2025, will determine whether BTC confirms bullish strength or signals a deeper pullback.
**Conclusion**:
For a bullish outlook, BTC needs to close above **$114,500** to confirm a bounce and target higher levels. If it fails, traders should prepare for a potential retest of **$108,000**, where a rejection could lead to further downside. Monitor price action closely and use tight risk management due to BTC’s volatility.
*Disclaimer*: Cryptocurrency trading is highly risky. This is not financial advice; always conduct your own research before trading.
Dirty Game (Keep Your Eyes Open)A no-KYC perp, launches token and allows traders (and themselves) 50x leverage directly from launch.
Peddles binary options and their own stablecoin
Let's not assume they abuse level 3 orderbook data (stops/liquidations/entry) to churn endless volume/'clearance fees'
And surely, hopefully, they don't build up unbacked debt in their system (god mode positions, FTX style)
It will likely play out okay, but this is one of those 'could explode' plays.
This one has a heavy duty handler.
Very experienced, very ruthless.
I see it playing out similarly to HYPE, but a lot more shameless.
There is no intention of playing fair.
They are not trying to convince you they are a long-term play like HYPE.
This is not just a harvest on gamblers/leverage traders, it is also a harvest on market makers.
Smart market makers will not touch this, most will play it double safe and lose, some will lose big.
ASTER PLAYBOOK:
Run price up hard and fast using, heavily leveraged seed money, while being immune to liquidations > ENTICE
Paint a cute chart > BUILD CONFIDENCE
Abuse level 3 data and god mode to harvest liquidations > ACCUMULATE STABILITY FUND
(run lows, tap highs, repeat)
Use stability funds to further run up price.
With HYPE;
the game slowed down when their risks got highlighted.
built up vultures who actively try to eat off their plate, limiting upside
has a 3x/10x max, where as this goes 50x
transparency makes it hard to be as shameless, but also attracted more capital that way
How high will it go?
It all depends on how much capital they fool into their game.
My guess, they will run it to some nice number while volatility is high (5$/10$), before slamming it 70-90% down.
Then low volatility churn for a year and try again.
None of this is financial advice.

APE Main trend. Channel. Wedge. Reversal zones 05 05 2025Logarithm. Time frame 1 week.
1️⃣ Decline from the maximum by -98% , which is acceptable for assets of such liquidity and capitalization, after that either a trend reversal (main), or a complete scam.
2️⃣X (twitter) of this crypto project has 473 thousand subscribers . This army will be sent to pump this cryptocurrency at the right time in the so-called 3rd alt season of this cycle.
🟣And now work with a breakout of the descending wedge, and the price movement to the resistance of the descending channel. The percentage locally - medium-term showed for clarity from two zones - scenarios.
3️⃣The third plus is that this cryptocurrency is traded on 4 liquid exchanges: binance, bybit, okx, and most importantly Coinbase.
Line chart (trend direction and liquidity).

W Secondary. Reversed Head and Shoulders Key Area. 18 09 25Logarithm. 3 days.
Main trend 23 03 2025
A breakout of the previously mentioned key resistance (pair to USD) occurs on huge buying volume and an exit from the sideways trend (inverse head and shoulders).
Local targets, in case the inverse head and shoulders pattern is realized and a bowl forms at the next resistance level (previous consolidation).

NYM Main Trend. 09/18/2025Logarithm. 1 week. -97% decline from the liquid zone, and more than -99% on all exchanges.
🔵 Main trend — descending channel (price at resistance, exit potential)
🟡 Secondary trend — sideways consolidation in the channel (upper part — reset zones)
🟣 Local trend — cup with handle (implementation in case of a breakout).
🔈 Previously (for publicity purposes), the project allegedly raised $300 million (verification via online links, for the less-than-savvy). The next step is a simple one. Listing on XXX. With a current decline of -99%, the first "investors" (partially redistributed from the wallets of small, unmonitored investors) have a notional profit of +400%. Consider the profit at the listing. The upper part of the channel and the middle (descending) are the reset waves, and in each local altseason, there's a small rise (creating interest and hope).
Fantik has been trading since 2022 and is listed on the buybit , along with several moderately liquid ones. It's losing liquidity and interest. Twitter's 160,000 is very low (this reflects the creators' reluctance to burn money on advertising and awareness of this "special" cryptocurrency, one of thousands.
⚠️ Later, there will be delistings, which is logical. But, before that, it's entirely possible to make money locally. In my opinion, it's a scam in the long term, even if they temporarily reset the chart and legend, meaning rebranding, swaps, and other tricks to continue selling at any price.
📊 It operates using a pump/dump strategy, with pre-distributed risk and a designated amount, without being tied to a project or ticker. It's all the same. It's one of dozens of "non-special" cryptocurrencies in this strategy. That is, it's important to diversify such assets. I've explained everything in the comments and shown examples and situations dozens of times on other charts.
📊 Spot only and no stops (low liquidity). All targets are relatively "down-to-earth." Price slippage may occur due to low liquidity. This can be exploited or ignored.

BNB: BREAKING OUT AND TESTING WEEKLY RESISTANCEBinance Coin BNB/USDT is exhibiting 2 interesting patterns at the moment on weekly timeframe
1. A Breakout and re-test of the weekly resistance (since ATH in May 21 to ATH in Jun 24).
2. Although not a perfect cup and handle pattern, yet if considered one, it shows a thrilling target @ $1000 (which is achievable in upcoming bull run)
Best of Luck!!

DYDX -98% Secondary trend Holders reset. Inverse H&S 09 15 2025Logarithm 3 days. In the capitulation zone on the super negative, a reversal pattern of an inverted head and shoulders is formed. Its implementation of goals is to enter when the price overcomes the resistance of the pattern.
Main trend. -98%.
DYDX Main trend. 30 08 2024
15 09 2025
Manipulations from the project developers. Most recently in June (trend minimum, negative) - the developments froze (turned to zero) the tokens of about 40,000 DYDX holders. They blocked the token migration bridge from the ETH network to the DYDX network. In other projects, such migration is always open (for example, from the fact that I have EWT (EWTB), because many holders, after purchasing an asset and withdrawing it to a wallet, do not particularly follow the events of the projects. But, with DYDX, this did not work. Balances on wallets, and already a super depreciated token (from the peak of pumping, a natural -98% depreciation in liquidity), literally turned into zero. Probably, it is more offensive not to the hamsters who bought on the listing, news and hype, but to those people who gained from supporting a long-term downward channel.
There are rumors that for 10% of the cost, developers make an exchange of network tokens. If this is true, then from the standpoint of the morality of the developers, this is the moral bottom.

DYDX Main trend 30 08 2024Logarithm. Time frame 1 week. Horizontal channel. Beginning of entry into the capitulation zone (under channel support). Formation of a locally descending wedge, in the final phase of formation (volatility narrowing).
Line chart.
Secondary trend. Wedge.

DYDX Secondary Trend. Capitulation Zone. Wedge. 30 08 2024Logarithm. Time frame 3 days.
Line chart.
Main trend and this secondary trend zone in it.
DYDX Main trend 30 08 2024

APT Main trend. 21 02 2025Logo rhymes. Time frame 3 days. Medium-term work in the horizontal channel range.
Line chart without “market noise”.
Local work in the wedge formation range.

LUMIA Main trend -91% Low/high zones 01/18/2025Logarithm. Time frame 3 days. Fresh cryptocurrency. This main trend of this cryptocurrency itself (the entire history of trades) acts as a secondary trend in meaning.
The legend of the utility-imitation of this cryptocurrency is the tokenization of assets. A very good idea for the future hype of this kind, especially if they will continue to hype the "American" HBAR.
The chart shows the zones (support/resistance horizontal and dynamic) of maximums and minimums for work.
Now, after breaking the logic of the descending wedge (all the price drop), the price went into sideways consolidation. The channel step and local levels are shown. If they draw an inverted head and shoulders with the price in the channel canvas (part is already there), then there will be an exit to % of its base up, just to one of the following designated resistance zones. If the market as a whole is negative, then from this consolidation there may be another wave of decline. The zones are shown in the idea.
The asset itself was dumped after a local listing pump by -91%, these are not the minimum values for assets of such liquidity. But, sometimes if the market as a whole looks bullish, then the trend of the wrapper is reversed, this is an acceptable decline, but not minimal. Consider this in your money management and work tactics.

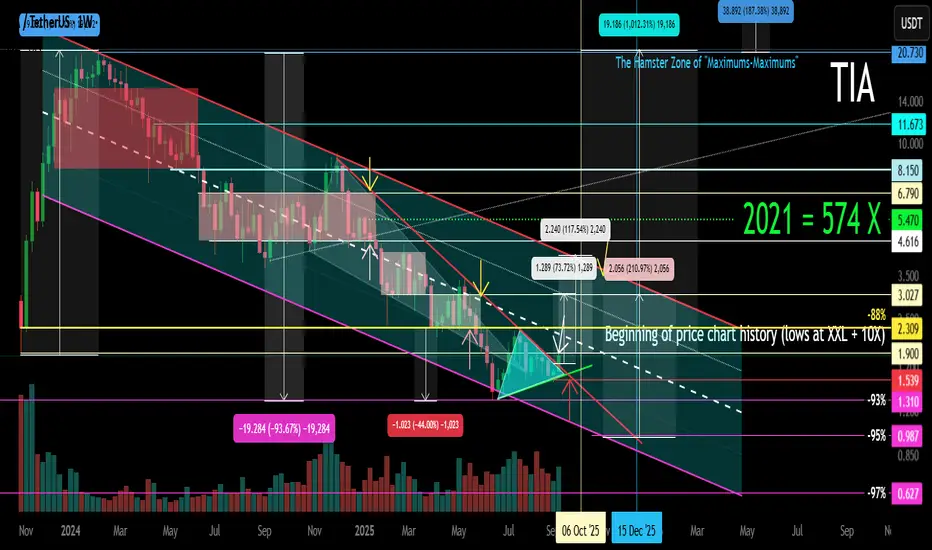
TIA (Celestia) XXL Main Trend Channel. Now +10X 13 09 25The price entered the 10X profit zone of crypto funds on 09 2025.
🟣 Locally , a symmetrical triangle formed under the downward trend.
🟢 Breakthrough — a trend break and movement to the resistance of the downward channel.
🔴Not a breakthrough — further immersion, after all, now the price is in the 10X zone , but already at least not 574 X ) When working with such hype, remember what a crazy profit the asset is at the "bottoms".
On the one hand, the asset will move with the market as a whole , and not by itself. In order to continue selling the hyped crypto wrapper, large market participants (swindlers and exchanges) will have to create hype again and redirect the traffic of "inexperienced" market participants. That is, make "dump waves ". You can use this, but with due regard to money management, and do not climb into margin and futures on such assets (inadequate profit on the other side). Work with local, down-to-earth goals (channel logic, in case of its breakthrough - the bowl), and not with maximum hypothetical ones.
OP Secondary trend. Wedge. Reversal zones. 17 04 2025From the wedge breakout, the price reached the level of 2.857 (81%) and from it the trend reversal under the general trend of altcoins, breaking through the "neck" zone of the head and shoulders, thereby realizing this pattern on a large scale and reaching the reversal zone of the minimums of the level of 0.509. We went down to the range below along the fan. Consolidation above the dynamic support opens up the potential for movement to its resistance, I specifically put another meridian, as from it with a high degree of probability, even with the implementation of the bullish potential, there will be a significant pump / dump rollback. It just intersects with the previous consolidation of support, which in this case acts as resistance (those who previously bought in this zone will sell, thereby going into breakeven and stimulating the stop of the impulse and a rollback (logical probability).
Locally, again having formed on the fall, as before, a descending wedge in the secondary trend. It has not yet been fully formed, the price is not clamped. But, conditionally, the price is at the minimum zone. You can start gaining from the average price, or work on a breakthrough of the formation, observing risk and money management. If you are scared (it is always like this at the minimum zone) - then everyone is the same, and most refuse to buy, but willingly buy when the price is already expensive.
A breakthrough of this wedge is a corrective upward movement to the mirror resistance zone of the previous consolidation (highlighted in gray), if in general, a "revival of faith" is observed in alts.
Also after breakout of the wedge, if the market as a whole is bearish on alts, then they will make a cut (in this case, a repeated set) at the zone of minimums in a wide range of price slippage and the complete death of faith in the candy wrapper of "crypto whales", highlighted in green.

DODO Local trend. 19 04 2025Logarithm. Time frame 3 days. No need for less. Capitulation zone or complete scam. From the breakthrough of support of the long-term horizontal channel -68%. For key local resistance zones in cases of breakthrough of resistance of the descending wedge, percentages for clarity are shown (similarly, as in the previous idea of this coin, reaching the specified % and reversal and super decline).
Secondary trend and this zone in it, for understanding the zone and risks of work.
DODO Secondary trend. 19 04 2025
Long-term as for me, it will be a scam, like all the rest.
Locally you can work with a wedge (breakthrough) and the first targets to the mirror resistance level. Sometimes pumps are “stick” into the depth of the previous channel, but not above its previous resistance level. Probably, these should be your last local-medium-term targets.
The maximum where I can pump crypto wrapper in the future for the big cryptocurrency hype, if it doesn’t crash earlier, is to the median zone, no higher than 0.666. But, as for me, it is more rational to work with local, maximally down-to-earth goals , observing risk and money management.

WLD Main trend. Super pump +1118 and decline -95. 09 05 2025Logarithm. Main trend. Time frame 3 days.
Super pump +1118.42% and decline -95.16%.
Smart and stupid money. The legend of the project is quite interesting, it is quite possible that there will be attempts to implement it, but always in the first place in such projects is: "money from nothing". The chart confirms this. After the pump +1118.42%, a huge distribution zone, which formed the upper part of the pattern of one of the varieties of "head and shoulders" at an angle. Which makes it clear that the profit is huge. Even now, with a price decrease below the listing prices, from the peak of the pump by -95.16%, which is normal for assets of such liquidity, the profit of some "investors" is +25 X !! Think about what profit was when pumping +1118% (it is impossible to implement, the pump is done just for the chart, to raise the price, for "false goals" and hype, so that on rollbacks "cheap", in the distribution zone they were not afraid to buy on the conditional hype "whales bought". Although now it is unlikely that they will pour. In order to constantly sell at excess profit "at any prices", you need to make interest, both for traders and for investors, that is, volatility waves. They will pump under the market.
Local trend . Local impulse from the minimum prices. Locally, the price rested against the median, in case of its breakthrough - the implementation of the ascending pennant.

XTZ Secondary Trend. Channel. Wedge. Capitulation Zone. 07 05 20Logarithm. Time frame 1 week (less is not necessary).
The secondary trend has formed a horizontal channel for several years, with repeating wedge-shaped formations, the third time we entered under the support of this channel not by squeezes to collect long stop-loss, but by full candles and the structure of a descending wedge. It looks more vertical. The corrective movement to this semi-vertical wedge, quite possibly, will similarly have an aggressive character. The wedge is almost in the final phase of its formation. I showed percentages for clarity to the key reversal zones, for orientation for your money management and setting the first medium-term, and possibly local targets.
The main trend of this previously hyped cryptocurrency since 2017
XTZ/USD Main Trend. Descending Channel 01 2023

ZK Secondary trend.-82% Wedge. Reversal zones. 01 05 2025Logarithm. Time frame 3 days. Decrease from listing about -82%. For cryptocurrencies of such liquidity and capitalization, this is not the maximum decrease (-90-96%). But sometimes from such values as now (-82-85%), taking into account the news hype during the listing "whales $ 458 million", a reversal and strong pumping can occur under the market as a whole. For example, like another hype project of "hanging noodles" - Flare (distributed to XRP holders). Decrease by -82% and then pumping slightly above the listing price under the next alt season of the cycle + 560%.
This does not necessarily mean that this will happen, this is an example of what happens from such values of decline with such liquidity and hype. In some ways, not only in the structure of the TA formation, but in the hype and disappointment of "investors", the projects are identical.
Main trend , and the previously shown zone, in which the price is now.
ZkSync Main trend. L2 for ETH. $458 million funds 21 02 2025
Main trend now in the moment (full trading history).
There is no need to guess the minimums and maximums. It is important to know these zones and have an acceptable average price, from the position of the trend and its potential. It is regulated by the distributed entry volume (in advance) at potential reversal zones.

A clear impulse correction for WLDUSDTWLDUSDT has formed an impulse and done it's ABC correction.
I think it is solid to think it will continue to go up to at least
$1.6, a simple idea from your legendary trader, who forecasted HOOD
uptrend on my youtube channel. :) BINANCE:WLDUSDT

BTC Game Plan – Long OpportunityBTC Game Plan – Long Opportunity
📊 Market Sentiment
Market sentiment remains firmly bullish as the FED is expected to deliver a 0.25% rate cut, with growing speculation of a potential 0.5% cut in September. Monetary policy adjustments are being driven not only by inflation but also by weakening labor market data. The latest August and September job reports came in soft, signaling that the economy is cooling rapidly. This backdrop strengthens expectations for one of the most significant bullish runs in the weeks ahead.
📈 Technical Analysis
BTC has confirmed bullish momentum after breaking the bearish trendline.
Price action currently looks like an accumulation phase, preparing to expand liquidity higher. I see this as a range-bound delivery where price takes both sides of liquidity pools located at the extremes, rather than running directly into new all-time highs.
📌 Game Plan
1)Watch for price to retrace into the 4H demand zone around $109,400.
2)Look for liquidity sweep at the 4H swing lows.
3)Possible deeper retracement into the 0.75 discount zone near $108,700.
🎯 Setup Trigger
I will look for a confirmed 1H break of structure before entering long.
📋 Trade Management
Stoploss: Below the 1H swing low responsible for the BOS
Targets:
• TP1: $103,450
• TP2: $117,400
💬 Like, follow, and comment if you find this setup valuable!
⚠️ Disclaimer: This content is for informational and educational purposes only and does not constitute financial, investment, or trading advice. Always do your own research before making any financial decisions.

MOVR Main trend. Dying hype. Price squeeze. 08 2025Logarithm. Time frame 1 week for the overall trend and this price clamping zone in it. The chart shows 2 zones with which it is rational to work after the trend break.
The first zone is the targets of the bullish triangle (there is a clamping in this range now) and resistance zones, if it is realized. If not, and the price decreases along the descending channel to its lower zone, then after the break and exit from this channel, these prices will still be reached with a high degree of probability. It is unlikely that this will be, as before, a "stick" at +800%.
Second zone — median of trend pump bowl, which, most likely, if it happens, is the maximum zone of maximums, before the project scam.
Locally triangle zone on the 3-day time frame.
It is also worth noting that the chart is used by tradingview spot to show the entire price history, but if you look at the price chart of some liquid exchange, you will see that bots are winding up the volume, and sometimes there are buyouts at the market.
From the position of the main trend , this is the price zone of its minimums.
Secondary , — conditional minimums. Work from the average price + on a breakout.
Local trend — work with a triangle, or in its canvas, if you are a scalper. Volatility there is significant due to low liquidity.
