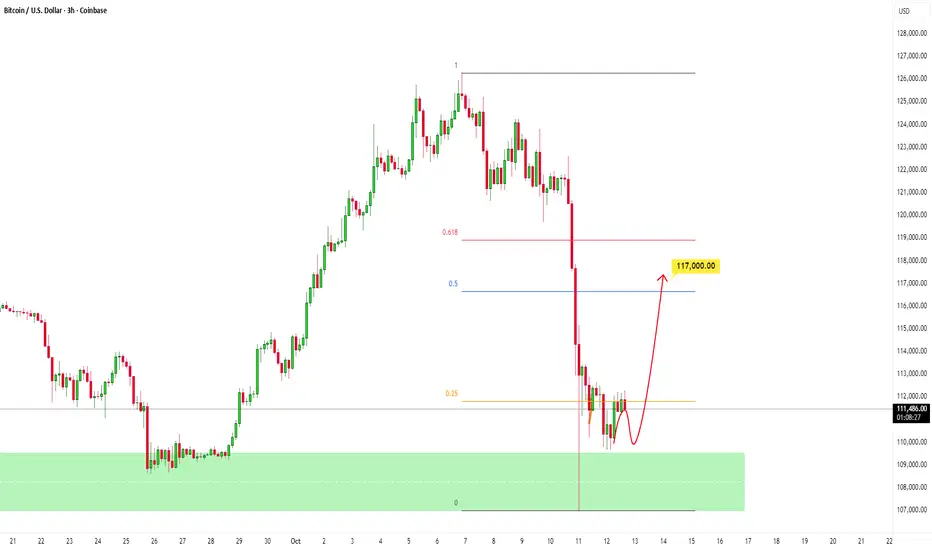
BTC to Retrace to Key Fibonacci level after Heavy SelloffPrice experienced a sharp and aggressive selloff and now, after a strong rejection from key level, the market is consolidating, showing early signs of stabilization as sellers begin to lose momentum.
If buyers can defend this area and push price higher, the next logical target lies around the Fibonacci 0.5–0.618 retracement zone, aligning with the 117,000 - 119,000 level, a key area where sellers may step back in.
Cryptomarket
TAO Eyes Next Leg Toward $700!BINANCE:TAOUSDT is breaking through a key resistance zone, signaling a strong shift in momentum.
This breakout not only confirms buyer strength but also opens the door for a potential move toward the $700 region, where the next major resistance lies.
As long as TAO holds above this breakout zone, the structure remains bullish and continuation toward higher levels looks likely.
DYOR, NFA
THANKS FOR THE READ

BTCUSDT Supply-Demand Confirmation LongSee chart for analysis.
I don't trade bitcoin so this is mainly based off technicals.

BTC Bias — Watching for Breakdown & Short OpportuniesLast week I was leaning bullish on Bitcoin, but that bias has now been invalidated after losing structure on the daily. Price has broken below the 5/10/20 EMA stack and failed to reclaim it — signalling indecision and potential downside momentum building beneath the surface.
While the weekly chart is still holding the 20 EMA (so the higher-timeframe bias remains technically bullish), the constant back-and-forth on the daily suggests exhaustion. If BTC closes a full candle below the weekly 20 EMA, that’s my trigger for a confirmed shift — and at that point, I’ll begin actively watching for short setups across the board.
Many altcoins — especially hype names like HYPE, BONK, MOG, BRETT, and PEPE — are already showing clear weakness. If Bitcoin breaks down from here, those are likely to unwind hard, giving some of the cleanest short opportunities we’ve seen in months.
For now, I’m sidelined and patient — waiting for BTC to either reclaim the daily EMAs and re-establish strength, or confirm breakdown for a full risk-off move.
Questions for discussion:
– Do you think BTC holds the weekly 20 EMA or breaks it this time?
– Which altcoin looks weakest to you right now if Bitcoin rolls over?
– Are you staying flat, or preparing to position short on further confirmation?

ETH : BUY OR SELL ?Hello friends
Given the good decline we had, there was a good opportunity to buy at good prices with capital and risk management and in steps and move towards the specified goals.
*Trade safely with us*

SOL ; BUY OR SELL ?Hello friends
Given the decline we had, we can see it as an opportunity to buy at lower prices with risk and capital management.
Now we have obtained support levels for you and we have an important resistance that the price must break strongly to make the climb valid for us.
The goals are also clear.
*Trade safely with us*

TradeCityPro | Bitcoin Daily Analysis #196👋 Welcome to TradeCity Pro!
Let’s go over Bitcoin's analysis. The price is moving down again, so let’s review Bitcoin's movement together.
⏳ 1-Hour Timeframe
Yesterday, we had a trigger at the $115,698 zone, but the price couldn't sustain above this level, and Bitcoin's downward movement has started again.
✔️ A double top pattern has formed in this timeframe, and the trigger for this pattern activation was $113,991, which has now been activated. With the large volume, the price has managed to stabilize even below the $111,278 zone.
💥 The RSI oscillator has once again entered Oversell, and the price has reached near our support zone.
⚡️ If this support zone is broken, we can open a short position. Otherwise, I won’t be opening any short positions with other triggers.
📈 For a long position, we need a very strong reaction and significant bullish momentum at the support zone. In this case, the main trigger for a long would be $115,698, but we can also use earlier triggers if they form.
📊 For now, I will wait to see how the price reacts to the zone and then look for the trigger. The only trigger I have at the moment is $115,698.
❌ Disclaimer ❌
Trading futures is highly risky and dangerous. If you're not an expert, these triggers may not be suitable for you. You should first learn risk and capital management. You can also use the educational content from this channel.
Finally, these triggers reflect my personal opinions on price action, and the market may move completely against this analysis. So, do your own research before opening any position.

TradeCityPro | LINK: Eyeing $18 for Potential Drop👋 Welcome to TradeCity Pro!
In this analysis, I’m going to review the LINK coin — one of the RWA projects, currently ranked 12th on CoinMarketCap with a market capitalization of $12.57 billion.
⏳ 1-Hour Timeframe
In the 1-hour timeframe, after Friday’s drop, the price fell to $16.78.
💫 Following this decline, the price made an upward correction up to the 0.618 Fibonacci level. After one reaction to this zone, bearish momentum returned to the market, and volume has been increasing.
✅ Currently, the price is moving toward the $18.31 level. Breaking this zone could trigger the start of the next downward leg.
⭐ The main support level remains at $16.78, and as long as the price stays above this zone, I won’t be opening any short positions.
📊 For long positions, the current trigger is $20.02.For earlier triggers, we need to wait for the market to form more structure and generate new entry signals.
📝 Final Thoughts
Stay calm, trade wisely, and let's capture the market's best opportunities!
This analysis reflects our opinions and is not financial advice.
Share your thoughts in the comments, and don’t forget to share this analysis with your friends! ❤️

ETHUSDTHello Traders! 👋
What are your thoughts on Ethereum?
Ethereum is currently trading between two major zones of support and resistance.
In this range, we expect a short-term correction toward the ascending trendline, followed by some consolidation before a potential breakout above the resistance zone.
If the support holds, followed by a positive reaction from the trendline and a breakout above the resistance level, Ethereum is expected to begin a new bullish wave and move higher toward the identified target levels.
If a daily candle closes below $3,500, this bullish scenario will be invalidated and a deeper correction could follow.
Don’t forget to like and share your thoughts in the comments! ❤️

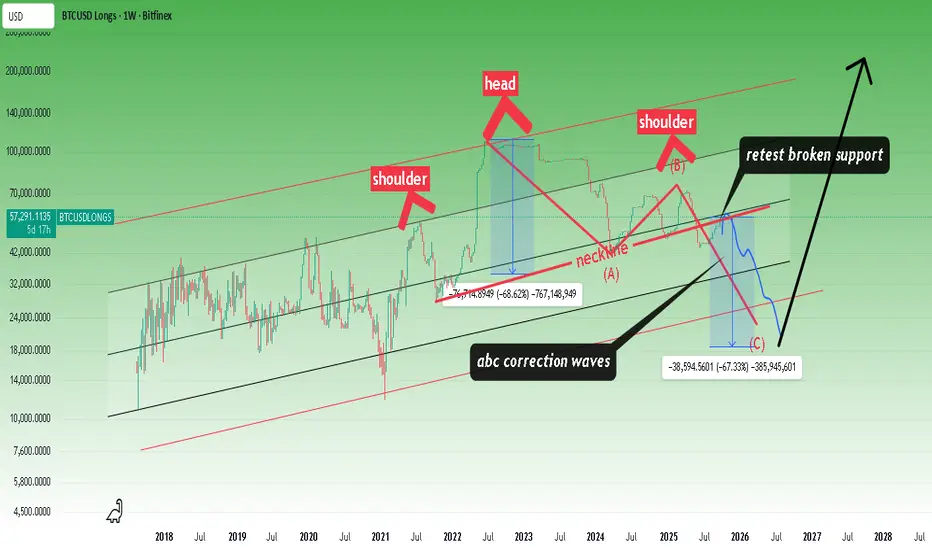
Corrective waves continue.Bitcoin's bullish sentiment still far outweighs its bearish sentiment. In my opinion, this is a balancing act. I think the market will stabilize in the coming months.
* The purpose of my graphic drawings is purely educational.
* What i write here is not an investment advice. Please do your own research before investing in any asset.
* Never take my personal opinions as investment advice, you may lose your money.
BTC/USD: Danger Zone Ahead—Here’s What I’m Watching Take a close look at what’s happening now. BTC/USD is on the edge at 111,060, and if that breaks, the next major levels are 106,470, 103,200, then possibly even 100,000. Markets can shift fast; are you prepared with clear levels and a plan, or will you get caught reacting?
If you’ve ever felt unsure about how to spot big moves before they happen, or wondered how some traders seem to always stay one step ahead, you’re not alone. What’s the one thing you wish someone had told you when the market started moving fast? What’s your biggest struggle when the price gets volatile?
Drop your thoughts or questions in the comments
Or if you want to dig deeper, my inbox is always open for a real conversation. Sometimes the right question is all it takes to unlock a breakthrough. What do you want to see covered next?

BTCUSD H4 | Bearish Momentum To ExtendBitcoin (BTC/USD) is rising towards the sell entry at 117,225.08, which is a pullback resistance that is slightly above the 23.6% Fibonacci retracement.
Stop loss is at 121,603.58, which is a pullback resistance that lines up with the 61.8% Fibonacci retracement.
Take profit is at 109,369.55, which is a multi swing low support.
High Risk Investment Warning
Trading Forex/CFDs on margin carries a high level of risk and may not be suitable for all investors. Leverage can work against you.
Stratos Markets Limited (tradu.com ):
CFDs are complex instruments and come with a high risk of losing money rapidly due to leverage. 65% of retail investor accounts lose money when trading CFDs with this provider. You should consider whether you understand how CFDs work and whether you can afford to take the high risk of losing your money.
Stratos Europe Ltd (tradu.com ):
CFDs are complex instruments and come with a high risk of losing money rapidly due to leverage. 66% of retail investor accounts lose money when trading CFDs with this provider. You should consider whether you understand how CFDs work and whether you can afford to take the high risk of losing your money.
Stratos Global LLC (tradu.com ):
Losses can exceed deposits.
Please be advised that the information presented on TradingView is provided to Tradu (‘Company’, ‘we’) by a third-party provider (‘TFA Global Pte Ltd’). Please be reminded that you are solely responsible for the trading decisions on your account. There is a very high degree of risk involved in trading. Any information and/or content is intended entirely for research, educational and informational purposes only and does not constitute investment or consultation advice or investment strategy. The information is not tailored to the investment needs of any specific person and therefore does not involve a consideration of any of the investment objectives, financial situation or needs of any viewer that may receive it. Kindly also note that past performance is not a reliable indicator of future results. Actual results may differ materially from those anticipated in forward-looking or past performance statements. We assume no liability as to the accuracy or completeness of any of the information and/or content provided herein and the Company cannot be held responsible for any omission, mistake nor for any loss or damage including without limitation to any loss of profit which may arise from reliance on any information supplied by TFA Global Pte Ltd.
The speaker(s) is neither an employee, agent nor representative of Tradu and is therefore acting independently. The opinions given are their own, constitute general market commentary, and do not constitute the opinion or advice of Tradu or any form of personal or investment advice. Tradu neither endorses nor guarantees offerings of third-party speakers, nor is Tradu responsible for the content, veracity or opinions of third-party speakers, presenters or participants.

ETHUSD H1 | Bullish BounceETH/USD is falling towards the buy entry at 4,199.93, which is a pullback support that aligns with the 23.6% Fibonacci retracement and could bounce from this level to the upside.
Stop loss is at 4,080.59, which is a pullback support that lines up with the 50% Fibonacci retracement.
Take profit is at 4,412.84, which is an overlap resistance that lines up with the 61.8% Fibonacci retracement.
High Risk Investment Warning
Trading Forex/CFDs on margin carries a high level of risk and may not be suitable for all investors. Leverage can work against you.
Stratos Markets Limited (tradu.com ):
CFDs are complex instruments and come with a high risk of losing money rapidly due to leverage. 65% of retail investor accounts lose money when trading CFDs with this provider. You should consider whether you understand how CFDs work and whether you can afford to take the high risk of losing your money.
Stratos Europe Ltd (tradu.com ):
CFDs are complex instruments and come with a high risk of losing money rapidly due to leverage. 66% of retail investor accounts lose money when trading CFDs with this provider. You should consider whether you understand how CFDs work and whether you can afford to take the high risk of losing your money.
Stratos Global LLC (tradu.com ):
Losses can exceed deposits.
Please be advised that the information presented on TradingView is provided to Tradu (‘Company’, ‘we’) by a third-party provider (‘TFA Global Pte Ltd’). Please be reminded that you are solely responsible for the trading decisions on your account. There is a very high degree of risk involved in trading. Any information and/or content is intended entirely for research, educational and informational purposes only and does not constitute investment or consultation advice or investment strategy. The information is not tailored to the investment needs of any specific person and therefore does not involve a consideration of any of the investment objectives, financial situation or needs of any viewer that may receive it. Kindly also note that past performance is not a reliable indicator of future results. Actual results may differ materially from those anticipated in forward-looking or past performance statements. We assume no liability as to the accuracy or completeness of any of the information and/or content provided herein and the Company cannot be held responsible for any omission, mistake nor for any loss or damage including without limitation to any loss of profit which may arise from reliance on any information supplied by TFA Global Pte Ltd.
The speaker(s) is neither an employee, agent nor representative of Tradu and is therefore acting independently. The opinions given are their own, constitute general market commentary, and do not constitute the opinion or advice of Tradu or any form of personal or investment advice. Tradu neither endorses nor guarantees offerings of third-party speakers, nor is Tradu responsible for the content, veracity or opinions of third-party speakers, presenters or participants.

LTCUSD H4 | Could We See a Bullish Reversal?Litecoin has bounced off the buy entry which is a pullback support and could rise from this level to the upside.
Buy entry is at 97.36, which i a pullback support.
Stop loss is at 90.92, which is an overlap support that aligns with the 127.2% Fibonacci extension.
Take profit is at 111.13, which is a pullback resistance that lines up with the 38.2% Fibonacci retracement.
High Risk Investment Warning
Trading Forex/CFDs on margin carries a high level of risk and may not be suitable for all investors. Leverage can work against you.
Stratos Markets Limited (tradu.com ):
CFDs are complex instruments and come with a high risk of losing money rapidly due to leverage. 65% of retail investor accounts lose money when trading CFDs with this provider. You should consider whether you understand how CFDs work and whether you can afford to take the high risk of losing your money.
Stratos Europe Ltd (tradu.com ):
CFDs are complex instruments and come with a high risk of losing money rapidly due to leverage. 66% of retail investor accounts lose money when trading CFDs with this provider. You should consider whether you understand how CFDs work and whether you can afford to take the high risk of losing your money.
Stratos Global LLC (tradu.com ):
Losses can exceed deposits.
Please be advised that the information presented on TradingView is provided to Tradu (‘Company’, ‘we’) by a third-party provider (‘TFA Global Pte Ltd’). Please be reminded that you are solely responsible for the trading decisions on your account. There is a very high degree of risk involved in trading. Any information and/or content is intended entirely for research, educational and informational purposes only and does not constitute investment or consultation advice or investment strategy. The information is not tailored to the investment needs of any specific person and therefore does not involve a consideration of any of the investment objectives, financial situation or needs of any viewer that may receive it. Kindly also note that past performance is not a reliable indicator of future results. Actual results may differ materially from those anticipated in forward-looking or past performance statements. We assume no liability as to the accuracy or completeness of any of the information and/or content provided herein and the Company cannot be held responsible for any omission, mistake nor for any loss or damage including without limitation to any loss of profit which may arise from reliance on any information supplied by TFA Global Pte Ltd.
The speaker(s) is neither an employee, agent nor representative of Tradu and is therefore acting independently. The opinions given are their own, constitute general market commentary, and do not constitute the opinion or advice of Tradu or any form of personal or investment advice. Tradu neither endorses nor guarantees offerings of third-party speakers, nor is Tradu responsible for the content, veracity or opinions of third-party speakers, presenters or participants.

SOLUSD H4 | Bullish ReversalSOL/USD is reacting off the buy entry which is a pullback support and oculd rise from this level to the upside.
Buy entry is at 204.32, which is a pullback support.
Stop loss is at 187.97, which is an overlap support.
Take profit is at 228.36, which is an overlap resistance that aligns with the 78.6% Fibonacci retracement.
High Risk Investment Warning
Trading Forex/CFDs on margin carries a high level of risk and may not be suitable for all investors. Leverage can work against you.
Stratos Markets Limited (tradu.com ):
CFDs are complex instruments and come with a high risk of losing money rapidly due to leverage. 65% of retail investor accounts lose money when trading CFDs with this provider. You should consider whether you understand how CFDs work and whether you can afford to take the high risk of losing your money.
Stratos Europe Ltd (tradu.com ):
CFDs are complex instruments and come with a high risk of losing money rapidly due to leverage. 66% of retail investor accounts lose money when trading CFDs with this provider. You should consider whether you understand how CFDs work and whether you can afford to take the high risk of losing your money.
Stratos Global LLC (tradu.com ):
Losses can exceed deposits.
Please be advised that the information presented on TradingView is provided to Tradu (‘Company’, ‘we’) by a third-party provider (‘TFA Global Pte Ltd’). Please be reminded that you are solely responsible for the trading decisions on your account. There is a very high degree of risk involved in trading. Any information and/or content is intended entirely for research, educational and informational purposes only and does not constitute investment or consultation advice or investment strategy. The information is not tailored to the investment needs of any specific person and therefore does not involve a consideration of any of the investment objectives, financial situation or needs of any viewer that may receive it. Kindly also note that past performance is not a reliable indicator of future results. Actual results may differ materially from those anticipated in forward-looking or past performance statements. We assume no liability as to the accuracy or completeness of any of the information and/or content provided herein and the Company cannot be held responsible for any omission, mistake nor for any loss or damage including without limitation to any loss of profit which may arise from reliance on any information supplied by TFA Global Pte Ltd.
The speaker(s) is neither an employee, agent nor representative of Tradu and is therefore acting independently. The opinions given are their own, constitute general market commentary, and do not constitute the opinion or advice of Tradu or any form of personal or investment advice. Tradu neither endorses nor guarantees offerings of third-party speakers, nor is Tradu responsible for the content, veracity or opinions of third-party speakers, presenters or participants.

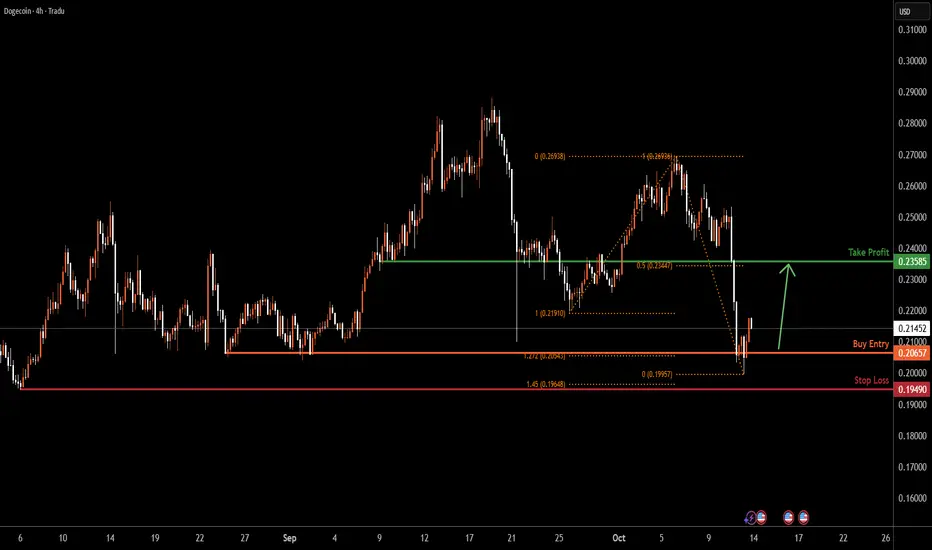
DOGEUSD H4 | Bullish ReversalBased on the H4 chart analysis, we can see that the price has bounced off the buy entry which is a multi-swings glow support that aligns with the 127.2% Fibonacci extension and could potentially rise from this level to the upside.
Buy entry is at 0.20657, which is a multi swing low support that aligns with the 127.2% Fibonacci extension.
Stop loss is at 0.19490, which is a pullback support that lines up with the 145% Fibonacci extension.
Take profit is at 0.23585, which is an overlap resistance that aligns with the 50% Fibonacci retracement.
High Risk Investment Warning
Trading Forex/CFDs on margin carries a high level of risk and may not be suitable for all investors. Leverage can work against you.
Stratos Markets Limited (tradu.com ):
CFDs are complex instruments and come with a high risk of losing money rapidly due to leverage. 65% of retail investor accounts lose money when trading CFDs with this provider. You should consider whether you understand how CFDs work and whether you can afford to take the high risk of losing your money.
Stratos Europe Ltd (tradu.com ):
CFDs are complex instruments and come with a high risk of losing money rapidly due to leverage. 66% of retail investor accounts lose money when trading CFDs with this provider. You should consider whether you understand how CFDs work and whether you can afford to take the high risk of losing your money.
Stratos Global LLC (tradu.com ):
Losses can exceed deposits.
Please be advised that the information presented on TradingView is provided to Tradu (‘Company’, ‘we’) by a third-party provider (‘TFA Global Pte Ltd’). Please be reminded that you are solely responsible for the trading decisions on your account. There is a very high degree of risk involved in trading. Any information and/or content is intended entirely for research, educational and informational purposes only and does not constitute investment or consultation advice or investment strategy. The information is not tailored to the investment needs of any specific person and therefore does not involve a consideration of any of the investment objectives, financial situation or needs of any viewer that may receive it. Kindly also note that past performance is not a reliable indicator of future results. Actual results may differ materially from those anticipated in forward-looking or past performance statements. We assume no liability as to the accuracy or completeness of any of the information and/or content provided herein and the Company cannot be held responsible for any omission, mistake nor for any loss or damage including without limitation to any loss of profit which may arise from reliance on any information supplied by TFA Global Pte Ltd.
The speaker(s) is neither an employee, agent nor representative of Tradu and is therefore acting independently. The opinions given are their own, constitute general market commentary, and do not constitute the opinion or advice of Tradu or any form of personal or investment advice. Tradu neither endorses nor guarantees offerings of third-party speakers, nor is Tradu responsible for the content, veracity or opinions of third-party speakers, presenters or participants.
BCHUSD H4| Bullish Bounce Off Major SupportBCH/USD has bounced off the buy entry which is a multi-swing low support and could rise from this level to the upside.
Buy entry is at 527.26, which is a multi-swing low support.
Stop loss is at 509.38, which is a pullback support that aligns with the 127.2% Fibonacci extension.
Take profit is at 566.31, which is a pullback resistance that lines up with the 50% Fibonacci retracement.
High Risk Investment Warning
Trading Forex/CFDs on margin carries a high level of risk and may not be suitable for all investors. Leverage can work against you.
Stratos Markets Limited (tradu.com ):
CFDs are complex instruments and come with a high risk of losing money rapidly due to leverage. 65% of retail investor accounts lose money when trading CFDs with this provider. You should consider whether you understand how CFDs work and whether you can afford to take the high risk of losing your money.
Stratos Europe Ltd (tradu.com ):
CFDs are complex instruments and come with a high risk of losing money rapidly due to leverage. 66% of retail investor accounts lose money when trading CFDs with this provider. You should consider whether you understand how CFDs work and whether you can afford to take the high risk of losing your money.
Stratos Global LLC (tradu.com ):
Losses can exceed deposits.
Please be advised that the information presented on TradingView is provided to Tradu (‘Company’, ‘we’) by a third-party provider (‘TFA Global Pte Ltd’). Please be reminded that you are solely responsible for the trading decisions on your account. There is a very high degree of risk involved in trading. Any information and/or content is intended entirely for research, educational and informational purposes only and does not constitute investment or consultation advice or investment strategy. The information is not tailored to the investment needs of any specific person and therefore does not involve a consideration of any of the investment objectives, financial situation or needs of any viewer that may receive it. Kindly also note that past performance is not a reliable indicator of future results. Actual results may differ materially from those anticipated in forward-looking or past performance statements. We assume no liability as to the accuracy or completeness of any of the information and/or content provided herein and the Company cannot be held responsible for any omission, mistake nor for any loss or damage including without limitation to any loss of profit which may arise from reliance on any information supplied by TFA Global Pte Ltd.
The speaker(s) is neither an employee, agent nor representative of Tradu and is therefore acting independently. The opinions given are their own, constitute general market commentary, and do not constitute the opinion or advice of Tradu or any form of personal or investment advice. Tradu neither endorses nor guarantees offerings of third-party speakers, nor is Tradu responsible for the content, veracity or opinions of third-party speakers, presenters or participants.

DGBUSD - DigiByte, the Hidden GemThis is an idea based on the DGBUSD chart 1W log using Fibs levels and Bars Patterns.
DigiByte is known as the most decentralized coin on the market. Open Source, better tech than Bitcoin, smart contracts, decentralized applications and secure authentication, make DGB a True Gem.
Rumors about the incoming DigiDollar stable coin and years of accumulation could skyrocket soon the demand. DigiByte is ready for a 100-200x
This is not a financial advice. Do Your Own Research

Altseason on the Horizon?Technically, BTC Dominance has retested the breakdown of the rising channel, confirming a clean rejection from the retest area.
If price manages to break below the current support zone, we could see a strong shift toward altcoins as capital starts rotating out of BTC.
This recent move also flushed out over-leveraged traders, resetting market positioning, a healthy sign before the next major leg.
Stay patient and always analyze your risk before entering any position. The next few weeks could be decisive for the altcoin market.
DYOR, NFA
Stay tuned for more update
THANKS FOR THE READING
#PEACE

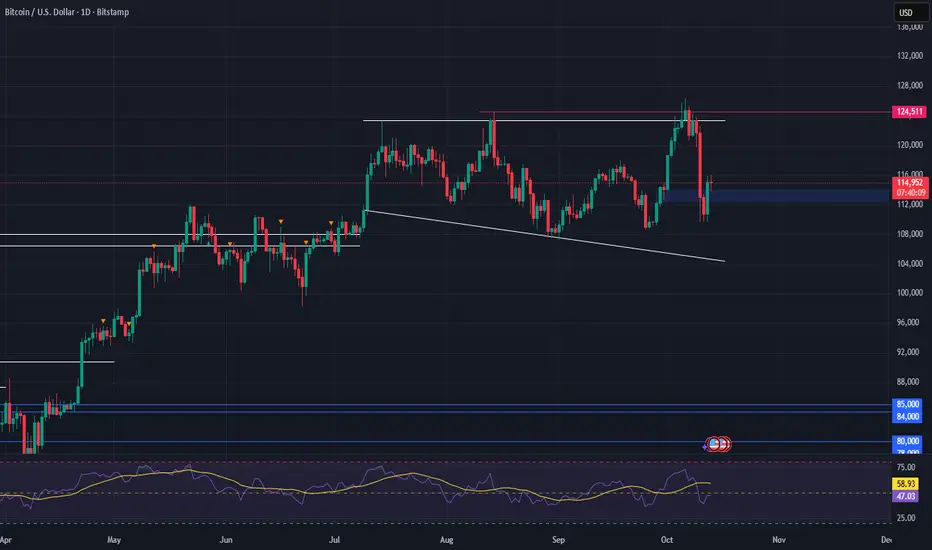
Bitcoin: Bull Trend Intact, Wedge Breakout Setting UpWe’re pivoting back to Bitcoin (BTCUSD) this week after its recent breakout to fresh all-time highs. It’s a strong reminder that the broader trend remains bullish, and the bulls are still very much in control.
🔍 On the daily chart, we’re watching a new wedge formation develop. BTC is currently consolidating just beneath a major resistance zone. A break and daily close above the $124K–$125K range would likely confirm the next leg of this bull cycle.
📈 If the breakout holds, the measured move from the wedge projects a rally into the $138K–$140K zone. That’s our near-term upside target, contingent on momentum and confirmation.
📉 On the downside, support holds firm between $112K–$114K. As long as price remains above this level, the path of least resistance is still higher.
Up onlyWe are at the light blue cross.
August 2020 after heavy deleverage, precious metals in ATH while Governments of the world are easing.
Dollar should fall a little more from here.
Tech and crypto will continue higher while commodities go up but underperform.
Cheers.

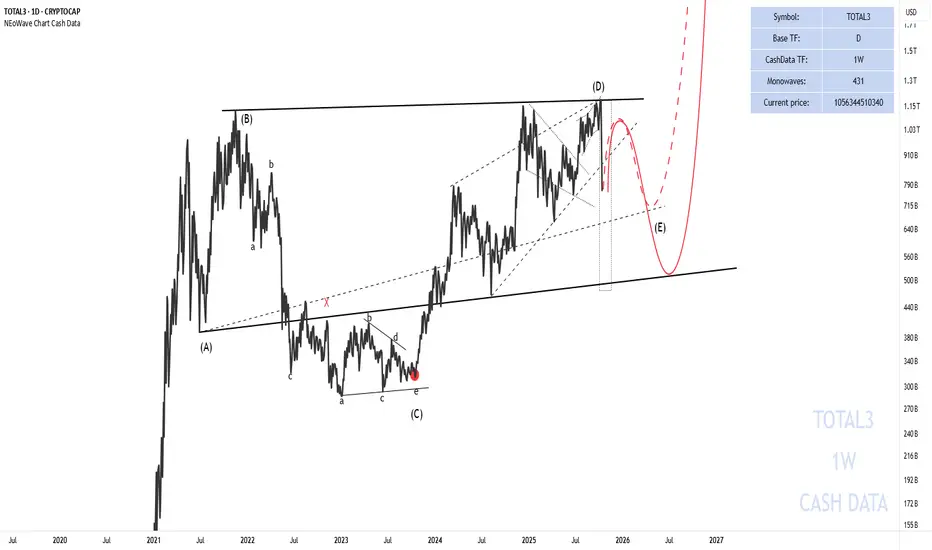
The time for the ALTCOIN rallyThe text is a bit long, but it contains valuable insights. I’ve reviewed the past and discussed the #TOTAL3 chart update at the end, so make sure to read the full text and check the charts and previous posts linked for reference.
1. In my initial analysis on July 9, I mentioned that in the long-term view, the TOTAL3 index was heading toward the red box. This played out, with the index rising about 38%, leading to 40-70% gains in altcoins.
2. On July 19 , I explained this chart further, noting that many believed the altcoin season had started and altcoins would see significant gains. However, the chart showed we were in wave-(D) of a neutral triangle, indicating that the major altcoin surge people expected wasn’t here yet.
3. In my latest analysis on September 26, I wrote:
"The Running Triangle pattern remains valid. However, with wave-e breaking the a-c trendline, we should consider this a warning. There’s a possibility that a Diametric pattern could form instead of a Running Triangle.
Altcoin Market:
As I previously stated, the altseason many analysts expect hasn’t arrived yet. Looking at the 1W cash data chart, we’re in wave-(D) of a Neutral Triangle. Still, I believe altcoins could see 30-70% growth. In my view, the main altseason is likely to occur in 2026. To pinpoint the start, we need to wait for wave-(D) to complete."
4. #TOTAL3 Chart Update:
As noted in my last analysis, the final part of wave-(D) turned into a Diametric pattern (explained in the latest #TOTAL3 analysis). Exactly from the red box, a sharp 35% drop in the #TOTAL3 index occurred. This suggests that wave-(D) of the neutral triangle has ended, and wave-(E) has begun. Based on the price size of wave-(D), the final wave of the neutral triangle could complete at 699B or 514B, after which the main altcoin rally should start. I expected another upward move, but Trump’s influence halted the growth.
Good luck
NEoWave Chart
TradeCityPro | Bitcoin Daily Analysis #195👋 Welcome to TradeCity Pro!
Let’s move on to Bitcoin analysis. Yesterday, price started an upward move, so let’s see what triggers we have today.
⌛️ 1-Hour Timeframe
Yesterday, price found support at our key zone and also activated the 112,420 risk trigger we had identified.
✨ If you opened a position, it’s not a bad time to take profits, since this was a risky setup, and such positions should be managed quickly.
🧮 Currently, a resistance high has formed around 115,698. If this level breaks, price could continue its upward movement.
💫 As long as price stays above 112,420, this trigger remains active and can be used to open positions.
✔️ For shorts, I personally won’t be taking any until price breaks below 107,000 and stabilizes under that zone.
❌ Disclaimer ❌
Trading futures is highly risky and dangerous. If you're not an expert, these triggers may not be suitable for you. You should first learn risk and capital management. You can also use the educational content from this channel.
Finally, these triggers reflect my personal opinions on price action, and the market may move completely against this analysis. So, do your own research before opening any position.
