DOGEUSD; Heikin Ashi Trade Idea📈 Hey Traders!
Here’s a fresh outlook from my trading desk. If you’ve been following me for a while, you already know my approach:
🧩 I trade Supply & Demand zones using Heikin Ashi chart on the 4H timeframe.
🧠 I keep it mechanical and clean — no messy charts, no guessing games.
❌ No trendlines, no fixed sessions, no patterns, no indicator overload.
❌ No overanalyzing market structure or imbalances.
❌ No scalping, and no need to be glued to the screen.
✅ I trade exclusively with limit orders, so it’s more of a set-and-forget style.
✅ This means more freedom, less screen time, and a focus on quality setups.
✅ Just a simplified, structured plan and a calm mindset.
💬 Let’s Talk:
💡Do you trade supply & demand too ?
💡What’s your go-to timeframe ?
💡Ever tried Heikin Ashi ?
📩 Got questions about my strategy or setup? Drop them below — ask me anything, I’m here to share.
Let’s grow together and keep it simple. 👊
Cryptomarket

BTC Dips Below Key Zone — Is $73K the Next Stop?$BTC/USDT has broken below the support trendline and the key support zone.
The next major support to watch is around the $73K level.
DYOR, NFA

Solana Explosion: Will SOL Hit $183 or Crash Below $100?If SOL breaks above 144.77, next stops are 153.65 and possibly 183 on strong momentum.
But dropping below 130 could trigger a sharp slide toward the $100 zone—watch these levels!

SUIUSD; Heikin Ashi Trade Idea📈 Hey Traders!
Here’s a fresh outlook from my trading desk. If you’ve been following me for a while, you already know my approach:
🧩 I trade Supply & Demand zones using Heikin Ashi chart on the 4H timeframe.
🧠 I keep it mechanical and clean — no messy charts, no guessing games.
❌ No trendlines, no fixed sessions, no patterns, no indicator overload.
❌ No overanalyzing market structure or imbalances.
❌ No scalping, and no need to be glued to the screen.
✅ I trade exclusively with limit orders, so it’s more of a set-and-forget style.
✅ This means more freedom, less screen time, and a focus on quality setups.
✅ Just a simplified, structured plan and a calm mindset.
💬 Let’s Talk:
💡Do you trade supply & demand too ?
💡What’s your go-to timeframe ?
💡Ever tried Heikin Ashi ?
📩 Got questions about my strategy or setup? Drop them below — ask me anything, I’m here to share.
Let’s grow together and keep it simple. 👊

CRYPTO MARKET IN BIG TROUBLE! CRACK!!🔥 Crypto Bros… this is the LAST thing you ever want to see on your chart.
The last time I warned about a MEGAPHONE CRACK back in July 2024, the entire crypto market dropped 31% — and that was while it was still in an uptrend.
This time?
This crack is far, far worse because it’s breaking the entire structure, not just a line.
Breaking a trendline alone is whatever…
But breaking a major structural boundary at this point in the cycle?
You do NOT want to find out whether this is “the real one” or not.
I’m issuing a major WARNING to crypto bulls.
Your whole generation has been trained for 17 straight years to “Buy The Dip.”
That conditioning is a massive disadvantage — and most of you don’t even know it.
And those cute, colorful, meme-filled crypto charts made by 12-year-olds posing as traders?
They aren’t going to save you.
They’re going to massacre your account when the cycle actually breaks.
You had your fun.
Now it’s time to get off the Ferris wheel, step to the sidelines, and actually observe and learn — no matter where price goes from here.
Over $1 trillion has already been wiped out.
Don’t stick around waiting for the other $2 trillion to evaporate with it.
Stay sharp. Stay humble. Stay alive.
Sorry, but it has to be said by somebody!
THANK YOU for getting me to 5,000 followers! 🙏🔥
Let’s keep climbing.
If you enjoy the work:
👉 Boost
👉 Follow
👉 Drop a solid comment
Let’s push it to 6,000 and keep building a community grounded in truth, not hype.

LTCUSDT : Full analysisHello friends
well you see that the power is in the hands of the sellers and we must have sufficient approvals to buy.
So you see, we have two important support areas that we have identified for you with Fibonacci, and they can be good supports. We need to see how buyers react in these areas.
Well, the next point is that despite the sharp drop in Bitcoin, Litecoin did not fall much. It fell by almost half of Bitcoin. Considering the previous times I saw that when Bitcoin fell, other currencies fell several times as much, and this is a good sign (meaning that its holders have a positive view of the currency).
But to buy, we need to know where and when to buy, to find the best point to buy and to take our profits at the best point. For this reason, we expect that Litecoin will most likely bottom out again and buy in support areas with risk and capital management and in steps And to move with the specified goals.
*Trade safely with us*

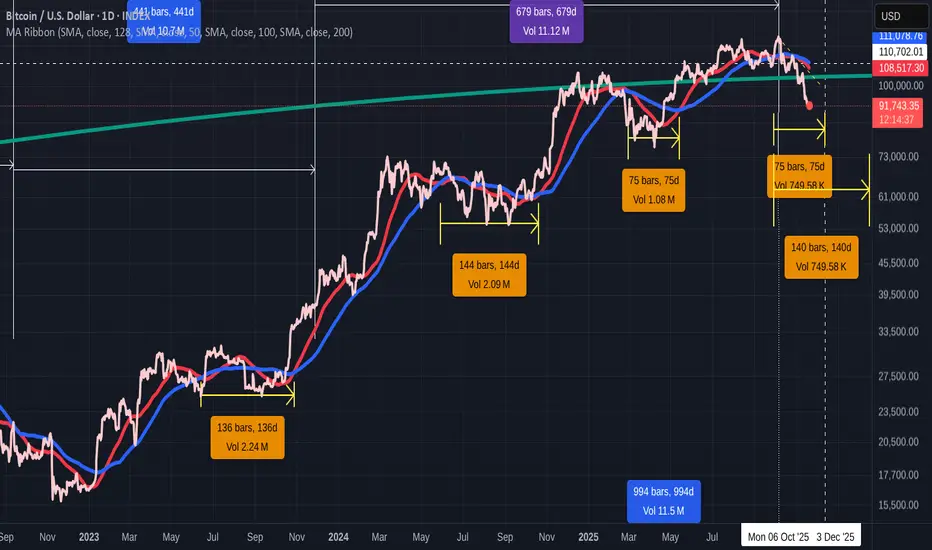
Bitcoin Daily 50 & 100 SMA day counts this cycle from crossover
This post is in conjunction with the weekly SMA I just posted.
It will predict nothing But it will give us an idea of how the "Cycle" is continuing or not, by the end of this month.
The day counts are from when the 50 SMA ( RED ) first drops below the 100 ( BLUE ) - BEARISH, to when the 50 Rises back above and remains above on the DAILY BITCOIN INDEX chart.
The First 2 occasions, since Jan 2023
2023 - 136 days
2024 - 144 days
Unusually, 2025 has 2 occasions where the 50 dropped below the 100.
The first lasted 75 Days in early 2025
And so , now, with the daily 50 having just crossed below the 100, we can maybe project forward and see when the 50 may recover back over the 100, IF the market remains Bullish
If we were to do another 75 days, we could expect the Bullish crossover at the beginning of December....which would be a similar total day count of the 50 below the 100 of the previous years this cycle ( 75 in early 2025 + 75 now )
THIS is what I think is possible as it has confluence with other charts.
If we have to wait around 140 days ( the average of the two previous longer occasions) we will be in February 2026
This Time does also have some confluence in other charts but it less strength
There is a Very Good reason Why O feel that PA HAS to climb again and that is simply that PA has fallen back below LONG TERM RESISTANCE>
As mentioned in many previous posts, that Blue Arc has rejected EVERY ATH since Bitcoin began its climb in 2011
There is also a line of resistance just below current PA position, that is squeezing PA....And it has never been crossed before.
IF PA drops much further, we WILL drop below that line of Support.
For me, THIS is what I am watching the most
Stay safe
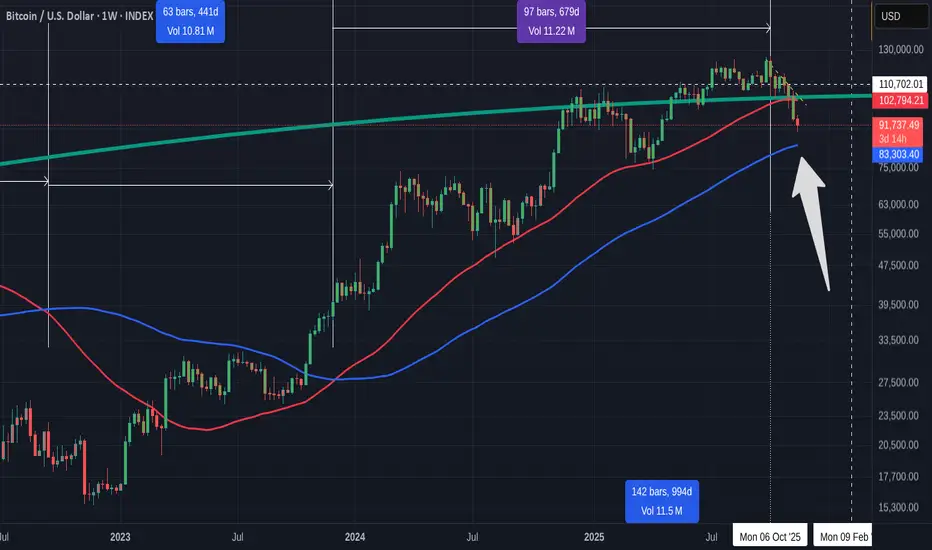
Bitcoin Weekly SMA - Next Level support at the 100 SMA 83K and..** Candle Colours are effected by a Bull Bear indicator, indicating Bull Bear sentiment...
Note THIS week is the First BEAR week Candle in a very long time, since March 2025
Bitcoin Lost the 50 SMA ( RED ), first time this Cycle.
And we see the 100 SMA ( BLUE ) running parallel and so, this s logically the next level of support should we drop lower.
What is the relevance of the 50 & 100 SMA to Bitcoin PA
This is the Bitcoin Chart since December 2013
The Labels above are the day counts from ATH, to the SMA crossing Bearish ( 50 dropping below the 100
To when the SMA cross Bullish ( 50 rises back above the 100 ) and then to ATH
The Lower day count is from when the 50 crosses above the 100 to when it crosses back below.
And Many things point to the fact that we may well have past the ATH point and are now entering the Bear Market.
Loosing the 50 backs this up to many extents.
So now we look to the 100 to see if PA holds 83K or not.
Interesting to note, that because of how Calmly this "Cycle" has preformed ,, Haw parallel the 50 and 100 are to each other, we are reaching gown to the 100 Much quicker than previous occasions. Very interested to see what happens.
SOPR has just flashed a BEARISH signal
People are capitulating, selling in Fear and making Losses.
A Sure sign of the BEAR.
But there Many things that support the idea that this is NOT the end of this Run to True ATH.
For me, this is helped by the fact that the RSI is so near OVERSOLD that it will RISE.
Not a Guarantee though
But we also have the Weekly MACD down low too
You can see on this chart how the Histogram tends to find support on this level
The MACD line has Crossed below Neutral.
We are in an area for a bounce.
This may not happen and it is impossible to predict this
We need to continue watching and see where the PA goes on that 100 SMA
I have been doing TA for many years now and I have to say, this time, Things are a lot more conveluted than normal..Many conflicting signals....
We have Short Term and Long Term ideas presenting cases for both Bullish and Bearish scenarios.
So, We wait to see what happens on the 100
Look at the Long Term chart and see what happens when the PA crosses the 100 ( Blue )
We need that Bounce for the Bulls
PA Drops below, BEARS
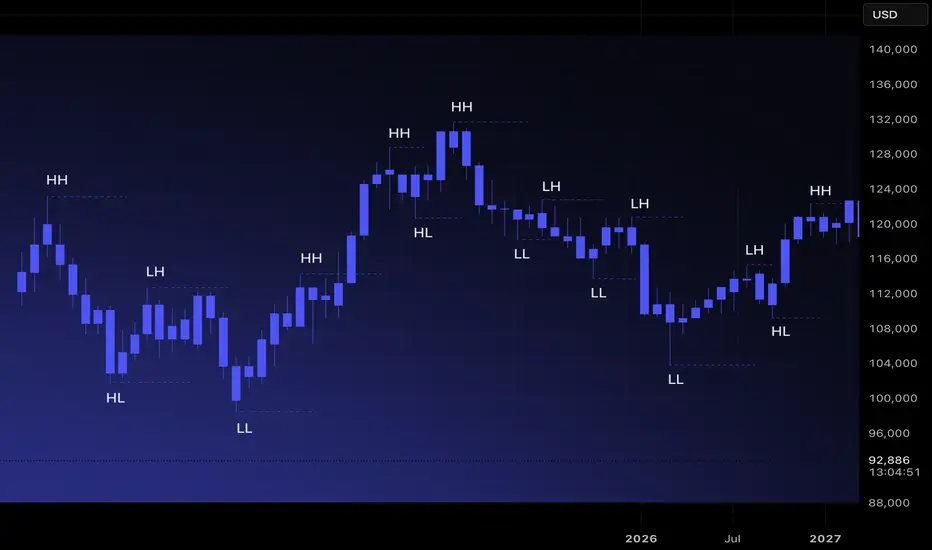
Market Structure 101: Navigating Price ActionMost traders jump directly into indicators, oscillators, or patterns. Yet every chart has a deeper foundation that determines direction long before any tool is applied. Market structure is that foundation. When you understand how price forms highs, lows, and transitions between them, you stop reacting to noise and start reading the market’s intent. It is the base layer that allows you to build a clear, consistent bias.
Price moves because buyers and sellers interact around key levels. Structure highlights where momentum strengthens, weakens, or reverses. By tracking how highs and lows evolve, you can identify trend, consolidation, and shifts in direction with far more clarity than any indicator can offer. Market structure is objective. It gives you a rule-based lens to interpret movement across all timeframes.
Understanding Highs and Lows
There are four structural components every trader must recognize.
Higher High (HH): Price breaks above a previous high, showing buyers in control.
Higher Low (HL): Price pulls back but stays above the prior low, confirming trend continuation.
Lower High (LH): Price rallies but fails to reach previous highs, indicating weakening demand.
Lower Low (LL): Price breaks below the previous low, signaling sellers taking control.
These sequences are the building blocks of trend identification. When mapped correctly, they remove guesswork and reveal underlying momentum.
Identifying Uptrends and Downtrends
Uptrend: A sequence of HHs and HLs. Buyers consistently push price higher and defend higher floors.
Downtrend: A sequence of LHs and LLs. Sellers control direction, rejecting higher prices and driving the market downward.
A trend remains intact until structure breaks. This is why experienced traders avoid predicting reversals and instead follow structural evidence. When the market prints new HHs and HLs, the bias remains long. When LLs and LHs appear, the bias rotates short.
Ranges and Consolidation
Markets do not trend all day. Much of the time, they move sideways. A range occurs when highs and lows stay relatively equal, creating a horizontal zone with equal highs and equal lows. This is where compression happens. Liquidity builds above the range highs and below the range lows, and trend often resumes only after one side of the range is taken.
In ranges, structure becomes neutral. Bias is formed only when price breaks out and retests with confirmation.
Break of Structure(BOS) and Trend Shift
A break of structure occurs when the market violates the pattern of the existing trend. In an uptrend, a break occurs when price prints an LL. In a downtrend, a break occurs when price forms an HH. This signals a potential shift in momentum.
Breaks of structure matter because they identify turning points without relying on subjective signals. They show where one side loses control and the other gains traction. They also create clear invalidation points for risk management.
How to Read Structure Across Timeframes
Market structure becomes even stronger when used across multiple timeframes. The higher timeframe sets the primary bias. The lower timeframe provides entry precision.
Weekly or Daily: Structural trend and major zones.
4H or 1H: Execution windows and key shifts.
15m and 5m: Entry confirmation.
When all levels of structure align, the probability of a clean move increases significantly.
Avoiding Common Mistakes
Many traders misread structure by focusing on every small fluctuation. Structure is defined by meaningful swings, not micro noise. Another common error is assuming a single HH or LL immediately reverses a trend. Context matters. Breaks followed by continuation and retests confirm the shift. A disciplined trader waits for structure to become clear instead of acting on isolated candles.
Turning Structure Into a Bias
Structure simplifies decision-making.
If the market is printing HH and HL formations, you prioritize longs.
If it is printing LH and LL formations, you seek shorts.
If highs and lows are equal, you wait for a breakout.
BTCUSD – Outlook for the Coming MonthMonthly View
The monthly timeframe remains bullish overall, but Bitcoin has pulled back to gather strength. This kind of move is typical when the market is gearing up to break a higher high. The broader structure hasn’t shifted—this is simply a deeper retracement inside a bullish narrative.
Weekly View
The weekly chart is showing a similar story. Price has been dropping consistently without giving even a single proper reversal. If BTC truly wanted to fall aggressively, it would normally make a move up first, trigger traders’ stop-losses near previous highs, and then dump. But this time, it didn’t do that.
This unusual behavior hints that the market may be preparing something different from what most traders expect.
Daily View
The daily timeframe is where things get really interesting. Bitcoin spent more than half the recent sessions moving sideways, collecting liquidity on both sides. After that, it dipped and formed a lower high—but that lower high hasn’t been broken yet.
According to my analysis, BTC is currently sitting in the Discount Zone, an area where buyers often start becoming active.
4-Hour View
On the 4H chart, I already had a clean short setup earlier, but now I’m watching for signs of a potential reversal. That reversal idea is not guaranteed, though—it becomes invalid if BTC fails to break the series of lower highs.
There’s also another scenario: BTC might refuse to break the lower highs and begin forming higher lows at the same time. If that happens, we’ll see a period of sideways consolidation. When the breakout finally comes—whichever direction it chooses—the move is likely to be powerful.
Final Thoughts
Based on my analysis, BTC is showing mixed but promising signals across the higher and lower timeframes. The monthly structure is still bullish, and this pullback looks more like preparation for a stronger push rather than a trend reversal. Weekly price action hasn’t shown any meaningful bounce yet, which is unusual—and that alone hints that the market might be setting up something unexpected.
On the daily chart, BTC has swept liquidity after moving sideways for quite a while, and now it’s resting in the Discount Zone, where smart money usually becomes active. The 4H timeframe already gave clean short opportunities earlier, but now the market is approaching a point where a reversal could begin—unless lower highs remain untouched.
If BTC starts forming higher lows without breaking lower highs, the market will likely slip into a compression phase. When price finally breaks out of that squeeze, the move—up or down—can be very strong.
Again, this is just my personal viewpoint. Please do your own analysis before investing. Your profits and losses are entirely your responsibility—I’m only sharing what the charts are suggesting to me right now. Stay alert to the reaction levels ahead; that’s where the next major direction will reveal itself.
----------------------------------------------------------------------------------------------
Thanks for checking out this analysis! If you enjoyed it, hit that follow button so you don’t miss future updates. And if this breakdown helped you out, drop a like 👍 and share your thoughts in the comments 💬—I always appreciate the feedback!

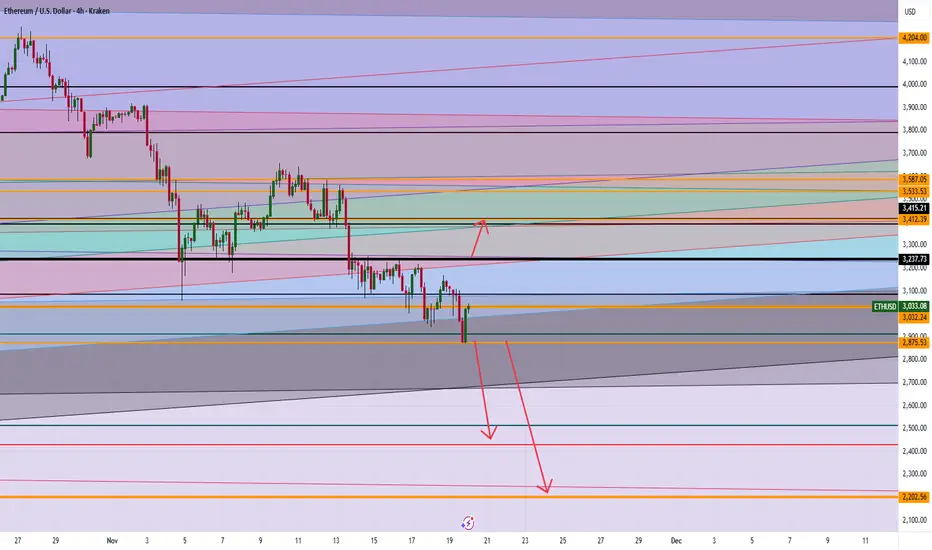
ETH Breakout Levels: Is $3,600 Next or Will Ethereum Crash to $2If ETH holds above 3237, clear momentum targets the 3400 range, with further upside potential toward 3500–3600 if buyers keep control.
A sustained break below 2875 opens the path to 2500, and possibly deeper toward 2200 on heavy selling pressure.
Any questions send me a DM
BTC hitting the Monthly 20EMA supportBTC has touched the Monthly 20EMA (overlayed on this 4H chart) on a huge sell off, should make a strong bounce here or it's off to the pits of hell going into December.

Crypto Is a Zero Growth "Industry"Look at that, after 4 years, failure to fully sustain a new higher market valuation. All the while, stablecoin dominance has increased and ETFs have come into play. Instead, retail money is being extracted through fees and the profits garnered through trader liquidation. That's not a sign of growth. This market is a tool. A tool to take advantage of its participants.
Why did it play out this way? Perhaps it has something to do with the fact that "crypto" is now fully associated with these two things:
1) The absolute buffoonery of the U.S. "leadership."
2) The absolute evil of the oligarchic plutocracy.
And maybe it also has something to do with the lack of substance. What do I mean by this? Well, already over $1 Trillion has been wiped from the cryptocurrency market since its recent peak. In no way has this evaporation in capital affected the economy, or people's lives materially in a meaningful way. Sure, I'm guessing some people lost a lot of money. But these gambling casualties are largely inconsequential to society.
By comparison, if Apple lost $1 Trillion from its current $4 Trillion valuation (a 25% drop), a lot more people's lives would be negatively affected. Not just from the loss in stock value, but what would it mean for the company? What would it mean for the U.S. stock market? What material changes would have to come about for Apple to improve their share value? And, if suddenly we lost all the Gold in the world, we'd have some serious problems in terms of materials and wealth evaporation. Hence the quotes around "industry." Crypto is not an industry at all. It is a market, but a largely illusory one at that.
If Bitcoin and the rest of the crypto market ceased to exist, there would be almost zero long-lasting or significant fallout. It has also failed the store of value narrative.
It probably won't be, but I'm hoping this is the beginning of the end for this market, or at least for its relevance. If I had to make a guess as to how this "end" would play out? A long, slow decline, marked by a few sudden drops when major proponents fold. For instance, Michael Saylor being forced to bail out should price drop meaningfully below $20K. Or pressures to bail out sooner, even.
Anyway, looking at the technicals, it's not very positive. The only saving grace is the possibility of a bounce here at a long term trendline. Breaking below would be another sign of stagnation.
That's it from me, probably for another long while!
Thanks for reading as always.
-Victor Cobra

SOLUSDT - 30M ANALYSISHey traders!
Based on the recent price action, SOL has finished a clean 5-wave impulse down, which usually signals the start of a correction. Right now the structure looks very much like a developing Zig-Zag:
- Wave A has played out,
- Wave B is close to completing,
- and I’m watching for a break of the B-wave resistance to confirm the start of Wave C to the
upside. If that happens, the next target zone sits around 146–150.
However, it’s important to keep the alternative in mind:
Wave B can still form as an expanded flat, meaning price could dip lower and even take out the Wave 5 low before reversing. If that happens, the bullish ABC idea is still possible — it just becomes a deeper setup.
So for now:
Keep an eye on how price behaves around the B resistance level, stay patient for confirmation, and don’t forget your risk management.
This is not financial advice — always DYOR.

Structure trainingHello friends
Well, you see that a spike has been made by the sellers and a bearish structure has formed.
So, be careful that after each spike, the price needs to take a break, so it either suffers or pullbacks, spikes again, and continues.
Now the question is, how do we know when our downtrend is over?
You need to be careful and wait for the weakness of sellers and the strength of buyers, the important signs of which I will tell you.
The first sign is the last spike, which requires our bottom to be broken by sharp sellers and the price to be reversed by sharp buyers. Here it is important that we set a higher ceiling and break this spike formed by sellers, which is also called CHOCH in a correction, which means the same change in structure.
Our second sign is the lower lows, which is also very important and of great importance because it shows the advantage of buyers and helps a lot.
And in the price pullback we can enter the trade with risk and capital management.
Our stop loss is placed below the last low or the last spike that you said and the target is double that R/R=2
*The win rate of this strategy is also 60*
*Trade safely with us*

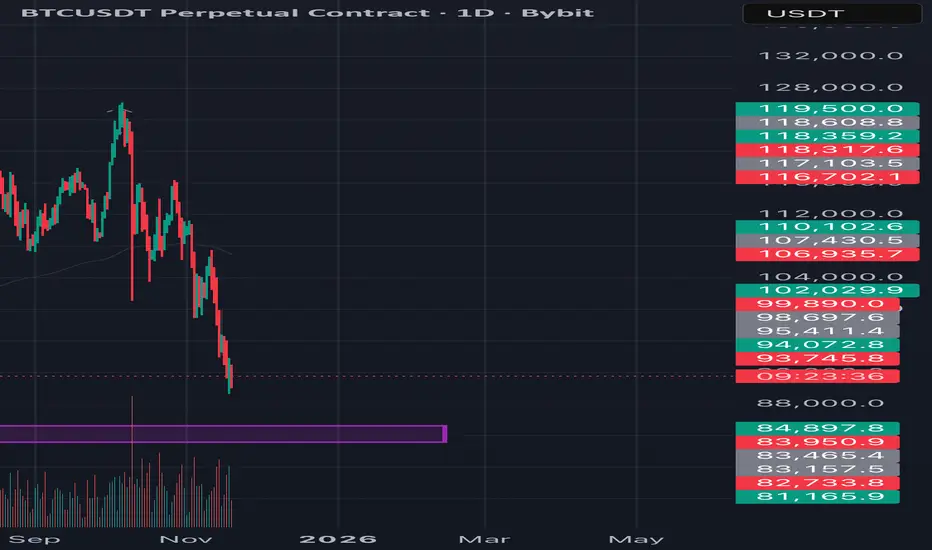
TradeCityPro | Bitcoin Daily Analysis #225👋 Welcome to TradeCity Pro!
Let’s jump into today’s Bitcoin analysis. After the pullback to 93,555, Bitcoin has moved into a ranging phase.
⌛️ 1-Hour Timeframe
Yesterday, after reaching its support zone, Bitcoin made a corrective upward move and pulled back to 93,555.
💡 Right now, after completing that pullback, the price has dropped back down to 90,489 and has shown a reaction to this level.
✔️ As you can see, selling volume has been increasing during this move, and we haven’t seen any significant buying volume enter the market yet.
✨ Today’s trigger for opening a position is the break of 90,489.This is a suitable trigger for a short position, and breaking it could be the start of the next bearish leg.
⭐ If the move toward 90,489 comes with increasing volume, we can even enter earlier using a candle setup, before the full break happens.
📊 For a long position, it’s still too early.We first need to see the price stabilize above 93,555, and only then we can look for long triggers.
❌ Disclaimer ❌
Trading futures is highly risky and dangerous. If you're not an expert, these triggers may not be suitable for you. You should first learn risk and capital management. You can also use the educational content from this channel.
Finally, these triggers reflect my personal opinions on price action, and the market may move completely against this analysis. So, do your own research before opening any position.

BTC DAILY KEY LEVEL APPROACHING BTC has been on a down trend for a while now and is currently approaching a daily demand zone which is the zone that caused the break of structure of the previous high on the daily time frame. So let wait for price to Tap into the zone and see if buyers will eventually kick in or probably break below it to continue the downtrend. Let wait for clear confirmation.
BITCOIN (BTC) — THE FALL HAS ONLY JUST BEGUN⚠️ THE GREAT BITCOIN REVERSAL — THE STORM NO ONE IS READY FOR ⚠️
For years, Bitcoin INDEX:BTCUSD climbed with the arrogance of a king convinced its throne was eternal.
But every empire falls.
And the chart…
The chart has been whispering the truth long before anyone wanted to hear it.
Today, that whisper has become a SCREAM. 📉⚡
🔥 1. The Final Wave Has Broken — and So Has the Illusion
The macro Wave 5 top is in.
Perfect confluence.
Perfect exhaustion.
Perfect euphoria.
The same pattern that ended EVERY Bitcoin mega-cycle… just printed again.
This wasn’t a top.
It was THE top.
The moment the bull cycle let out its final breath. 💀📈
🩸 2. Smart Money Has Already Left the Building
While retail celebrated “new highs,” Smart Money carved out:
• Stop hunts
• Liquidity grabs
• Breaker blocks
• Distribution ranges
• A devastating SOW
• And the cleanest market structure break BTC has shown since 2018
Institutions aren’t buying dips.
They are offloading the mountain .
The crowd doesn’t see it — yet.
⚡ 3. A Market Structure Collapse Echoing 2014, 2018 and 2021
Each cycle’s death began the same way:
A gentle pullback…
A sudden rejection…
Then a violent swing failure ,
followed by the HTF structure snapping in half.
That exact sequence is happening right now .
This is not a correction.
This is a cycle reset .
🎯 4. Fibonacci Retracements Don’t Lie — They Warn
Every true macro Wave 2 in history has returned to:
🔻 0.786
🔻 0.886
🔻 1.0 – 1.618 extensions
Where do they converge this time?
👇
🔮 $6,000 – $1,250
The forgotten land of 2017 mania…
A level BTC has avoided for 8 years.
But the cycle demands balance.
And balance always returns.
🌪️ 5. Price Action Has Flipped From Confidence to Panic
The candles have changed character:
• Weak closes
• Long tall wicks of rejection
• Failed rallies
• Imbalances breaking lower
• Bull traps everywhere
• A violent displacement to the downside
This isn’t cooling off.
This is unwinding.
📉 6. Market Cycle Psychology Has Entered Its Darkest Phase
We just exited Euphoria.
We are in Complacency.
Next comes:
😨 Anxiety
😱 Fear
💀 Capitulation
🔥 Anger
🌑 Depression
Only after that does a new accumulation begin.
And that’s why Wave 2 is infamous.
It destroys what Wave 1 built.
🚨 THE VERDICT: THE DOWNFALL IS IN MOTION — AND WE ARE EARLY
From $126K to $90K was not the crash.
It was merely the first spark in a forest full of dry leaves.
Wave A has barely begun.
Wave B will deceive.
Wave C will devastate.
The endgame target remains:
🎯 $1,250 – $6,000
The cycle reset.
The cleanse.
The opportunity of the decade — but only after the fire burns everything above it.
🔥 This is not fear. This is structure, math, psychology, liquidity, and time itself.
And all of them point in the same direction. Down, Down And Down
🔥 Follow this idea to stay ahead of the next macro move.
📈 We’ll update the chart as the structure unfolds — Wave A, Wave B trap, and the full Wave C capitulation zone.
💬 Drop your thoughts below — agree or disagree, the chart will decide.
🚀 Turn on notifications so you don’t miss the next critical breakdown.
⚠️ DISCLAIMER: This analysis is for educational and informational purposes only.
Not financial advice. Always manage risk and make decisions based on your own research and personal strategy.
#Bitcoin #BTC #Crypto #CryptoAnalysis #TradingView #BTCUSD #BearMarket #ElliottWave #SmartMoney #PriceAction #MarketCycle #Fibonacci #TechnicalAnalysis #CryptoCrash #CryptoWarning

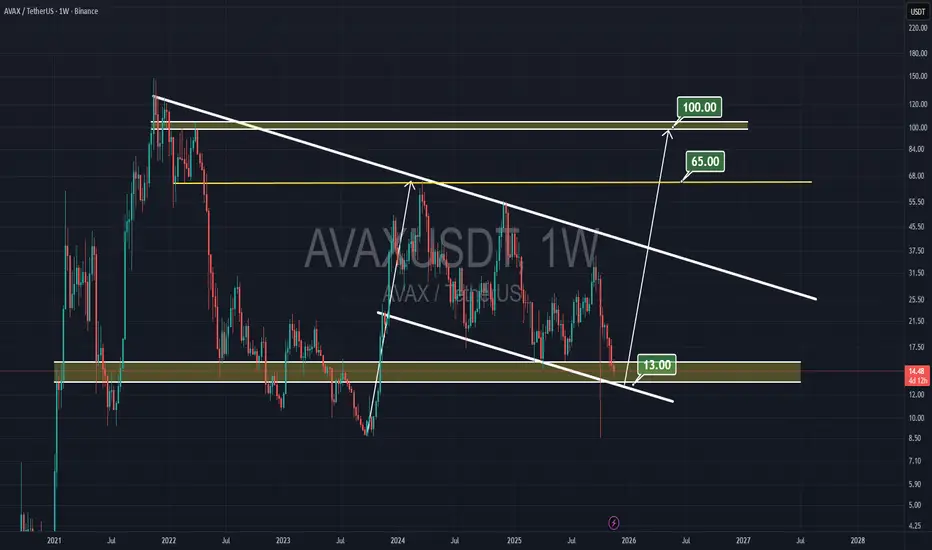
AVAX to rally againAVAX is at a very low level, it can hold support here and rally over the next few months to around $100.
NEAR posed for a break outI'm buying CRYPTOCAP:NEAR here
> At the bottom of the range
> NVIDIA earnings today - if the earnings will be good, AI coins will be the first to pump
> Seeing lots of positive content on the timeline
Rejected 4 times on the resistance, 5th time we break out.

Bitcoin Outlook -A Potential ABC Correction Toward the $50K ZoneAs 2025 nears its end, the cryptocurrency market sits at a crossroad. After two years of robust performance, there are early indications that a bear market may be approaching.
Bitcoin ABC Downturns
Historically, Bitcoin downturns tend to unfold in an ABC corrective pattern. If this cycle has indeed peaked, BTC price appears to be moving through the initial A-wave decline. After that leg completes, a rebound in the form of wave B could lift prices back toward the $100,000 area. The final C-wave would then likely drive the market lower, potentially into the $45,000–$50,000 zone.

$SOL reboundCRYPTOCAP:SOL looking bullish after a bullish bounce on a strong key support level. I see a continuation up to $152

BITCOIN BIG HIGH BUY PROBABILITY SETUP SOON!!!🚨 BITCOIN HIGH PROBABILITY BUY SETUP 🚨
* Here We Can See Clearly The Next Potential Moves For BTCUSD Coming Hours/Days.
* Keep Your Eyes Close On Your Trading Positions.
* Happy PIP Hunting Traders.
FXKILLA.
