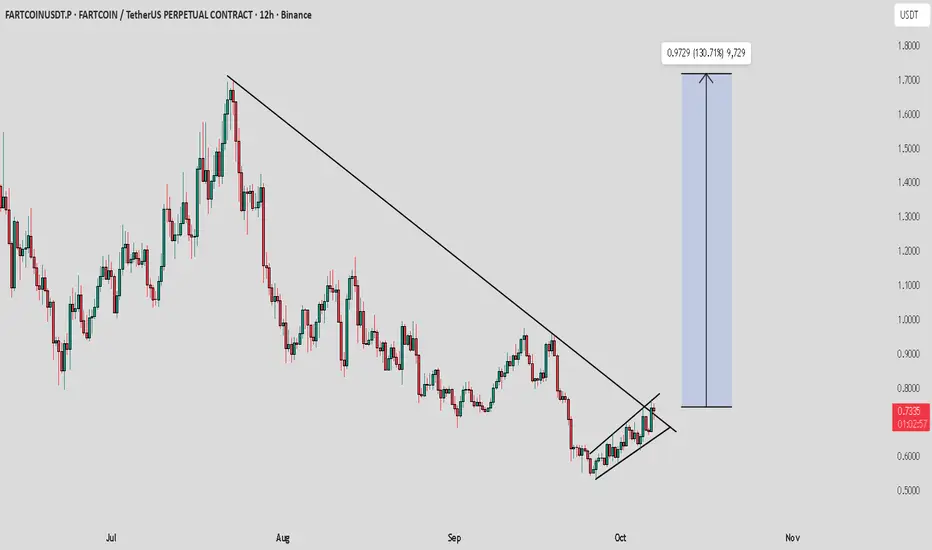
FARTCOIN / USDT : Breaking out with good momentumFARTCOIN is breaking out from trend line resistance and showing improving momentum. If this breakout holds, we can expect a bullish rally towards $1.0 – $1.3 – $1.5 in the short term.
Always wait for confirmation and manage risk wisely.
Cryptomarket
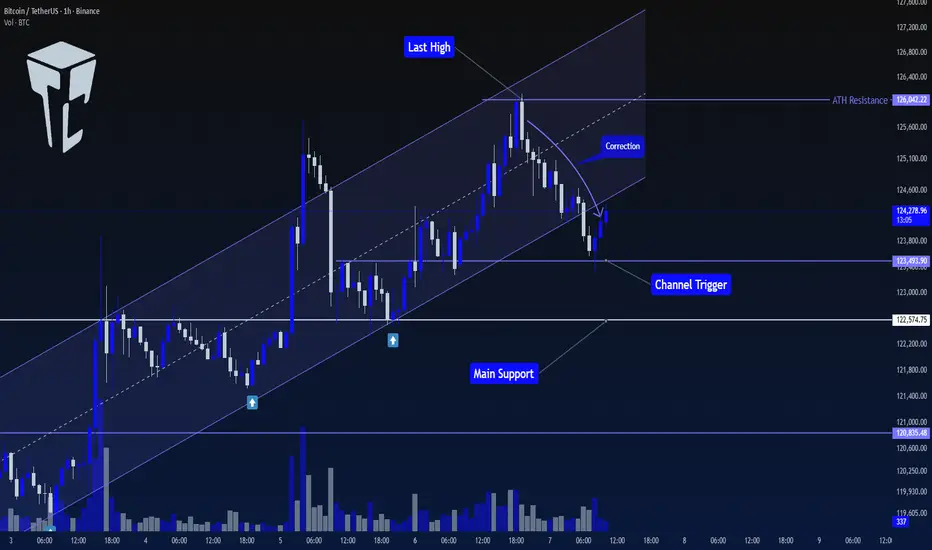
TradeCityPro | Bitcoin Daily Analysis #189👋 Welcome to TradeCity Pro!
Let’s move on to the Bitcoin analysis. Yesterday, after setting a new ATH, Bitcoin began its correction — let’s review the market together.
⏳ 1-Hour Timeframe
On the 1-hour timeframe, Bitcoin had been moving inside an ascending channel that had provided multiple supports. However, after being rejected from 126042, the price experienced a downward move and broke the channel to the downside.
⭐ The channel breakout trigger is at 123493, where the price has already reacted once, and it’s now moving slightly upward with very low volume.
📊 If this low-volume bullish movement continues, the likelihood of trigger activation will increase, and in that case, the price could move toward 122574.
🔍 For now, none of these triggers are suitable for short positions, as the market still looks too bullish to consider shorting.
✨ For long positions, the current trigger is 126042. However, if the market consolidates longer and forms a new structure, we might find an opportunity to enter earlier.
❌ Disclaimer ❌
Trading futures is highly risky and dangerous. If you're not an expert, these triggers may not be suitable for you. You should first learn risk and capital management. You can also use the educational content from this channel.
Finally, these triggers reflect my personal opinions on price action, and the market may move completely against this analysis. So, do your own research before opening any position.
BUFFALO | $ARKM is going goodOverall, the monthly timeframe of ARKM is showing a clear compression phase, characterized by large-volume doji candles — a sign that strong accumulation is taking place at current levels. After an extended downtrend, the current price structure indicates that selling pressure is weakening, while buying interest is gradually stepping in around key support zones. From a technical standpoint, this is shaping up to be a solid base-building phase, potentially setting the stage for a new bullish cycle once broader market conditions stabilize.
I’ll be keeping a close watch on ARKM in the coming weeks, as a clean breakout from this consolidation range could offer a significant trading opportunity. My plan is to enter around 0.55x, with DCA entries down to 0.4 if further retracement occurs. The target levels are set sequentially at 0.82, 1.00, 1.18, 1.38, 1.78, and 2.39, aligning with major technical resistance zones and potential profit-taking areas along the upward trajectory. Overall, ARKM remains one of the coins I’m watching most closely for the upcoming quarter.
Swing Trading Plan:
Entry: 0.55x - 0.4
SL: 0.3
Tp: 0.8 - 1.1 - 1.3 - 1.75
Drop a comment here if you have the same opinion :)

BTCUSD: Sideways market plan🔁 Review of Yesterday’s Plan
Yesterday, we had two breakout trading plans for BITSTAMP:BTCUSD :
IRB (Inside Range Break)
Price moved exactly as projected.
Trade reached a profit of 2R – 2.5R, depending on individual target exits.
RB/ARB (Range Break / Advance Range Break)
Price reached the top boundary of the range and formed a bullish breakout candle,
but was immediately followed by a strong bearish candle pulling back into the range.
This was a clear False Breakout → No trade was taken, waiting instead for the next clear setup.
📈 Market Outlook for Today
BITSTAMP:BTCUSD has now moved back inside the larger range (125,710 – 122,383), showing that the market is currently sideways within a wide range.
The most recent candle closed below the EMA, indicating no clear signal for continuation trades yet.
🧭 Trading Plan for Today
Wait for a new compression setup to form before entering.
If price consolidates and compresses near the upper boundary of the range, prepare to Buy once confirmation appears.
If price continues to drop toward the lower boundary of the range, consider Sell setups, depending on how price reacts to support.
🎯 Summary:
BTC is currently in an accumulation (sideway) phase.
Be patient and wait for a valid breakout setup before taking action — avoid chasing the market and focus on trading only when momentum and confirmation align.
You can refer to my previous analysis here:
Please like and comment below to support our traders. Your reactions motivate us to do more analysis in the future 🙏✨
Daniel Miller @ ZuperView

TradeCityPro | PENDLE: Near Breakout From Descending Trendline👋 Welcome to TradeCity Pro!
In this analysis, I want to review the PENDLE coin for you — one of the projects in the Ethereum ecosystem, currently ranked 93rd on CoinMarketCap with a market cap of $858.76 million.
📅 Daily Timeframe
On the daily timeframe, this coin has formed two trendlines. The main trendline is the long-term ascending trendline that the price has respected for a long time, while the second is a continuation descending trendline — if broken, the previous bullish move can resume.
✨ Since the overall trend is bullish, the continuation trendline is currently more important for us, because breaking it would confirm the continuation of the uptrend.
🔍 This trendline formed after the price reached the 5.732 level and made a fake breakout.
📊 The breakout trigger for this trendline is currently at 5.344. Breaking this level can provide an opportunity to open a long position on PENDLE.
🛒 For spot purchases, this same 5.344 trigger can be used, but the 5.732 level would be a much safer confirmation for a spot entry.
✅ The main confirmation of bullish continuation in higher cycles will come after breaking 6.857.
🎲 It’s important to note that any bullish breakout must be accompanied by an increase in volume, otherwise the move could easily turn out to be fake.
⚡️ If the ascending trendline breaks, the trigger for this breakdown is at 4.431. Breaking this level is not an ideal short trigger, but if the price stabilizes below it, you can consider activating your stop-loss in case you’ve already bought the coin in spot.
🧩 The next support levels in case of further decline are 3.741 and 3.017.The momentum trigger on the RSI is at 39.16.
📝 Final Thoughts
Stay calm, trade wisely, and let's capture the market's best opportunities!
This analysis reflects our opinions and is not financial advice.
Share your thoughts in the comments, and don’t forget to share this analysis with your friends! ❤️

SOLUSD H4 | Could we see a bearish reversal from here?Based on the H4 chart analysis, we can see the price reacting off the sell entry which is a pullback resistance that aligns with the 78.6% Fibonacci retracement and could reverse from this levle to the take profit.
Sell entry is at 238.31, which is a pullback resistance that aligns with the 78.6% Fibonacci retracement.
Stop loss is at 253.39, which is a swing high resistance.
Take profit is at 216.84, which is a pullback support that is slightly below the 38.2% Fibonacci retracement.
High Risk Investment Warning
Trading Forex/CFDs on margin carries a high level of risk and may not be suitable for all investors. Leverage can work against you.
Stratos Markets Limited (tradu.com ):
CFDs are complex instruments and come with a high risk of losing money rapidly due to leverage. 65% of retail investor accounts lose money when trading CFDs with this provider. You should consider whether you understand how CFDs work and whether you can afford to take the high risk of losing your money.
Stratos Europe Ltd (tradu.com ):
CFDs are complex instruments and come with a high risk of losing money rapidly due to leverage. 66% of retail investor accounts lose money when trading CFDs with this provider. You should consider whether you understand how CFDs work and whether you can afford to take the high risk of losing your money.
Stratos Global LLC (tradu.com ):
Losses can exceed deposits.
Please be advised that the information presented on TradingView is provided to Tradu (‘Company’, ‘we’) by a third-party provider (‘TFA Global Pte Ltd’). Please be reminded that you are solely responsible for the trading decisions on your account. There is a very high degree of risk involved in trading. Any information and/or content is intended entirely for research, educational and informational purposes only and does not constitute investment or consultation advice or investment strategy. The information is not tailored to the investment needs of any specific person and therefore does not involve a consideration of any of the investment objectives, financial situation or needs of any viewer that may receive it. Kindly also note that past performance is not a reliable indicator of future results. Actual results may differ materially from those anticipated in forward-looking or past performance statements. We assume no liability as to the accuracy or completeness of any of the information and/or content provided herein and the Company cannot be held responsible for any omission, mistake nor for any loss or damage including without limitation to any loss of profit which may arise from reliance on any information supplied by TFA Global Pte Ltd.
The speaker(s) is neither an employee, agent nor representative of Tradu and is therefore acting independently. The opinions given are their own, constitute general market commentary, and do not constitute the opinion or advice of Tradu or any form of personal or investment advice. Tradu neither endorses nor guarantees offerings of third-party speakers, nor is Tradu responsible for the content, veracity or opinions of third-party speakers, presenters or participants.

DOGEUSD H4 | Bullish Bounce from SupportBased on the H4 chart analysis, we could see the price fall to the buy entry, which is a pullback support that is slightly below the 23.6% Fibonacci retracement and could bounce from this level to the upside.
Buy entry is at 0.25444, which is a pullback support that is slightly below the 23.6% Fibonacci retracement.
Stop loss is at 0.23819, which is a pullback support that aligns with the 61.8% Fibonacci retracement.
Take profit is at 0.28459, which is a swing high resistance.
High Risk Investment Warning
Trading Forex/CFDs on margin carries a high level of risk and may not be suitable for all investors. Leverage can work against you.
Stratos Markets Limited (tradu.com ):
CFDs are complex instruments and come with a high risk of losing money rapidly due to leverage. 65% of retail investor accounts lose money when trading CFDs with this provider. You should consider whether you understand how CFDs work and whether you can afford to take the high risk of losing your money.
Stratos Europe Ltd (tradu.com ):
CFDs are complex instruments and come with a high risk of losing money rapidly due to leverage. 66% of retail investor accounts lose money when trading CFDs with this provider. You should consider whether you understand how CFDs work and whether you can afford to take the high risk of losing your money.
Stratos Global LLC (tradu.com ):
Losses can exceed deposits.
Please be advised that the information presented on TradingView is provided to Tradu (‘Company’, ‘we’) by a third-party provider (‘TFA Global Pte Ltd’). Please be reminded that you are solely responsible for the trading decisions on your account. There is a very high degree of risk involved in trading. Any information and/or content is intended entirely for research, educational and informational purposes only and does not constitute investment or consultation advice or investment strategy. The information is not tailored to the investment needs of any specific person and therefore does not involve a consideration of any of the investment objectives, financial situation or needs of any viewer that may receive it. Kindly also note that past performance is not a reliable indicator of future results. Actual results may differ materially from those anticipated in forward-looking or past performance statements. We assume no liability as to the accuracy or completeness of any of the information and/or content provided herein and the Company cannot be held responsible for any omission, mistake nor for any loss or damage including without limitation to any loss of profit which may arise from reliance on any information supplied by TFA Global Pte Ltd.
The speaker(s) is neither an employee, agent nor representative of Tradu and is therefore acting independently. The opinions given are their own, constitute general market commentary, and do not constitute the opinion or advice of Tradu or any form of personal or investment advice. Tradu neither endorses nor guarantees offerings of third-party speakers, nor is Tradu responsible for the content, veracity or opinions of third-party speakers, presenters or participants.

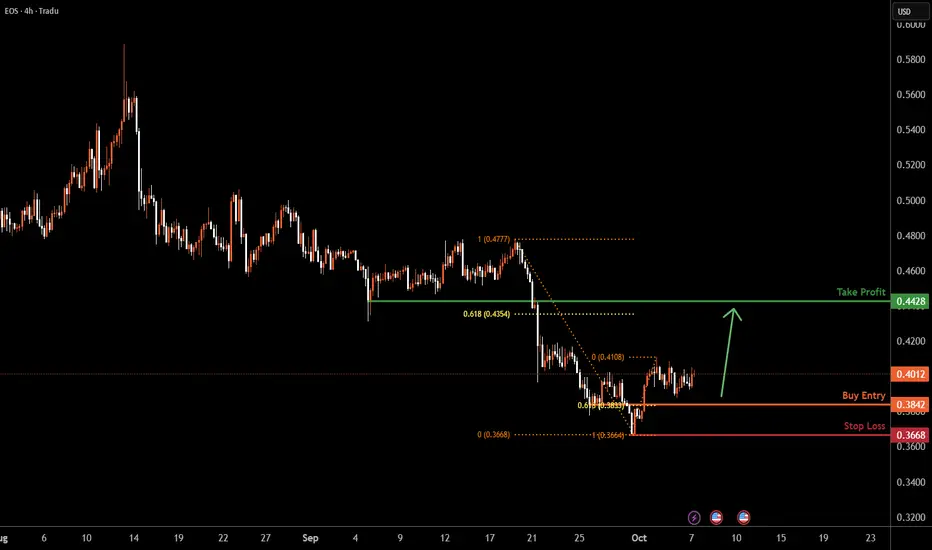
EOSUSD H4 | Potential Bullish Reversal FormingEOSUSD is falling towards the buy entry, which is a pullback support that aligns with the 61.8% Fibonacci retracement and could bounce from this level to the upside.
Buy entry is at 0.3842, which is a pullback support that aligns with the 61.8% Fibonacci retracement.
Stop loss is at 0.3668, which is a pullback support.
Take profit is at 0.4428, which is a pullback resistance that is slightly above the 61.8% Fibonacci retracement.
High Risk Investment Warning
Trading Forex/CFDs on margin carries a high level of risk and may not be suitable for all investors. Leverage can work against you.
Stratos Markets Limited (tradu.com ):
CFDs are complex instruments and come with a high risk of losing money rapidly due to leverage. 65% of retail investor accounts lose money when trading CFDs with this provider. You should consider whether you understand how CFDs work and whether you can afford to take the high risk of losing your money.
Stratos Europe Ltd (tradu.com ):
CFDs are complex instruments and come with a high risk of losing money rapidly due to leverage. 66% of retail investor accounts lose money when trading CFDs with this provider. You should consider whether you understand how CFDs work and whether you can afford to take the high risk of losing your money.
Stratos Global LLC (tradu.com ):
Losses can exceed deposits.
Please be advised that the information presented on TradingView is provided to Tradu (‘Company’, ‘we’) by a third-party provider (‘TFA Global Pte Ltd’). Please be reminded that you are solely responsible for the trading decisions on your account. There is a very high degree of risk involved in trading. Any information and/or content is intended entirely for research, educational and informational purposes only and does not constitute investment or consultation advice or investment strategy. The information is not tailored to the investment needs of any specific person and therefore does not involve a consideration of any of the investment objectives, financial situation or needs of any viewer that may receive it. Kindly also note that past performance is not a reliable indicator of future results. Actual results may differ materially from those anticipated in forward-looking or past performance statements. We assume no liability as to the accuracy or completeness of any of the information and/or content provided herein and the Company cannot be held responsible for any omission, mistake nor for any loss or damage including without limitation to any loss of profit which may arise from reliance on any information supplied by TFA Global Pte Ltd.
The speaker(s) is neither an employee, agent nor representative of Tradu and is therefore acting independently. The opinions given are their own, constitute general market commentary, and do not constitute the opinion or advice of Tradu or any form of personal or investment advice. Tradu neither endorses nor guarantees offerings of third-party speakers, nor is Tradu responsible for the content, veracity or opinions of third-party speakers, presenters or participants.
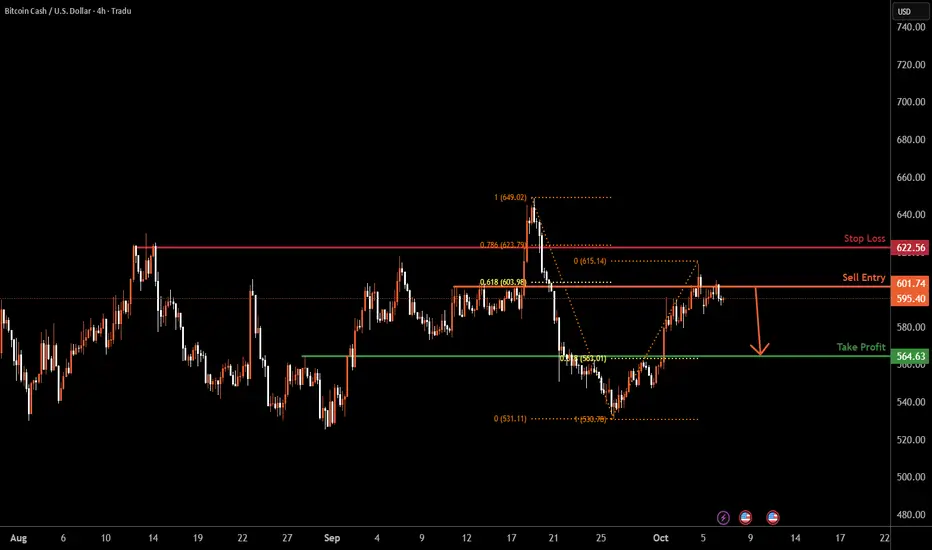
BCHUSD H4 | Bearish reversal from 61.8% Fibonacci resistanceBCH/USD has rejected off the sell entry, which is a pullback resistance that aligns with the 61.8% Fibonacci retracement and could drop from this level to the downside.
Sell entry is at 601.74, which is a pullback resistance that aligns with the 61.8% Fibonacci retracement.
Stop loss is at 643.95, which is a pullback resistance that aligns with the 78.6% Fibonacci retracement.
Take profit is at 564.63, which is a pullback support that aligns with the 61.8% Fibonacci retracement.
High Risk Investment Warning
Trading Forex/CFDs on margin carries a high level of risk and may not be suitable for all investors. Leverage can work against you.
Stratos Markets Limited (tradu.com ):
CFDs are complex instruments and come with a high risk of losing money rapidly due to leverage. 65% of retail investor accounts lose money when trading CFDs with this provider. You should consider whether you understand how CFDs work and whether you can afford to take the high risk of losing your money.
Stratos Europe Ltd (tradu.com ):
CFDs are complex instruments and come with a high risk of losing money rapidly due to leverage. 66% of retail investor accounts lose money when trading CFDs with this provider. You should consider whether you understand how CFDs work and whether you can afford to take the high risk of losing your money.
Stratos Global LLC (tradu.com ):
Losses can exceed deposits.
Please be advised that the information presented on TradingView is provided to Tradu (‘Company’, ‘we’) by a third-party provider (‘TFA Global Pte Ltd’). Please be reminded that you are solely responsible for the trading decisions on your account. There is a very high degree of risk involved in trading. Any information and/or content is intended entirely for research, educational and informational purposes only and does not constitute investment or consultation advice or investment strategy. The information is not tailored to the investment needs of any specific person and therefore does not involve a consideration of any of the investment objectives, financial situation or needs of any viewer that may receive it. Kindly also note that past performance is not a reliable indicator of future results. Actual results may differ materially from those anticipated in forward-looking or past performance statements. We assume no liability as to the accuracy or completeness of any of the information and/or content provided herein and the Company cannot be held responsible for any omission, mistake nor for any loss or damage including without limitation to any loss of profit which may arise from reliance on any information supplied by TFA Global Pte Ltd.
The speaker(s) is neither an employee, agent nor representative of Tradu and is therefore acting independently. The opinions given are their own, constitute general market commentary, and do not constitute the opinion or advice of Tradu or any form of personal or investment advice. Tradu neither endorses nor guarantees offerings of third-party speakers, nor is Tradu responsible for the content, veracity or opinions of third-party speakers, presenters or participants.
Aleo 1D Analysishere is an analysis for $Aleo on daily TF. It is breaking out long term daily resistance. We can expect the targets marked on chart. NFA DYOR

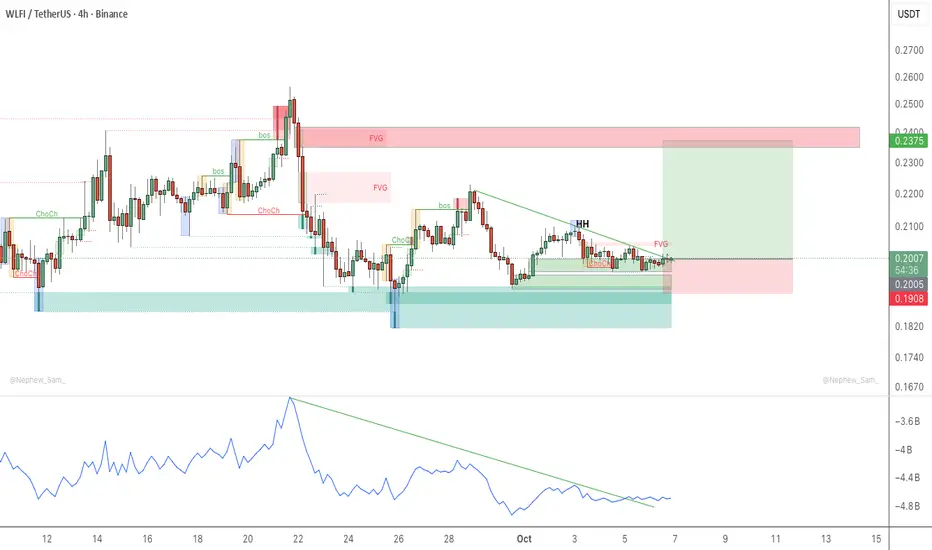
WLFI Long 3x Leverage longing WLFI. OBV breakout and entry in FVG. Targeting FVG above as shown on image. Think this can move soon and good risk/reward.
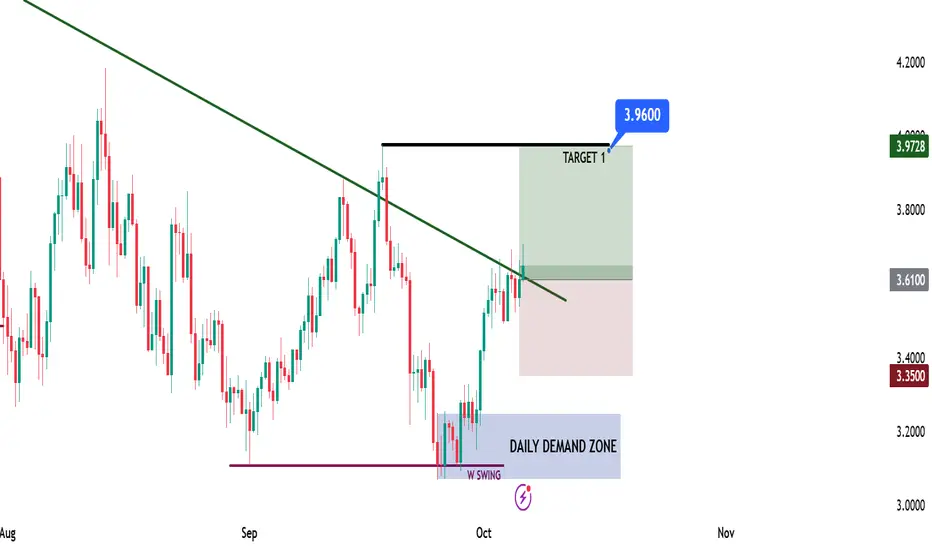
SUI Long Opportunity – DTB ModelSUI Long Opportunity – DTB Model
📊 Market Sentiment
FED has resumed its rate-cutting cycle with a 0.25% cut in September and two more expected. Institutional liquidity inflows are accelerating as the U.S. officially adopts crypto as part of its reserves. Despite persistent inflation, a weakening labor market is forcing the FED to ease, driving capital into risk-on assets like crypto.
📈 Technical Analysis
Price remains in a strong HTF bullish trend, so I’ll only be looking for long setups.
After running HTF swing liquidity, price broke structure and created a daily demand zone. The first tap to this zone generated a solid rejection, confirming its validity.
Recently, price closed above the LTF bearish trendline — signaling potential continuation for the next bullish leg.
📘 Model to be used – Demand Bounce to Trendline Break (DTB Model)
1-Identify the HTF trend and trade only in that direction.
2-Wait for a strong bounce from a confirmed demand zone.
3-Look for a break of the lower time frame bearish trendline.
4-Enter on breakout confirmation after two consecutive body closes.
📌 Game Plan
Position entered after 4H trendline break confirmation (two body closes above). Entry taken around $3.61, aligning with HTF bullish bias and demand confluence.
🎯 Setup Trigger
4H body close confirmation above bearish trendline.
📋 Trade Management
Entry: $3.61
Stoploss: $3.35
Target: $3.96
💬 Like, follow, and comment if this breakdown supports your trading! More setups and insights coming soon — stay connected!
⚠️ Disclaimer: This content is for informational and educational purposes only and does not constitute financial, investment, or trading advice. Always DYOR before making any financial decisions.
BTC “Blow-off” confirmed, what’s next?Newest chart (H&S with RS near 118.7k, high 124.5k, supports 110.9k / 108.7k / 95.1k / 96.5k / 77.3–74.5k) shows we did get the blow-off extension I had at 13%. We now re-weight the next path conditional on a completed blow-off.
🎯 Short to $73K — plan, gates, and guardrails
It’s feasible only after losing: $110.9K → $108.7K → $103–101K → $96–95K
Risk guardrails (objective invalidations) 🚧
Primary invalidation: Daily close > 118.7K (your RS/supply).
Hard invalidation: Momentum HH > 120.5K and sustained bid above; expect squeeze back to 123–125K.
Trailing logic:
After 110.9K breaks → trail to entry.
After 108.7K breaks → trail to 111.0–111.5K.
After 101K breaks → trail to 105–106K.
After 95K breaks → trail to 99–100K.
Position management 🔧
Scale targets: 108.7K, 103–101K, 96–95K, 90–88K, 83–78K, 75–73K.
What would help the $73K path 📉
Clean acceptance below 95K (no immediate reclaim).
ETF flow cool-off (you’ve been tracking this) + weak spot bid during futures-led dumps.
CME term structure flattening/inversion into breakdowns.
OBV / CVD making lower lows as price ranges (distribution tells).
What would hurt it 📈
Swift 118.7K reclaim on strong spot-led buying.
Persistent positive ETF net inflows on down days.
Perp funding resetting positive while price refuses to break 108.7K.
Aligned with the post–blow-off distribution thesis. Hold the short only as long as 118.7K isn’t reclaimed and the market accepts below 110.9K → 108.7K. The hinge zone is 96–95K; lose it cleanly and $83–78K → $75–73K opens up. Manage via staged profits and a rising trailing stop so the trade can breathe on the way to $73K objective.

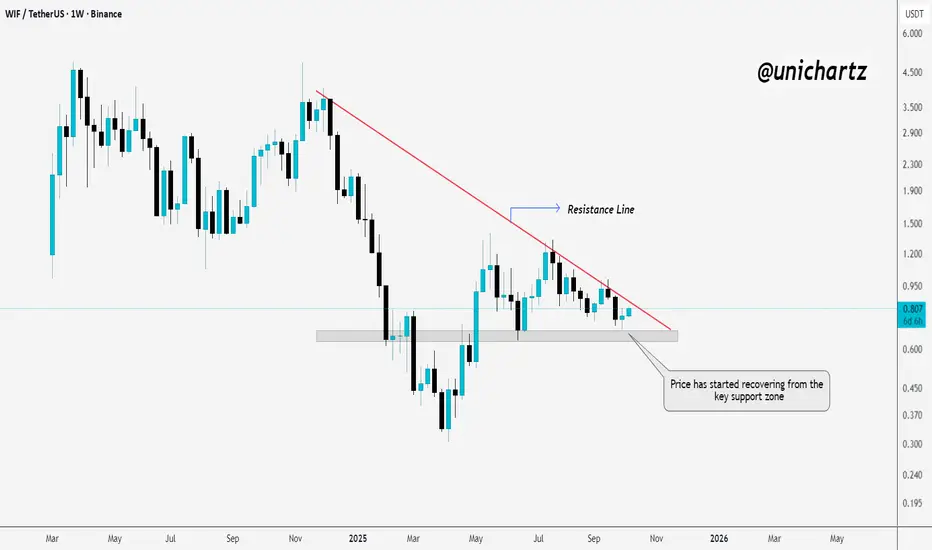
WIF Weekly Reversal SetupSEED_WANDERIN_JIMZIP900:WIF is showing early signs of strength after bouncing from the key support zone.
A breakout above the descending resistance line could confirm a fresh bullish wave.
DYOR, NFA
#PEACE
TOTAL2 & ETH – On the Edge of Price DiscoveryTOTAL2 & ETH – The Next in Line for Price Discovery
Today, TOTAL2 has officially broken above its previous all-time high, while ETH is still just below it, getting closer with each daily candle.
This tells an interesting story: altcoins as a whole have already entered price discovery, but ETH being the largest component of TOTAL2, hasn’t quite joined yet. This usually means one of two things: either smaller-cap altcoins are currently outperforming ETH, or ETH is simply building strength for a delayed breakout, a move that often pulls the entire market even higher once it happens.
Still, confirmation matters: TOTAL2 needs a daily close above its ATH, while ETH’s reaction around its own ATH in the coming days will likely decide whether it joins the move.
And let’s not forget: we’ve just entered Q4, and this one might be the strongest Q4 the crypto market has ever seen. Everything that once stood against crypto, from regulation to sentiment, is now turning in its favour, across the US, Asia, and even Europe.
That’s why I believe ETH will soon follow TOTAL2 into price discovery, potentially marking the start of the next major leg up for the entire market.
Bias:
Bullish! TOTAL2 confirmed breakout, ETH close behind. Q4 momentum could be the catalyst that sends both into new territory.
Always take profits and manage risk.
Interaction is welcome.

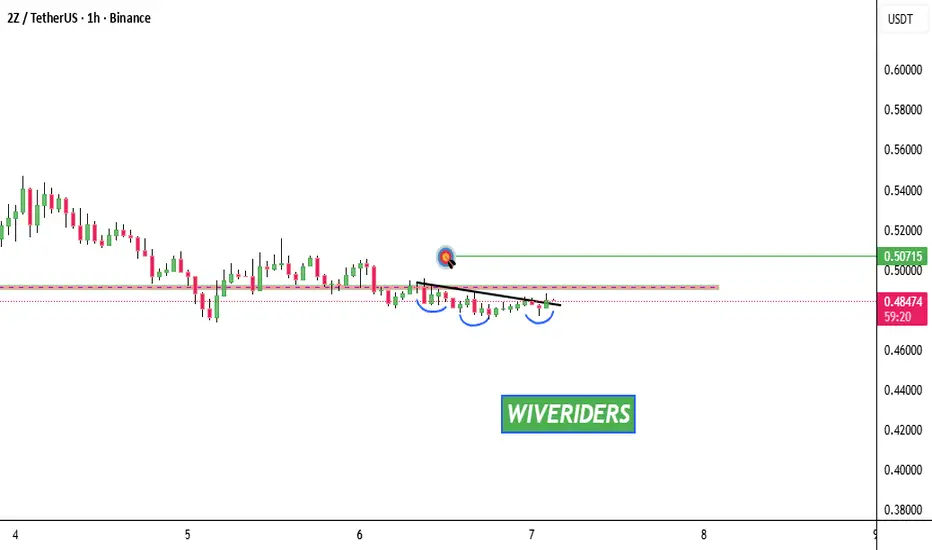
2Z Update📊 $2Z Update
$2Z is testing the red resistance zone 🔴
If it breaks out, the first target will be the green line level ✅
LINK Update📊 LINK Update
LINK has formed a bullish double bottom pattern and successfully reached the first target ✅
Now we’re waiting for the second target at the green line level 🚀

$TAO Update📊 GETTEX:TAO Update
GETTEX:TAO has successfully broken out of the red resistance zone ✅
If the price keeps pushing up, the next target is the green line level 🚀

ETHUSD Breaks The Channel, Pointing Above 5kEthereum has been rising sharply over the last two weeks after only a three-wave retracement from all-time highs, so it looks like a textbook fourth-wave pullback within an incomplete bullish structure that is now ready to resume. We’re seeing a break and push beyond the upper line of the corrective channel, suggesting price is stepping into wave five, so more upside can show up in the weeks ahead.
Ideally, price could rise beyond 5000, possibly even toward 5336, where wave five could match the distance of wave two.
When it comes to potential trading setups, it may be interesting to watch for intraday retracements, especially if we see one while the market still trades below wave three highs. Then, opportunities could show up around the 4350–4500 support area.
GH

TRUTH / USDT : Keep a close watch on breakoutTRUTH is approaching trend line resistance with strong potential. A confirmed breakout from this level could trigger a 15–20% bullish move in the short term.
Keep a close watch and always enter only after clear confirmation. Manage risk properly.

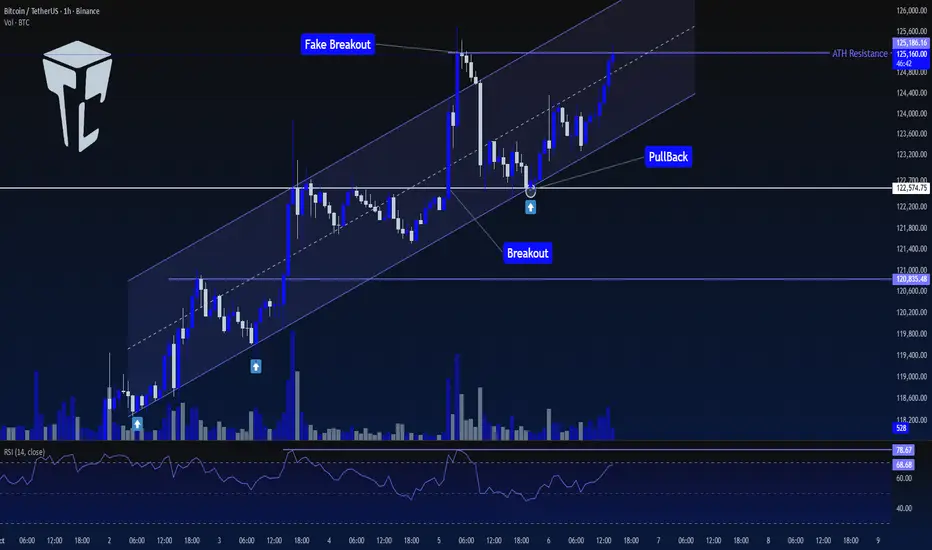
TradeCityPro | Bitcoin Daily Analysis #188👋 Welcome to TradeCity Pro!
Let’s move on to the Bitcoin analysis. Today, after pulling back to its previous resistance, Bitcoin is ready to start its next move.
⏳ 1-Hour Timeframe
On the 1-hour timeframe, Bitcoin continues its upward trend. Yesterday, after a pullback to the 122574 area and support from the channel’s bottom, it is once again ready to begin its next leg upward.
✨ The top formed at 125186 is Bitcoin’s new ATH resistance, and breaking this level would lead to further bullish continuation.
✅ Today, if this level breaks, we can have a long position on Bitcoin. If you already have an open position, there’s no need to re-enter at this point — it’s better to look for opportunities in other coins.
🎲 Since Bitcoin’s dominance trend is generally declining, if the next bullish leg begins, altcoins could also become attractive options. Therefore, it’s best to hold one position on Bitcoin and another on selected altcoins.
❌ Disclaimer ❌
Trading futures is highly risky and dangerous. If you're not an expert, these triggers may not be suitable for you. You should first learn risk and capital management. You can also use the educational content from this channel.
Finally, these triggers reflect my personal opinions on price action, and the market may move completely against this analysis. So, do your own research before opening any position.
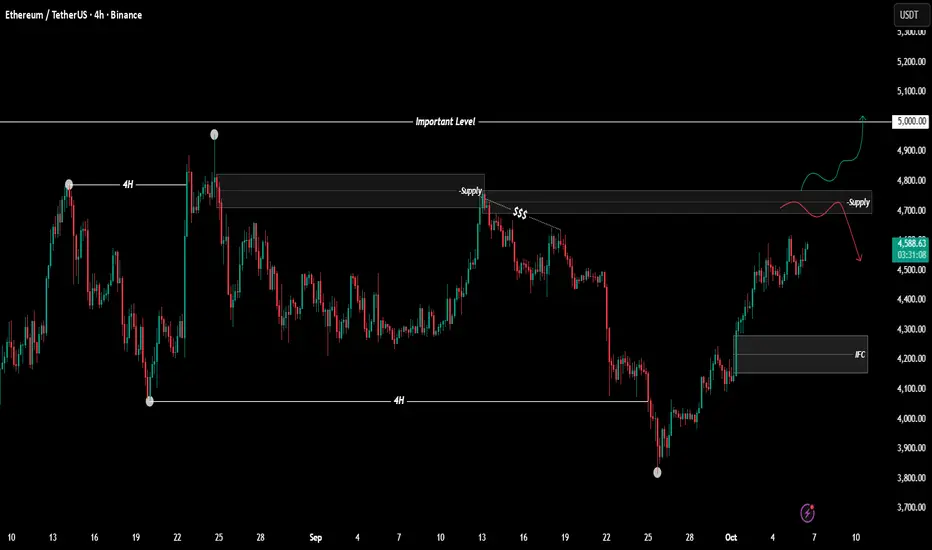
$ETHUSDT Analysis - Oct 6 | 4H Time FrameBINANCE:ETHUSDT Analysis - 4H
Hello and welcome to another analysis from the Satoshi Frame team!
I’m Abolfazl, and today we’re going to analyze Ethereum on the 4-hour timeframe.
As you know, USDT dominance has been trending downward, and the overall market structure is bullish. On the other hand, Bitcoin has set a new all-time high! Considering these factors, it’s clear that Ethereum also has the potential to move toward $5,000, which isn’t unrealistic.
From another perspective, Ethereum has shown a change of character (CHOCH) on the 4-hour timeframe, and the marked supply zone could create a pullback in price.
When the price reaches the supply zone, make sure to look for proper entry confirmations, and keep in mind that there’s a higher chance of the zone being broken and I’m personally looking for long positions.
See you in the next analyses!
Stay tuned with the Satoshi Frame team...
Nothing Bearish Here – Bitcoin Looks Ready to Expand HigherBTCUSDT – Daily Chart
Bitcoin continues to hold strong in the Stage 2 Accumulation → Expansion phase, with clean bullish structure across the 5, 10, 20 & 50 MAs. The markup leg remains intact — no signs of distribution or exhaustion so far.
If price begins to form a controlled pullback that respects the 5/10/20 MAs, I’ll be watching for new entry opportunities similar to what’s drawn on the chart. As long as these levels hold, BTC looks positioned to continue breaking into new all-time highs over the coming weeks.
Key Points:
• Trend remains firmly bullish — all MAs are cleanly stacked and rising
• Structure supports continuation toward and beyond ATHs
• Watching for a shallow flag / micro-pullback to build continuation setups
• Invalidation only if the daily closes back below the 20 MA
Bias: Bullish continuation
Stage: Accumulation → Expansion (Phase 2)
Questions for you:
• Do you think this trend has enough strength to break all-time highs next?
• How deep do you expect the next pullback to be before continuation?
• Which MA are you watching for confirmation of the next leg?
👇 Drop your thoughts — still long BTC here or waiting for deeper confirmation?
