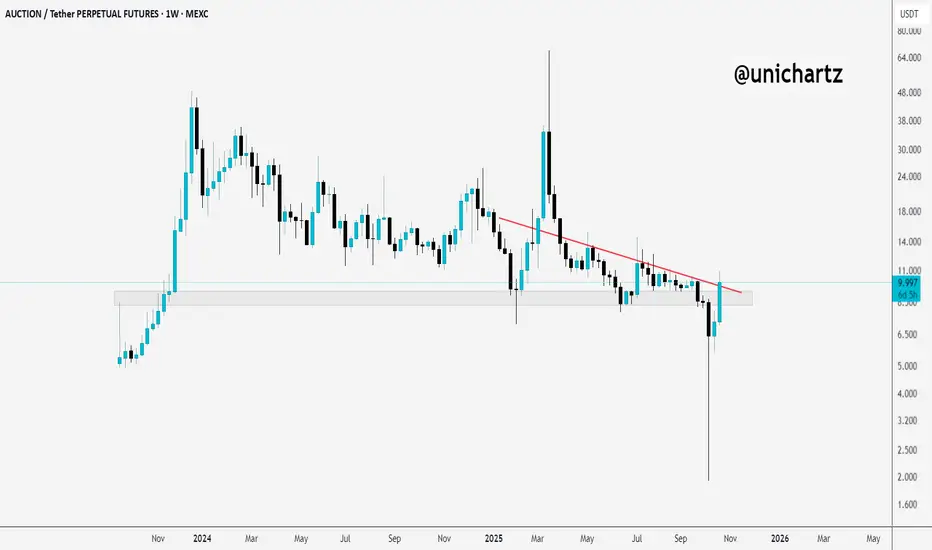
AUCTION Reclaiming StrengthAuction/USDT Analysis:
After the recent crash, $AUCTION has successfully reclaimed its support zone with strong momentum. The price has also broken above a key resistance line, a positive sign.
If it manages to close and sustain above this level, we could see a potential upside move in the coming days.
Keep an eye on the candle close and add it to your watchlist.
DYOR, NFA
#PEACE
Cryptomarket
BTC Market Update: Bulls Regain ControlBitcoin has stabilized after a sharp corrective phase, forming a consolidation structure around the $111,000 area. Recent sessions indicate that sellers are losing dominance while buyers are quietly re-accumulating within the current range. This type of price action often appears before a potential short-term recovery move.
Market volume remains steady, and the structure shows compression—suggesting liquidity buildup below the current level. If this consolidation sustains without breaking lower, a breakout toward the $115,000–$116,000 region appears likely. A clean move beyond this zone could invite stronger bullish continuation as sidelined traders re-enter.
However, the broader trend remains cautious, as macro conditions and dollar strength could still limit momentum. Short-term traders may look for entries near the range lows with clear invalidation below $108,000. Proper risk management remains essential, targeting gradual exits around mid-range levels and scaling profits near projected resistance zones.

TradeCityPro | Bitcoin Daily Analysis #201👋 Welcome to TradeCity Pro!
Let’s dive into Bitcoin analysis—its bullish trend seems to have started again, so it’s very important to analyze it well for the new week.
⏳ 1-Hour Timeframe
Yesterday, Bitcoin formed a range box between 106319 and 107301, and by breaking the top of this box, it began an upward move.
📊 After breaking this box, buying volume increased sharply, and after a pullback to this area, the move continued up to 111645.
✔️ Now the price has returned above the 109000 zone, but it still hasn’t managed to hold above this area.
⭐ With a break of 111645, we can confirm that price has stabilized above the 109000 zone.
🔍 In that case, we can enter a long position on the break of 111645; and at the same time, we’ll confirm that the break of 109000 was a fake-out.
💥 The trigger on the RSI is the 74.53 level. With RSI entering Overbought and breaking 74.53, the next bullish leg can begin.
❌ Disclaimer ❌
Trading futures is highly risky and dangerous. If you're not an expert, these triggers may not be suitable for you. You should first learn risk and capital management. You can also use the educational content from this channel.
Finally, these triggers reflect my personal opinions on price action, and the market may move completely against this analysis. So, do your own research before opening any position.

Ethereum’s Hidden Fractal Points to $33K by November 2026Most of the space seems to think that the bull market is officially over, that the four-year cycle has come to a close. For most of the cycle, I have thought that way too. 1,064 days is up, and that’s the longest a Bitcoin cycle has ever gone for. So, the idea that the same thing will play out again is very valid, and it’s entirely possible that it is indeed the end. However, my stance is very different — I still think we have one year left in the tank, and I will present a lot of evidence to support why I believe this and why I’m sticking to it.
If you’ve been following me for a while, you know that we’ve found some very interesting bar patterns in history that keep on repeating, and this will be the primary source of evidence used in my thesis.
Bar Pattern Fractals
I have tested hundreds of indicators over the last six years and bought thousands of dollars’ worth of indicators, and in the end, the highest success rate has come from simply following bar pattern fractals. They repeat over and over. They are hard to find, but once you do, you can ride them for months.
ETH 2017 Fractal
What you see above is a fractal I have been following for months now. It has been mirroring the 2017 cycle, with some parts nearly identical in movement and timing, with only a few small deviations here and there. The macro pattern continues to play out like clockwork.
Take a look at this TA from March 2025. We caught near the bottom, called for max pain, and discussed this fractal that could be playing out. The ETH call was under 2000 back then.
I also published TAs on Chainlink and its repeating bar patterns. It was straightforward for catching big macro moves for LINK.
As you can see, these are just two examples of many fractals I’m following. The main one is ETH because it’s been a 1:1 mirror for the most part. The last spike down was a deviation for sure — well, at first I thought it was on the Bitstamp chart because it has the most historical data for ETH, but when I switched to the Binance chart, I found something very interesting.
A view of the bar pattern fractal is telling us where we are.
When switching to the Binance chart, we see a very interesting wick of 26% that nuked the market during that time — very similar to what Binance has done this time around. You cannot make this stuff up. So at first, I thought it was a small deviation, but in fact, after looking at this chart, it’s still a mirror, even including that huge scam wick of 27%. Amazing.
So as you can see, in terms of the bar pattern fractal, I simply cannot ignore the fact that this keeps mirroring, and if it continues, it’s possible that we have one more year left in this bull market, and that this four-year cycle thesis is, in fact, a massive bear trap.
If we take a look at the monthly candle that shook a lot of players out last cycle before the run-up, we can see that we printed a candle with wicks on both ends — very similar to what we are forming right now.
If we zoom into that moment on a smaller timeframe, you can now see the moves are similar — a big drop into a double bottom followed by a slow grind up. This is how ETH normally puts in bottoms.
Looking at ETH’s RSI levels on the monthly chart — during the first cycle, when it broke the all-time high, RSI was extremely overbought at 87. On the last cycle, it was 82. This cycle, ETH is at an all-time high and the RSI is only 59. We’re not even in the overbought range yet — there’s so much room for ETH to expand, it’s crazy.
Since its inception, ETH has always pulled off the same move: one very aggressive wave with an aggressive pullback, followed by one smaller wave that creates a higher high to finish off the cycle. It’s done this every time.
Which means that if the bar pattern fractal continues to mirror, then wave 1 tops in the first week of January 2026, followed by a massive correction that will again fool everyone into thinking the four-year cycle is 100% over. But what if ETH puts in a bottom in February 2026 and rallies back up to all-time highs? Nobody would believe it — the disbelief would be strong because everyone would have sold the top in Q4 2025 due to the four-year cycle theory.
The second major piece of evidence I’m leaning on is the Russell 2000. Since its inception, the Russell 2000 has done the exact same thing before expansion comes:
Double top
Second drop bear trap
V-shaped recovery back to all-time high
Expansion breakout
Same thing every time. Look at the chart and tell me we’re not going into expansion — there’s a very high chance. The last two times, we got that massive monthly candle breakout in November.
Which brings me to the main point — every time the Russell goes into expansion, Bitcoin has started its most aggressive run. The last three times, Bitcoin went on to break its all-time high and put in a cycle top within an average of 355 days.
Gold, shown above, is so close to the 4.236 extension right now that it would be crazy to buy here. There’s a high chance of a major top coming in, and we’re about to see a major rotation back into Bitcoin with those gains.
Just take a look at the Power of Law model for Bitcoin — the bull market hasn’t even started yet.
It’s crazy that people are calling the cycle top with the Mayer Multiple sitting at 1.19.
Conclusion
My view is that there is one more year left in this uptrend in crypto. Bitcoin has turned into a different beast. It has completely detached itself from the rest of crypto for the most part, but the first expansion is coming in 2026. If the bar pattern does not deviate, then greatness lies ahead.

Bitcoin Market Analysis – October 20, 2025⚡️Welcome back to today’s Bitcoin analysis.
The trigger we discussed in the previous update has been activated, and the V-pattern we’ve been talking about throughout the week has finally formed, confirming the expected reversal structure.
🚀As mentioned earlier, the overall trend remains bullish, and once we see a clear stabilization above the 111,000 and 113,000 zones, it will serve as confirmation of our bullish continuation scenario.
📈The 111,000 zone could also provide another entry opportunity for those who missed the long setup around 107,000 — as long as the structure holds and buyers continue to defend this level.
🌕At this stage, it’s important to wait for fundamental confirmation.
If the broader market sentiment turns risk-on, Bitcoin could easily push toward new upside targets in the coming sessions.
---
> Disclaimer:
This content is for informational purposes only and does not constitute financial or investment advice. © DIBAPRISM
Larry D.Kohn

BTC/USDT: Bearish Channel Holds as Price Faces Key ResistanceBTC/USDT remains under bearish pressure, with the recent rebound from 102K facing resistance near the 114K–115K zone. Price action continues to respect the descending channel, reinforcing that sellers remain in control.
A rejection at the trendline could trigger another bearish leg toward 107.5K, with potential to revisit 102K if selling momentum intensifies. As lower highs continue to form below resistance, the broader bias favors further downside.

Discipline vs. Motivation: The Trader’s Real Edge1. Introduction
Most traders wait to “feel motivated” before they act. They look for that burst of excitement to drive their next session.
But motivation is unreliable. It fades after a few losses, a bad week, or a missed setup.
The traders who last aren’t driven by motivation. They’re driven by discipline, the quiet consistency that shows up even when excitement disappears.
2. Why Motivation Fails
Motivation is emotional. It peaks after a win and collapses after a setback.
When you rely on it, your behavior becomes inconsistent.
Examples:
– You skip journaling when tired.
– You overtrade after a loss.
– You hesitate until you “feel ready.”
Motivation starts the journey. Discipline finishes it.
The traders who survive long term are those who act from process, not mood.
3. The Power of Routine
Discipline isn’t about willpower. It’s about structure.
A simple daily routine removes emotional decision-making and replaces it with clarity.
One example framework:
Pre-market: Review levels and define risk.
During trading: Execute only setups that fit your plan.
Post-session: Journal outcomes and walk away.
Done consistently, this becomes second nature. You’ll trade correctly even when you don’t “feel like it.”
4. When Discipline Feels Boring
Discipline is not exciting. It’s repetitive, quiet, and often dull — but that’s why it works.
The more boring your process, the more consistent your results.
Amateurs seek excitement. Professionals seek predictability.
5. The Real Lesson
Motivation fades. Discipline compounds.
Every time you follow your rules — even on a losing day — you strengthen the foundation of a professional mindset.
The market rewards consistency, not emotion.

LTCUSD Next Target for Bulls RevealedLTCUSD 4H Chart
The correction has already ended at 100.25 . We expect a small retracement before the trend continues. Upon closer examination, this correction appears to be subwave C of wave (4). For now, watch the 119 level for a potential bullish breakout.
LTCUSD Targets: 122 , 127 , and 132 .
Wave (4) has already reached the 0.382 Fibonacci retracement level, which may act as support near the upper boundary and serve as a possible reversal point.
Stay tuned!
@Money_Dictators
Thank you :)

ICP Big Oppotunity Don't Miss Out!Hey Guys!
Wether you're an early investor of ICP or not, the current situation is different!
As you know ICP has been going on a downtrend since the day it has been launched and a lot of early investors lost their money betting on a real project like ICP thinking it will be the next $Eth.
But with Tragedy comes opportunity ! ICP's Price is about to touch down on the monthly lower Bollinger Bandat 0.6$ which is a historical event in my opinion and with it should come a big reaction by the devs or the investor's community.
I expect a big volume candle followed by a bullish news to breakout from the accumilation zone which will finally end the downtrend for ICP that lasted for years now.
Either way don't be greedy and keep in mind that ICP has an unlimited supply at this time (might change if the project community vote on it) but do the math and don't risk it.
I'm looking forward to hear your thoughts on this and feel free to leave a comment.

ZEUS/USDT NEW INCREASE VOLUMEThe last data shows that Zeus has an upcoming volume, which can break in the coming time frames. This token is worth adding to the watchlist to follow the coming trends

USDT Dominance — Is the Market Ready for a Relief Rally?After several days of steady climb, USDT dominance has now broken below its ascending support line — a potential signal that risk appetite may return to the crypto market.
The chart shows a clear short-term shift in momentum:
• The dominance failed to sustain above 5.15%, forming a local top.
• A clean breakdown from the channel has opened the path toward key liquidity supports, highlighted by the yellow zones between 4.95% → 4.75%.
• These areas represent potential reversal zones, where stablecoin capital might start rotating back into altcoins.
If dominance continues to drop toward these supports, we could see altcoins begin a short-term recovery phase — especially those with strong structure and volume base.
⚠️ Invalidation:
A return and hold above 5.15% would invalidate this scenario and suggest further consolidation before any major move.
⸻
📊 Summary:
USDT.D heading toward key supports → Possible rotation into risk assets (alts).
Stay alert for bullish confirmation signals on ALTs as dominance approaches the yellow zones.

Bitcoin - Losing MA200 SupportBitcoin has just shown a technical warning sign — for the first time since April, 3 daily candles have closed below the 200-day moving average (MA200). This signals a potential shift in trend and raises the risk of a deeper correction.
⸻
🔹 Current View
• BTC is trading around $107,600, struggling to reclaim the MA200 (~$107,700).
• The price had been moving inside a purple rectangular range since July, consolidating between roughly $107K and $123K.
• On October 17th, BTC broke below that rectangular range, confirming a range breakdown and increasing bearish momentum.
• Both the 50 SMA and 100 SMA are now above price, adding downward pressure.
• The RSI sits near 38, showing weakening momentum and potential continuation to the downside.
⸻
🔹 Key Levels to Watch
• Immediate Resistance: $114,000–$115,000 (50 & 100 SMAs)
• Next Supports: $104,000 → $96,000 → $88,000
• A move toward $88,000 would align with the long-term trendline support and could form a strong accumulation zone before the next major rally.
⸻
🔹 Outlook
As long as BTC remains below the MA200 and outside the previous range, the short-term trend is bearish.
However, this correction could present a great buying opportunity for long-term investors once key supports are tested.
⸻
🧠 “Breaking below the MA200 and losing the range often signals weakness — but it’s where long-term setups are born.”
📜 Disclaimer : This is general information only and not financial advice. Always do your own research before investing.

BTC Reign Pauses. Can ETH Lead the Charge Temporarily?A Tale of Two Titans: Divergence in the Making
Following the market-wide drop on October 10th, 2025, a significant divergence in character has emerged between the two crypto titans, Bitcoin and Ethereum. While Bitcoin's bullish structure appears compromised, Ethereum is exhibiting remarkable resilience, tenaciously holding key support and potentially setting the stage for a period of ETH-led market action.
This analysis explores the possibility of a temporary decoupling, where Ethereum takes the reins while Bitcoin enters a period of consolidation.
Bitcoin: Structure Compromised
From my perspective, the recent crash has severely compromised the prior bullish structure on Bitcoin's daily and weekly charts. The upward momentum has been invalidated, leaving BTC in a state of structural weakness. The most probable path forward for BTC appears to be a prolonged period of sideways consolidation, likely forming a complex flat correction. For now, the king seems to be resting in its coffin.
Ethereum: The Resilient Contender
In stark contrast, Ethereum’s chart tells a very different story. Here's why ETH is capturing our full attention:
Crucial Support Holds Firm: ETH is impressively defending the critical support zone around $3,756. Its refusal to follow BTC into a deeper decline is a powerful statement of relative strength.
Intact Market Structure: Unlike Bitcoin, Ethereum’s weekly and daily upward structures remain intact. The long-term bullish thesis is not yet broken (Weekly chart upward structures & Elliot are still holding targeting around 5900 USDT)
Emerging Elliott Wave Count: As illustrated on the daily chart, a weak but valid Elliott Wave count is taking shape. We appear to have completed a Wave (2) correction right at this key support. If this level holds, it paves the way for a powerful Wave (3) impulse to the upside.
Confluence of Bullish Divergences: Adding significant weight to this outlook are the strong bullish divergences flashing on both the Daily and 4-Hour charts. Around the $3,756 support, both the RSI and MACD are showing higher lows while price has tested lower lows — a textbook signal of waning bearish momentum and a potential reversal. Should this scenario materialize, we can expect a notable increase in weekly and monthly volatility as momentum shifts.
RSI divergence on 1D chart
MACD Divergence
OBV (4H chart) note that obv always making higher lows around the current support
BBWP contraction on 4H chart
The Big Question: A Changing of the Guard?
This brings us to a fascinating and potentially market-defining question: Can Ethereum lead the crypto market to new all-time highs while Bitcoin moves sideways?
We may be witnessing a temporary 'changing of the guard,' where ETH's fundamental strength and resilient technicals allow it to become the market's temporary primary driver. While Bitcoin's gravity is undeniable, the current situation suggests that Ethereum might be carving its own path.
The confirmation of this thesis rests on the $3,756 support. A sustained hold above this level could be the opening act for the next major bull run, led by an unexpected protagonist.
Share your thoughts in the comments

ETHEREUM HIGH PROBABILITY SETUP SOON!!! 🚨 ETHER HIGH PROBABILITY BUY SETUP 🚨
* Here We Can See Clearly The Next Potential Moves For ETHUSD Coming Hours/Days.
* Keep Your Eyes Close On Your Trading Positions.
* Happy PIP Hunting Traders.
FXKILLA.

BITCOIN HIGH PROBABILITY SETUP SOON!!!🚨 BTC HIGH PROBABILITY BUY SETUP 🚨
* Here We Can See Clearly The Next Potential Moves For BTCUSD Coming Hours/Days.
* Keep Your Eyes Close On Your Trading Positions.
* Happy PIP Hunting Traders.
FXKILLA.

$PUP IN STRONG SUPPORT - ACCUMULATION ZONEGETTEX:PUP looks like it is forming its bottom nicely at these levels
Accumulate

KMNO HOLDING THE MAIN TREND ON WAY TO NEW LEVEL..KMNO is still holding the important Maintrend, as long as this coin continues to do this, there is a high chance it will get a new increase in volume in the coming time frames.

XRP could Sky Rocket!!!XRP is testing at a key SUPPORT zone and if it starts pushing to RESISTANCE there is a good chance in the next couple of months it will break that zone and give lots of profits to holders. 😍🫡

BNB Game Plan - TBKZ ModelBNB Game Plan – TBKZ Model
📊 Market Sentiment
Market sentiment is currently volatile, heavily influenced by U.S. foreign policies.
With the U.S. entering a quantitative easing (QE) phase, the long-term outlook remains bullish, as more liquidity is expected to flow into risk assets.
However, the short-term sentiment is bearish due to renewed trade tensions and Chinese tariff concerns.
Overall, sentiment is slightly bearish short-term, but bullish long-term as macro liquidity expands.
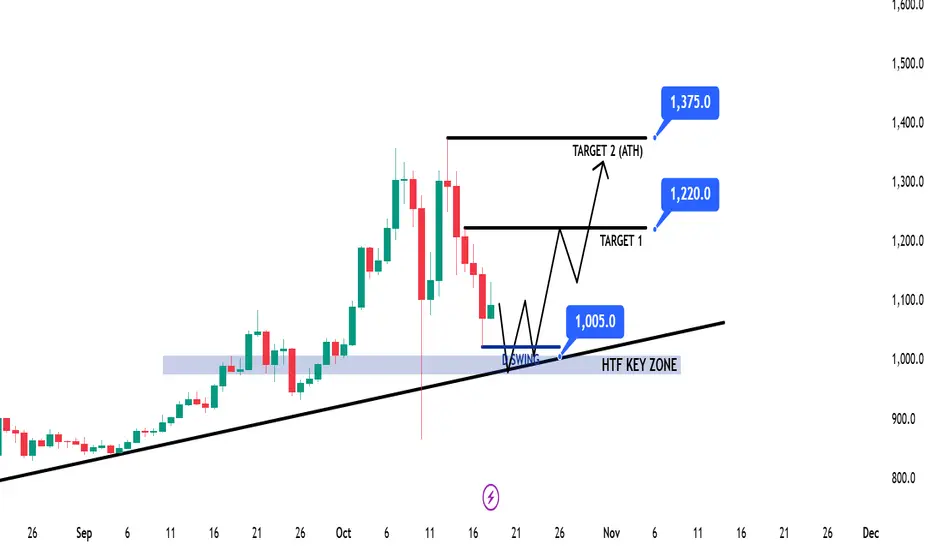
📈 Technical Analysis
Price tapped the HTF bullish trendline and faced a rejection wick during the Chinese tariff announcement.
This reaction confirms the trendline’s significance as a major dynamic support zone.
Now, I’m watching for another price leg toward the HTF trendline, expecting a possible retest and bounce from the HTF Key Zone around $1005.
📘 Model to be used – TBKZ Model (Trendline Bounce at Key Zone)
1️⃣ Identify the HTF trend — trade only in that direction.
2️⃣ Map out the HTF trendline that may act as dynamic support.
3️⃣ Locate the HTF Key Zone containing significant liquidity and structure.
4️⃣ Wait for a bounce and LTF confirmation before entering the position.
📌 Game Plan
I will be waiting for price to return to the HTF trendline and retest the HTF Key Zone near $1005.
Once price gives confirmation (12H–4H structure break), I’ll look for a long setup.
🎯 Setup Trigger
Break of structure on 12H–4H timeframe after testing the $1005 zone.
📋 Trade Management
Stoploss: 12H–4H swing low that breaks structure
Targets: TP1: 1220$ | TP2: 1375$ (ATH)
Move stoploss to breakeven after TP1 hits.
💬 Like, follow, and comment if this breakdown supports your trading! More setups and market insights coming soon — stay connected!
⚠️ Disclaimer: This content is for informational and educational purposes only and does not constitute financial, investment, or trading advice. Always DYOR before making any financial decisions.
Litecoin Long-term Pump! Are you ready for this ?Hey Guys !
Are you ready for the LTC big pump ? It seems to me that we 're about to witness a big volatility in Altcoins very soon... As you know Bitcoin has been pumping for few months now and we haven't really seen any significant change in almost all the allcoins which might be confusing but if you look closely to the Litecoin 3 months chart you can see exactly why.
Whales has been accumulating for the last few months and as soon as the Bitcoin crashes (inevitable) all allcoins should crash even more and we should witness an all time low for most altcoins especially LTC which might reach the ALL TIME LOW line!
Bollinger Bands for the 3 months chart shows that we are getting rejected by mid band for months and its only logical that we fall to the lower band which is around 30$ and this price can be the ultimate entry price for long term investment!
Try to catch the train from the start and hodl untill the big pump news comes out wether its a Walmart announcement or whatever BS they say its gonna pump super hard !
Let me know what do you guys think about this and I'm looking forward for your comments.

TradeCityPro | DASHUSDT One of the Strongest Long Setups🔹 DASHUSDT Technical Analysis — One of the Strongest Long Setups in the Market!
Let’s dive into the analysis of DASH, one of the older yet technically impressive coins in the crypto market. Despite the recent volatility, DASH has shown stronger bullish structure compared to most altcoins — making it one of the few charts currently setting up for a potential long opportunity.
🌐 Market Overview
Before diving deeper, keep in mind that today and tomorrow the global crypto market will have lower liquidity due to the weekend. This often leads to lighter trading volume and potentially unpredictable price spikes.
If you’re planning to open a position during this period, it’s highly recommended to reduce your risk and avoid over-leveraging.
📈 Bullish Scenario (Long Setup)
The DASHUSDT chart is showing a strong bullish structure and currently consolidating below a key resistance level at 49.22.
Once this level is broken with confirmation and volume, it will likely trigger a sharp upward continuation — supported by the strong uptrend that has been forming over recent sessions.
✅ Long Trigger: Break and close above 49.22
🎯 Target 1: 55.00
🎯 Target 2: 60.13
The area around 60.13 is crucial, as breaking it could lead to a parabolic move, especially if market volume returns early next week.
📉 Bearish Scenario (Short Setup)
In case of an early rejection from 49.22 or a sudden drop due to the low-volume weekend conditions, we should monitor the 39.34 support zone closely.
A confirmed break below 39.34 could signal a shift in short-term momentum, opening room for a short position.
However, it’s worth noting that other coins — particularly TON and IMX — currently show cleaner short triggers and may offer better setups in case the market turns bearish.
⚙️ Risk Management Tip
Since the market is in a low-liquidity phase, it’s important to:
Use smaller position sizes
Wait for candle confirmation on the breakout
Set tight stop-losses just below local supports
🎯 Summary
🟢 Long Setup: Break above 49.22 → Target 55.00–60.13
🔴 Short Setup: Break below 39.34 → Conservative entry (better shorts on TON & IMX)
⚠️ Note: Trade lighter due to low weekend volume
💬 Final Thoughts:
DASH stands out among altcoins this week with a notably stronger bullish chart structure. The trend is constructive, and if momentum continues next week, a confirmed breakout could deliver one of the best long trades of the week.
Stay patient, watch the 49.22 level closely, and let the market confirm the move before entering.

HBAR LONG Targeting Weeks High Send ITTT - Formed a nice buy entry on the OTE looking for upside removal before going lower - managing risk responsibly

ETHUSD 1D Analysis: Back to the 0.618 fib after ATH rejection?ETH seems to have been rejected at ATHs, with a consequent break of trend diagonal, it's retest and rejection.
The chart reflects a bearish divergence between price and momentum indicators, suggesting a possible trend reversal for ETHUSD in the coming months. The RSI shows a lower high while price made a higher high, indicating weakening buying pressure. Similarly, the MACD’s lower high echoes a loss of momentum, confirming the divergence signal.
The main daily chart displays a breakdown of the multi-month uptrend, as the price violated its rising support line around the end of September 2025. This technical break is reinforced by the outlined Fibonacci retracement levels, providing reference points for potential support and resistance zones. The red projection line anticipates further downside, aligning with the negative momentum seen in RSI and MACD.
Price targets for the projected short setup are highlighted by the green box between the $2,150 and $2,600 zone, where historical volume and Fibonacci confluence may offer stabilization. A broader target extends as low as $1,650 if bearish momentum intensifies, while resistance on any bounce exists near $3,200 and $3,850.
Trade Idea Summary:
Bias: Bearish, following uptrend break and momentum divergence.
Entry range: On confirmed retest and rejection of the broken trend line or key resistance ($3,200–$3,850).
Profit targets: $2,600, $2,150, $1,650, based on volume profile and Fibonacci levels.
Stop loss: Daily close above $4,000 or reclaim of trendline.
Risk management: Adjust stop as price approaches $2,600 zone.
This setup emphasizes momentum decay, technical breakdown, and structured targets, ensuring clarity for both experienced and newer traders.
NFA
