TradeCityPro | Bitcoin Daily Analysis #199👋 Welcome to TradeCity Pro!
Let's move on to the Bitcoin analysis—finally, the support zone that Bitcoin had has been broken. Let’s review what has happened in the market.
⏳ 1-Hour Timeframe
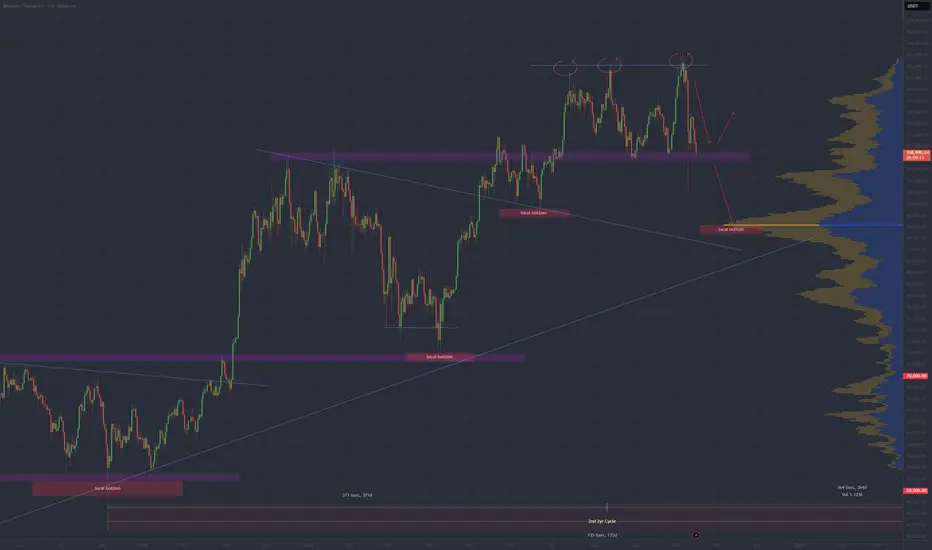
Yesterday, Bitcoin was in a consolidation range between 110,420 and 111,714.
✔️ Bearish signals, such as Dow Theory structure and high volume on bearish candles, were visible on the chart. Eventually, this led to a break of the consolidation from the bottom, and the support zone was lost.
🔍 After breaking this area, the price retraced and, with a consolidation below 107,790, confirmed the breakdown.
⭐ Currently, the price is at 104,483 and has reacted to it. The RSI oscillator has also reacted to its support area at 22.19 and has been holding near this support for several candles.
📉 If the price continues to drop, this 104,483 level serves as a suitable trigger for the next entry point. Breaking this level could push the price toward the next support zones.
🔔 However, if the price moves upward and fully fakes this drop, a consolidation above 111,714 would confirm a bullish reversal for Bitcoin, allowing us to open long positions with much higher momentum.
💡 I personally opened a short position at the break of 110,420 and am not taking profit yet because it’s a good entry point. In the future, if the market drops, it will provide strong support for subsequent positions.
💥 If the market moves upward and this short gets stopped, strong bullish momentum will enter, making the long positions we open in the next leg very attractive.
❌ Disclaimer ❌
Trading futures is highly risky and dangerous. If you're not an expert, these triggers may not be suitable for you. You should first learn risk and capital management. You can also use the educational content from this channel.
Finally, these triggers reflect my personal opinions on price action, and the market may move completely against this analysis. So, do your own research before opening any position.
Cryptomarket

TradeCityPro | MNT: Key Support Holds for Now👋 Welcome to TradeCity Pro!
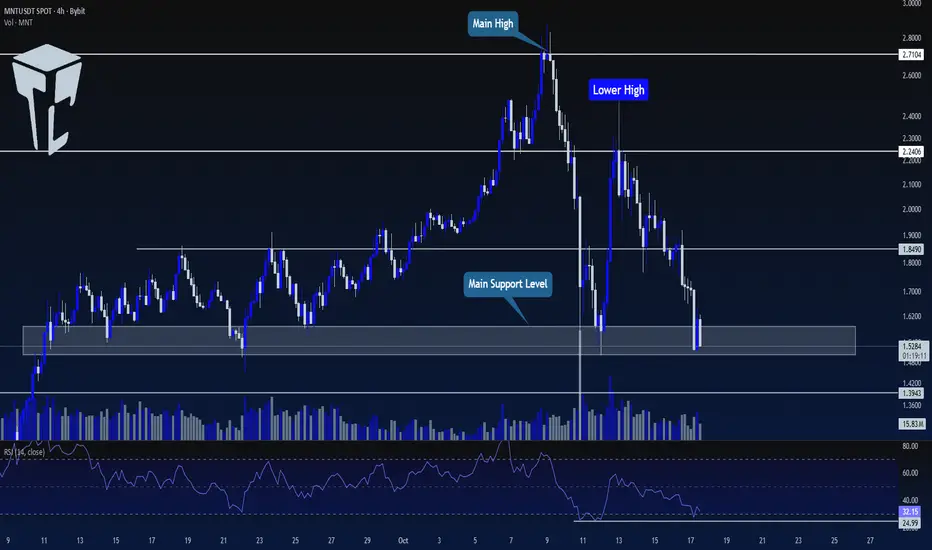
In this analysis, I want to review the MNT coin for you. One of the most well-known Ethereum Layer 2 projects, with a market cap of $5.03 billion, ranked 26th on CoinMarketCap.
⏳ 4-Hour Timeframe
On the 4-hour chart, after an upward trend, this coin reached 2.7104 and has now entered a corrective and bearish phase.
✨ There is a very important support zone around 1.5. The price has reacted to it once, formed a lower high, and is now back on support.
💥 The RSI oscillator is near the Oversell area. Breaking 24.99 will push the RSI into Oversell.
✔️ For short positions, we can enter on a break of this range. However, since the higher timeframe trend is bullish, we should also consider confirmation from volume, RSI, and Bitcoin.
🔍 For long positions, we need to wait until the market structure creates a proper trigger for a long. Currently, the main confirmation for bullishness is a break of 2.2406.
📝 Final Thoughts
Stay calm, trade wisely, and let's capture the market's best opportunities!
This analysis reflects our opinions and is not financial advice.
Share your thoughts in the comments, and don’t forget to share this analysis with your friends! ❤️
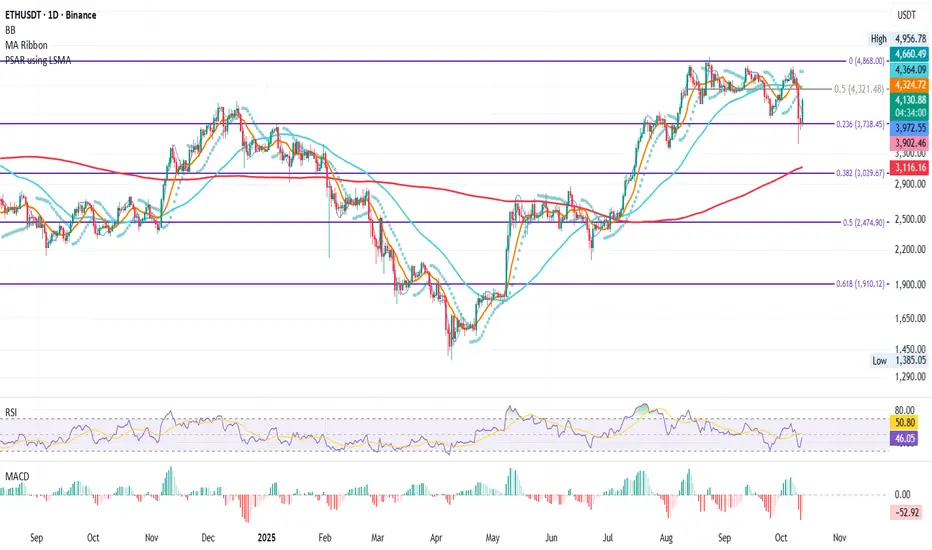
Ethereum Key Buy Zones 💠 Ethereum (ETH/USD) – Key Buy Zones Ahead
ETH is showing a major rejection from the same price zone that has only been tested twice in history — near the $4,000–$4,100 resistance area (highlighted in circles). Both previous visits led to sharp corrections, making this a historically strong resistance zone.
⸻
🔹 Current View
• ETH rejected the $4,000–$4,100 zone — same level as the 2021 top.
• Price is now trading around $3,770, below the 50 & 100 SMAs, signaling short-term weakness.
• The RSI is trending down from mid-levels, suggesting more room for a correction before a potential bounce.
⸻
🔹 Buy Targets
• First Buy Target: $2,590
• Second Buy Target: $2,160
• Third Buy Target: $1,715
These levels line up with strong historical support zones and key moving averages, ideal areas to start accumulating if ETH continues to pull back.
⸻
🔹 Outlook
The long-term structure for Ethereum remains bullish, but a deeper correction could provide much better risk-reward entries for the next cycle.
My plan: accumulate gradually at the marked levels, focusing on patience and strong technical confirmation.
⸻
🧠 “Smart investors don’t chase green candles — they buy when fear returns.”
📜 Disclaimer : This is general information only and not financial advice. Always do your own research before investing.

BTCUSD; Heikin Ashi Trade IdeaLast time we had big divergence on MACD and weekly TF, we had big correction...

BNB: The Party's Over. Here's the Short Setup.Yo.
Quick-fire analysis on BNB/USDT, looking across the M15 to H4 timeframes. The market gave us a technical bounce, a relief rally for the amateurs. Don't be fooled. The party is over, and the bears are now in control.
The Setup
Let's recap the recent chaos. After last Friday's mass liquidation event, BNB staged an absurd rally, tapping a new ATH around 1375 within three days. Hope you survived the volatility. That move, however, was pure euphoria, completely detached from the broader market reality.
While BNB was flying, BTC showed extreme weakness, failing to reclaim any meaningful levels. This divergence was a massive red flag. It was inevitable that BNB's gravity-defying move would correct, and correct hard.
My setup is classic, no-nonsense technical analysis: multi-timeframe Fibonacci levels, a hard focus on volume profile, and a tactical eye on order flow. The blue Fib levels are drawn on the H4 chart (macro trend), and the red Fibs are for the M15 chart (micro trend since the Friday low).
What's Happening Now
The chart is screaming "SELL" at a major point of technical confluence. For anyone who can read price action, this is crystal clear.
After a first test yesterday, the critical 0.618 Fibonacci support on the H4 timeframe was decisively broken today, October 17th. This wasn't just any Fib level; it was perfectly aligned with the Point of Control (POC) from the entire last uptrend—the area with the highest traded volume. Losing this level means the bulls have lost their single most important line of defense. The structure is broken.
The Levels That Matter
We've already hit our first target at 1022, which corresponds perfectly to the 1.272 Fibonacci extension from the H4 structure. The playbook from here is simple. We are now watching for a pullback to reload short positions.
- Short Entry Zone: I'm watching for a weak pullback into the 1093 zone. This area represents the '1' point of the H4 Fib retracement and is the ideal spot to the bag. Any bounce to this level that shows signs of exhaustion is a gift.
- Invalidation (Stop Loss): The line in the sand is a clean break and hold above 1125. A move above this level would negate the current bearish market structure and signal that the downtrend is compromised.
- Targets: I’m reaching two price
- The 1.414 Fibonacci extension, which brings us to the $988 area.
- A full leg down to the 1.272 extension on the M15 Fib, targeting the $865 region. This level also aligns with the previous major low, making it a powerful magnet for price.
I'm not betting on hope; I'm trading the evidence. The evidence shows the path of least resistance is down. Let's see how it plays out. As always, don't get rekt.

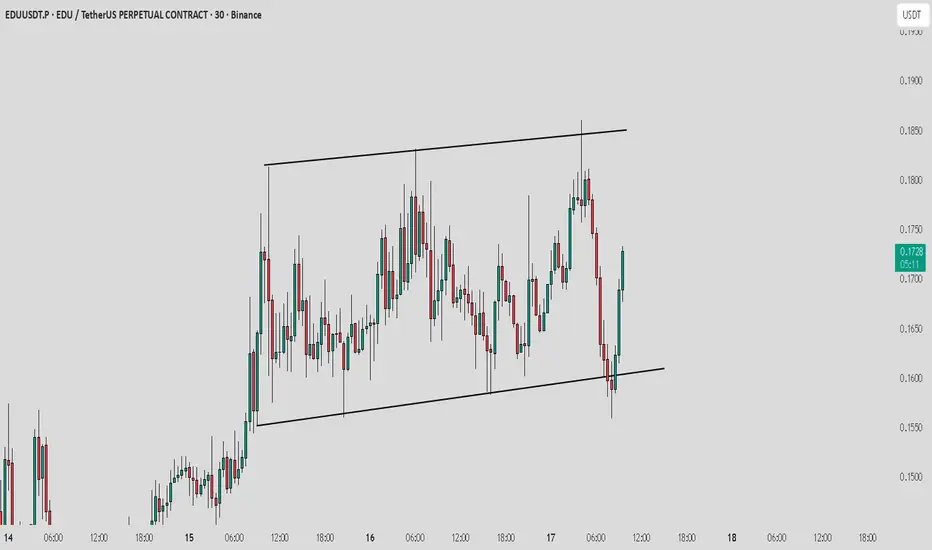
EDU /USDT consolidating in range_Watch for breakout or breakdownEDU is currently trading within a clear horizontal range. After rebounding strongly from the lower support zone, price is now moving upward toward the range resistance.
Bullish Scenario: If EDU breaks and holds above the upper boundary, it could trigger a breakout rally.
Bearish Scenario: A rejection from resistance may lead to another retest of the range support.
Always wait for confirmation before entering and manage risk wisely.
Bitcoin Short-Term Update – October 17, 2025-The short trigger from yesterday has been triggered, and the market is currently moving in favor of the bearish scenario.
At this stage, the downside momentum remains strong, making it reasonable to keep short positions open, provided you manage your risk carefully and adjust stops appropriately.
-However, it’s important to remain prepared for a potential V-shaped reversal.
If such a pattern forms, it would signal a sudden shift in momentum, and we would need to flip our bias toward long positions.
-This is particularly relevant because our long-term trend is still bullish, meaning any corrective move could be temporary.
While the short-term setup favors sellers for now, flexibility and vigilance are crucial, as the market could quickly reverse.
For informational purposes only – not financial advice. © DIBAPRISM
Larry D.Kohn

BTCUSD: Short opportunities on technical retrace BITSTAMP:BTCUSD Analysis – October 17, 2025
Yesterday’s short setup (BB) was triggered and hit target as planned.
The main trend remains bearish, confirming that sellers are still in control.
For today, the focus remains on looking for short opportunities following the current downtrend.
Expecting a technical pullback toward the 40%–60% retracement zone of the previous bearish leg.
As price approaches this area and retests the EMA, wait for a clear confirmation signal before entering.
If price fails to follow the setup, stay patient and wait for more confirmation to ensure a safe and disciplined trade.
Main Plan: Keep a bearish bias — look for shorts near the 40–60% retracement zone once confirmation appears.
Daniel Miller @ ZuperView

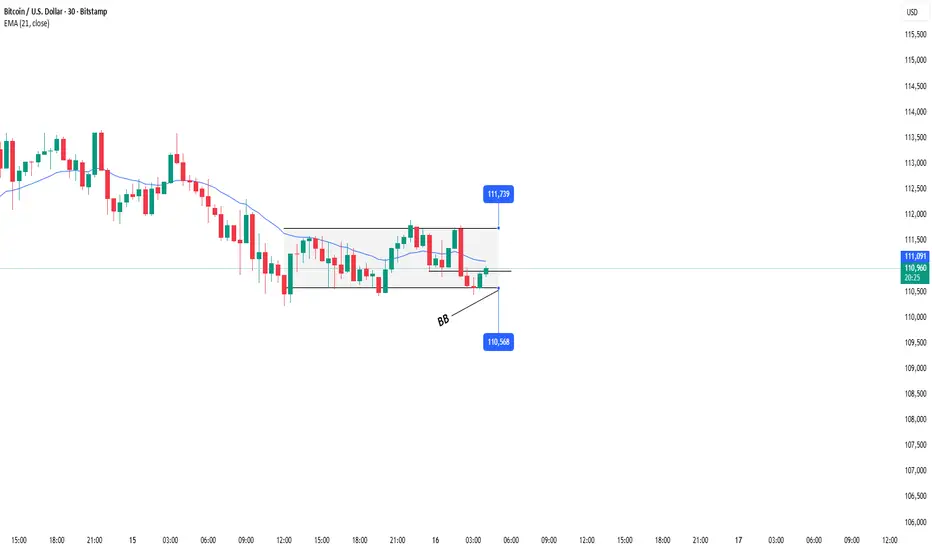
BTCUSD: Sideways in a block, looking for setup🧭 BITSTAMP:BTCUSD analysis – October 16, 2025
Currently, BITSTAMP:BTCUSD remains in a broader downtrend, so for today’s session, our main focus will be on looking for short (sell) opportunities, rather than counter-trend buys.
I’m using the 30-minute timeframe (M30) for today’s setup.
At the moment, BTC price action is quite complex — moving sideways within a block structure and has recently retested the resistance area around 110,904.
The plan for today is to wait for solid accumulation and a clear BreakBlock (BB) setup to confirm continuation to the downside.
Once a valid setup forms, we can look for short entries following the main trend, with strict risk management and flexible profit targets depending on market volatility.
Alternative Scenario:
If price breaks above the current range, we’ll stay patient and wait for clearer signals before entering any trades.
This approach helps us avoid FOMO and stay disciplined, ensuring all trades align with our predefined plan and market structure.
Daniel Miller @ ZuperView
Stop!Loss|Market View: BTCUSD🙌 Stop!Loss team welcomes you❗️
In this post, we're going to talk about the near-term outlook for the BTCUSD ☝️
Potential trade setup:
🔔Entry level: 107,294.21
💰TP: 99,296.41
⛔️SL: 113,888.88
"Market View" - a brief analysis of trading instruments, covering the most important aspects of the FOREX market.
👇 In the comments 👇 you can type the trading instrument you'd like to analyze, and we'll talk about it in our next posts.
💬 Description: Given the technical accumulation of the price near the lower border of the accumulation area 110,500 - 121,810, as well as a decline in open interest in the BTC futures market (medium- to long-term picture), a breakout of the lower border of the indicated accumulation area is expected. The key target is near 100,000, with a further decline to 90,000 expected.
Thanks for your support 🚀
Profits for all ✅
❗️ Updates on this idea can be found below 👇

Bearish momentum to extend?Bitcoin (BTC/USD) is rising towards the pivot and could reverse to the 1st support.
Pivot: 109,846.88
1st Support: 105,491.44
1st Resistance: 113,040.57
Disclaimer:
The above opinions given constitute general market commentary, and do not constitute the opinion or advice of IC Markets or any form of personal or investment advice.
Any opinions, news, research, analyses, prices, other information, or links to third-party sites contained on this website are provided on an "as-is" basis, are intended only to be informative, is not an advice nor a recommendation, nor research, or a record of our trading prices, or an offer of, or solicitation for a transaction in any financial instrument and thus should not be treated as such. The information provided does not involve any specific investment objectives, financial situation and needs of any specific person who may receive it. Please be aware, that past performance is not a reliable indicator of future performance and/or results. Past Performance or Forward-looking scenarios based upon the reasonable beliefs of the third-party provider are not a guarantee of future performance. Actual results may differ materially from those anticipated in forward-looking or past performance statements. IC Markets makes no representation or warranty and assumes no liability as to the accuracy or completeness of the information provided, nor any loss arising from any investment based on a recommendation, forecast or any information supplied by any third-party.

BTC Daily – After the ATH, The Market Takes a Breath
BTC tapped the 161.8% Fib. level, setting a new all-time high of 126K on Monday, October 6.
Since then, price has retraced to the BB Center and today’s candle opened below it.
If today’s close remains under the BB Center, there’s a strong chance for another leg down in the short term.
From a system perspective, momentum is tilting bearish:
Price < BB Center < SMA < MLR, confirming short-term weakness.
RSI has crossed below its moving average, and MACD is about to turn red.
All signs point to a cooling phase after the run to new highs, a normal reset within a larger cycle.
Bias:
Short-term bearish, healthy pullback after overextension.
Always take profits and manage risk.
Interaction is welcome.

ETH Daily – High Volume, Rising OI, and a Fight for StructureETH Daily – Volume King Leading the Rebound
At this moment, ETH shows the highest trading volume across major assets.
After the sharp crash that dragged price down to 3435$, under the 0.236 Fib level, ETH found strong support near 3738$,the 0.236Fib level.
From that level, price has now reclaimed the 4000$ mark, a psychological and technical milestone.
If momentum continues, the next resistance sits at the 0.5 Fib level around 4321$.
From a system perspective, structure remains technically bearish for now:
SMA < MLR < Price < BB Center, with PSAR still bearish (above price).
To flip structure bullish, ETH would need a daily close above the BB Center with PSAR reversal confirmation.
OI Analysis:
ETH OI +7.70% growth confirms new leveraged exposure entering during this rebound: a positive sign showing traders are adding risk rather than de-risking.
This increase in OI, combined with strong spot volume (74.6B in 24h), suggests conviction behind the recovery rather than a mere short-covering bounce.
However, elevated OI also means volatility risk is rising: if ETH fails to close above 4000$ or BB Center, liquidations could amplify the next pullback.
Bias:
Cautiously bullish, short-term momentum improving, structure still lagging. Watching daily close above 4k today and BBcenter for future confirmation.
High volume and rising OI often mark the start of a structural shift, but confirmation always comes from the daily close.
In moments like this, patience is what separates the trader reacting to price from the one anticipating the next move.
Always take profits and manage risk.
Interaction is welcome.
BTC testing key support levelBitcoin is now testing a key support zone between $107,000 and $109,000.
This area has been tested three times in the last weeks, each time producing a bounce, which suggests that buyers are ready to step in around this price.
Large on‑chain wallets are accumulating near $108k, adding hidden buying pressure that helps defend the level. Volume‑profile analysis shows a high‑volume node at the same price, another classic sign of strong support.
If the daily candle closes cleanly above this range, the floor is likely solid and the next target becomes the $115k–$120k resistance band.
Conversely, a daily close below $107k–$109k would flip the narrative from defended floor to broken support.
A break of the support would open the path toward $96,000, a psychologically important round‑number zone and the next major point of interest.
A sizable cluster of stop‑losses and pending sell orders sits just above $95k, so price could accelerate once that barrier is breached.
Should price fail to hold at $96k and keep falling, the next structural test is the downward trend line that converges near $91k.
In short, today’s critical signal is the daily close: stay above $107k for a bullish continuation, fall below for a move toward $96k, and watch the $91k trend line for a longer‑term structural shift.
Risk management is essential; the $96k area offers a favourable risk‑to‑reward profile for long‑term holders.
TradeCityPro | Bitcoin Daily Analysis #198👋 Welcome to TradeCity Pro!
Let’s move on to the Bitcoin analysis. The price is in a very sensitive area, so it’s important to have a proper analysis.
⏳ 1-Hour Timeframe
Bitcoin is still near its support zone and is ranging around 110,420.
⭐ The top of the range is 111,714, and the price is forming a compression.
✨ At the same time, the RSI has formed a range between 30 and 50 and is oscillating.
📊 If 110,420 breaks, the probability of breaking the range increases significantly, and this level can serve as a good early short trigger.
📈 For long positions, we can open the first position on a break of 111,714. The next entry points would be 113,218 and 115,698.
🔔 Currently, market volume is very important and decisive; the volume favors sellers, which increases the probability of a bearish scenario. If this volume persists, Bitcoin’s support zone could break.
💥 However, if we see a change in volume and buying volume exceeds selling volume, we can expect Bitcoin to be supported in this area and move upwards.
❌ Disclaimer ❌
Trading futures is highly risky and dangerous. If you're not an expert, these triggers may not be suitable for you. You should first learn risk and capital management. You can also use the educational content from this channel.
Finally, these triggers reflect my personal opinions on price action, and the market may move completely against this analysis. So, do your own research before opening any position.

TradeCityPro | LINKUSDT Early Entry Trigger!👋 Welcome to TradeCityPro Channel!
After the recent sharp drop in the overall crypto market, which was mainly triggered by negative news from China and the United States, Chainlink (LINK) also faced a noticeable correction —just like most major altcoins.
At the moment, LINK is trading below a strong daily resistance zone, which has previously acted as a key turning point for price action. The market seems to have already completed a pullback to this resistance, showing that sellers are still active in this region. This is a critical area — the next move from here could define whether LINK continues downward or begins a new bullish leg.
If the market manages to break above this resistance with strong momentum and confirmed volume, we can start looking for long opportunities on lower timeframes (like 4H or 1H). However, it’s safer to wait for confirmation of structure change, such as the formation of higher highs and higher lows, before entering.
For a short position, there are two clear scenarios:
If the price gets rejected from the 20.12 level, it can trigger a short setup early, especially if accompanied by bearish candlestick patterns like a shooting star or bearish engulfing.
A confirmed break below 17.07 would act as a stronger confirmation for continued downside momentum — showing that buyers are losing control and the bearish pressure remains dominant.
On the other hand, if the price breaks above 20.12, we’ll likely see a move toward the descending trendline that has been guiding LINK’s movement for several weeks. This zone could become another major decision point:
A rejection from the trendline might start another wave of correction,
But if LINK breaks above it and sustains momentum, it would signal the start of a potential bullish reversal, possibly leading to a trend continuation toward higher resistances.
🔹 Bullish confirmation: Break and retest above 20.12 with structure change on lower TFs.
🔹 Bearish confirmation: Breakdown below 17.07, or rejection from 20.12 with volume.
🔹 Neutral zone: Between 17.07 – 20.12, where price might consolidate before its next move.
Overall, LINK is currently in a decision-making phase, and traders should stay patient, waiting for clear breakout or rejection signals before entering any position.
📝 Final Thoughts
Stay calm, trade wisely, and let's capture the market's best opportunities!
This analysis reflects our opinions and is not financial advice.
Share your thoughts in the comments, and don’t forget to share this analysis with your friends! ❤️

TradeCityPro | HYPE: Watch Key Zones for Trend Reversal👋 Welcome to TradeCity Pro!
In this analysis, I want to review the HYPE coin for you. This is one of the crypto DEX projects, with a market cap of $13.26 billion, ranking 11th on CoinMarketCap.
📅 Daily Timeframe
On the daily timeframe, this coin had an upward channel that, after being rejected from its peak, started a downward move and managed to break the channel’s support.
💥 Currently, the price is forming a bearish structure, creating lower highs and lower lows.
✅ The support level the price is currently interacting with is 36.682, which has previously been an important low and is now reacting to it.
✨ A minor high has formed at 42.862, and if the price breaks this level, it could start forming a bullish structure again.
📊 With a break above 42.862, we can open a long position on lower timeframes. The important support level is 36.682, and breaking it could serve as a risky short trigger.
🔔 The main confirmation of the bearish trend will be given with the break of this coin’s support zone; for bullish continuation, the next wave would start after breaking the 55 level.
📝 Final Thoughts
Stay calm, trade wisely, and let's capture the market's best opportunities!
This analysis reflects our opinions and is not financial advice.
Share your thoughts in the comments, and don’t forget to share this analysis with your friends! ❤️

KGEN / USDT : Looking strong for a nice bullish moveKGEN is showing strong bullish momentum and looks ready for a potential 40–50% rally in the short term.
Keep a close watch and manage risk wisely — wait for confirmation before entering.

Bitcoin Market Outlook – October 16, 2025-Today, there’s a strong possibility that Bitcoin may finally break out of its current consolidation range.
The market has been moving sideways for several sessions, showing signs of indecision among traders — but the current price action suggests that volatility could be returning soon.
-At the moment, all eyes are on the 110,400 support zone.
A confirmed breakdown below this level could provide an initial short opportunity, potentially opening the door for a deeper correction toward lower liquidity areas. Such a move would likely trigger stops and force weak hands out of the market, creating temporary downward momentum.
-However, if this breakdown turns out to be a fake move and the price quickly forms a V-shaped recovery pattern, it will be critical to shift the bias to long positions immediately.
That scenario would indicate a “risk-on” sentiment returning to the broader market, as liquidity and capital could start flowing back into Bitcoin — possibly marking the beginning of another bullish leg.
- In summary, today’s candle close around 110,400 is extremely decisive.
A clean breakdown confirms continuation of the correction, while a sharp rebound from this level could validate a strong reversal setup.
Either way, traders should stay alert, as this zone will likely define the next major directional move for Bitcoin.
For informational purposes only – not financial advice. © DIBAPRISM
Larry D.Kohn

ETH Game Plan – FTKZ ModelETH Game Plan – FTKZ Model
📊 Market Sentiment
After the sharp 10/10 crash triggered by Trump’s 100% tariff announcement on Chinese imports, altcoins saw heavy liquidations some exceeding -80%.
On 12/10, Vice President Vance clarified Trump’s remarks, causing a temporary rebound.
However, Trump’s 15/10 statement reaffirming a trade war with China reignited selling pressure.
Sentiment remains bearish, as volatility and geopolitical risk continue to shape short-term direction.
📈 Technical Analysis
ETH maintains a bullish structure on the weekly timeframe.
If the weekly candle closes below 3350$, it would signal a potential bearish reversal.
Price is currently retracing toward the HTF Key Zone, aligning with both an FFVG and HTF trendline confluence ideal for long setups if support holds.
📘 Model to be used – FTKZ Model (HTF FFVG + Trendline + Key Zone)
1️⃣ Determine the HTF weekly trend — trade only in that direction.
2️⃣ Identify the HTF Fair Value Gap (FFVG) that price may rebalance.
3️⃣ Confirm confluence with HTF trendline support.
4️⃣ Locate the HTF Key Zone showing strong order flow.
5️⃣ Enter after LTF confirmation.
📌 Game Plan
I will be watching ETH to test the 3350$ HTF Key Zone (weekly swing liquidity & monthly FFVG).
If the weekly close forms back above 3350$, I will expect continuation toward higher levels.
🎯 Setup Trigger
Weekly close above 3350$ confirming bullish continuation.
📋 Trade Management
Stoploss: Weekly close below 3350$
Targets: TP1: 4300$ | TP2: Bearish Trendline
Move stoploss to breakeven after TP1 hits.
💬 Like, follow, and comment if this breakdown supports your trading! More setups and market insights coming soon — stay connected!
⚠️ Disclaimer: This content is for informational and educational purposes only and does not constitute financial, investment, or trading advice. Always DYOR before making any financial decisions.

BTCUSD H4 | Bearish Reversal UnfoldingBitcoin (BTC/USD) has reacted off the sell entry, which is a pullback resistance, and could drop from this level to the downside.
Sell entry is at 113,026.28, which is a oullback resistance.
Stop loss is at 117,878.92, whichis a pullback resistance.
Take profit is at 106,045.28, which is a pullback support.
High Risk Investment Warning
Trading Forex/CFDs on margin carries a high level of risk and may not be suitable for all investors. Leverage can work against you.
Stratos Markets Limited (tradu.com ):
CFDs are complex instruments and come with a high risk of losing money rapidly due to leverage. 65% of retail investor accounts lose money when trading CFDs with this provider. You should consider whether you understand how CFDs work and whether you can afford to take the high risk of losing your money.
Stratos Europe Ltd (tradu.com ):
CFDs are complex instruments and come with a high risk of losing money rapidly due to leverage. 66% of retail investor accounts lose money when trading CFDs with this provider. You should consider whether you understand how CFDs work and whether you can afford to take the high risk of losing your money.
Stratos Global LLC (tradu.com ):
Losses can exceed deposits.
Please be advised that the information presented on TradingView is provided to Tradu (‘Company’, ‘we’) by a third-party provider (‘TFA Global Pte Ltd’). Please be reminded that you are solely responsible for the trading decisions on your account. There is a very high degree of risk involved in trading. Any information and/or content is intended entirely for research, educational and informational purposes only and does not constitute investment or consultation advice or investment strategy. The information is not tailored to the investment needs of any specific person and therefore does not involve a consideration of any of the investment objectives, financial situation or needs of any viewer that may receive it. Kindly also note that past performance is not a reliable indicator of future results. Actual results may differ materially from those anticipated in forward-looking or past performance statements. We assume no liability as to the accuracy or completeness of any of the information and/or content provided herein and the Company cannot be held responsible for any omission, mistake nor for any loss or damage including without limitation to any loss of profit which may arise from reliance on any information supplied by TFA Global Pte Ltd.
The speaker(s) is neither an employee, agent nor representative of Tradu and is therefore acting independently. The opinions given are their own, constitute general market commentary, and do not constitute the opinion or advice of Tradu or any form of personal or investment advice. Tradu neither endorses nor guarantees offerings of third-party speakers, nor is Tradu responsible for the content, veracity or opinions of third-party speakers, presenters or participants.

ETHUSD H4 | Bullish Reversal FormationEthereum (RTH/USD) is falling towards the buy entry, which is a pullback support that aligns with the 61.8% Fibonacci projection and the 127.2% Fibonacci extension, and could bounce from this level to the take profit.
Buy entry is at 3,712.02, which is a pullback support that aligns with the 61.8% Fibonacci projection and the 127.2% Fibonacci extension.
Stop loss is at 3,514.48, whichis a pullback support.
Take profit is at 4,2756.43, which is a pullback resistance.
High Risk Investment Warning
Trading Forex/CFDs on margin carries a high level of risk and may not be suitable for all investors. Leverage can work against you.
Stratos Markets Limited (tradu.com ):
CFDs are complex instruments and come with a high risk of losing money rapidly due to leverage. 65% of retail investor accounts lose money when trading CFDs with this provider. You should consider whether you understand how CFDs work and whether you can afford to take the high risk of losing your money.
Stratos Europe Ltd (tradu.com ):
CFDs are complex instruments and come with a high risk of losing money rapidly due to leverage. 66% of retail investor accounts lose money when trading CFDs with this provider. You should consider whether you understand how CFDs work and whether you can afford to take the high risk of losing your money.
Stratos Global LLC (tradu.com ):
Losses can exceed deposits.
Please be advised that the information presented on TradingView is provided to Tradu (‘Company’, ‘we’) by a third-party provider (‘TFA Global Pte Ltd’). Please be reminded that you are solely responsible for the trading decisions on your account. There is a very high degree of risk involved in trading. Any information and/or content is intended entirely for research, educational and informational purposes only and does not constitute investment or consultation advice or investment strategy. The information is not tailored to the investment needs of any specific person and therefore does not involve a consideration of any of the investment objectives, financial situation or needs of any viewer that may receive it. Kindly also note that past performance is not a reliable indicator of future results. Actual results may differ materially from those anticipated in forward-looking or past performance statements. We assume no liability as to the accuracy or completeness of any of the information and/or content provided herein and the Company cannot be held responsible for any omission, mistake nor for any loss or damage including without limitation to any loss of profit which may arise from reliance on any information supplied by TFA Global Pte Ltd.
The speaker(s) is neither an employee, agent nor representative of Tradu and is therefore acting independently. The opinions given are their own, constitute general market commentary, and do not constitute the opinion or advice of Tradu or any form of personal or investment advice. Tradu neither endorses nor guarantees offerings of third-party speakers, nor is Tradu responsible for the content, veracity or opinions of third-party speakers, presenters or participants.

BCHUSD H4 | Bearish Reversal in PlayBCH/USD has rejected off the sell level, which is an overhead resistance could drop this level to the downside.
Sel entry is at 534.31
Stop loss is at 567.75, which is a pullback resistance that aligns with the 61.8% Fibonacci retracement.
Take profit is at 490.25, which is a pullback support that aligns with the 61.8% Fibonacci projection.
High Risk Investment Warning
Trading Forex/CFDs on margin carries a high level of risk and may not be suitable for all investors. Leverage can work against you.
Stratos Markets Limited (tradu.com ):
CFDs are complex instruments and come with a high risk of losing money rapidly due to leverage. 65% of retail investor accounts lose money when trading CFDs with this provider. You should consider whether you understand how CFDs work and whether you can afford to take the high risk of losing your money.
Stratos Europe Ltd (tradu.com ):
CFDs are complex instruments and come with a high risk of losing money rapidly due to leverage. 66% of retail investor accounts lose money when trading CFDs with this provider. You should consider whether you understand how CFDs work and whether you can afford to take the high risk of losing your money.
Stratos Global LLC (tradu.com ):
Losses can exceed deposits.
Please be advised that the information presented on TradingView is provided to Tradu (‘Company’, ‘we’) by a third-party provider (‘TFA Global Pte Ltd’). Please be reminded that you are solely responsible for the trading decisions on your account. There is a very high degree of risk involved in trading. Any information and/or content is intended entirely for research, educational and informational purposes only and does not constitute investment or consultation advice or investment strategy. The information is not tailored to the investment needs of any specific person and therefore does not involve a consideration of any of the investment objectives, financial situation or needs of any viewer that may receive it. Kindly also note that past performance is not a reliable indicator of future results. Actual results may differ materially from those anticipated in forward-looking or past performance statements. We assume no liability as to the accuracy or completeness of any of the information and/or content provided herein and the Company cannot be held responsible for any omission, mistake nor for any loss or damage including without limitation to any loss of profit which may arise from reliance on any information supplied by TFA Global Pte Ltd.
The speaker(s) is neither an employee, agent nor representative of Tradu and is therefore acting independently. The opinions given are their own, constitute general market commentary, and do not constitute the opinion or advice of Tradu or any form of personal or investment advice. Tradu neither endorses nor guarantees offerings of third-party speakers, nor is Tradu responsible for the content, veracity or opinions of third-party speakers, presenters or participants.
