LTCUSD H4 | Could We See a Bullish Reversal?Litecoin has bounced off the buy entry which is a pullback support and could rise from this level to the upside.
Buy entry is at 97.36, which i a pullback support.
Stop loss is at 90.92, which is an overlap support that aligns with the 127.2% Fibonacci extension.
Take profit is at 111.13, which is a pullback resistance that lines up with the 38.2% Fibonacci retracement.
High Risk Investment Warning
Trading Forex/CFDs on margin carries a high level of risk and may not be suitable for all investors. Leverage can work against you.
Stratos Markets Limited (tradu.com ):
CFDs are complex instruments and come with a high risk of losing money rapidly due to leverage. 65% of retail investor accounts lose money when trading CFDs with this provider. You should consider whether you understand how CFDs work and whether you can afford to take the high risk of losing your money.
Stratos Europe Ltd (tradu.com ):
CFDs are complex instruments and come with a high risk of losing money rapidly due to leverage. 66% of retail investor accounts lose money when trading CFDs with this provider. You should consider whether you understand how CFDs work and whether you can afford to take the high risk of losing your money.
Stratos Global LLC (tradu.com ):
Losses can exceed deposits.
Please be advised that the information presented on TradingView is provided to Tradu (‘Company’, ‘we’) by a third-party provider (‘TFA Global Pte Ltd’). Please be reminded that you are solely responsible for the trading decisions on your account. There is a very high degree of risk involved in trading. Any information and/or content is intended entirely for research, educational and informational purposes only and does not constitute investment or consultation advice or investment strategy. The information is not tailored to the investment needs of any specific person and therefore does not involve a consideration of any of the investment objectives, financial situation or needs of any viewer that may receive it. Kindly also note that past performance is not a reliable indicator of future results. Actual results may differ materially from those anticipated in forward-looking or past performance statements. We assume no liability as to the accuracy or completeness of any of the information and/or content provided herein and the Company cannot be held responsible for any omission, mistake nor for any loss or damage including without limitation to any loss of profit which may arise from reliance on any information supplied by TFA Global Pte Ltd.
The speaker(s) is neither an employee, agent nor representative of Tradu and is therefore acting independently. The opinions given are their own, constitute general market commentary, and do not constitute the opinion or advice of Tradu or any form of personal or investment advice. Tradu neither endorses nor guarantees offerings of third-party speakers, nor is Tradu responsible for the content, veracity or opinions of third-party speakers, presenters or participants.
Cryptomarket

SOLUSD H4 | Bullish ReversalSOL/USD is reacting off the buy entry which is a pullback support and oculd rise from this level to the upside.
Buy entry is at 204.32, which is a pullback support.
Stop loss is at 187.97, which is an overlap support.
Take profit is at 228.36, which is an overlap resistance that aligns with the 78.6% Fibonacci retracement.
High Risk Investment Warning
Trading Forex/CFDs on margin carries a high level of risk and may not be suitable for all investors. Leverage can work against you.
Stratos Markets Limited (tradu.com ):
CFDs are complex instruments and come with a high risk of losing money rapidly due to leverage. 65% of retail investor accounts lose money when trading CFDs with this provider. You should consider whether you understand how CFDs work and whether you can afford to take the high risk of losing your money.
Stratos Europe Ltd (tradu.com ):
CFDs are complex instruments and come with a high risk of losing money rapidly due to leverage. 66% of retail investor accounts lose money when trading CFDs with this provider. You should consider whether you understand how CFDs work and whether you can afford to take the high risk of losing your money.
Stratos Global LLC (tradu.com ):
Losses can exceed deposits.
Please be advised that the information presented on TradingView is provided to Tradu (‘Company’, ‘we’) by a third-party provider (‘TFA Global Pte Ltd’). Please be reminded that you are solely responsible for the trading decisions on your account. There is a very high degree of risk involved in trading. Any information and/or content is intended entirely for research, educational and informational purposes only and does not constitute investment or consultation advice or investment strategy. The information is not tailored to the investment needs of any specific person and therefore does not involve a consideration of any of the investment objectives, financial situation or needs of any viewer that may receive it. Kindly also note that past performance is not a reliable indicator of future results. Actual results may differ materially from those anticipated in forward-looking or past performance statements. We assume no liability as to the accuracy or completeness of any of the information and/or content provided herein and the Company cannot be held responsible for any omission, mistake nor for any loss or damage including without limitation to any loss of profit which may arise from reliance on any information supplied by TFA Global Pte Ltd.
The speaker(s) is neither an employee, agent nor representative of Tradu and is therefore acting independently. The opinions given are their own, constitute general market commentary, and do not constitute the opinion or advice of Tradu or any form of personal or investment advice. Tradu neither endorses nor guarantees offerings of third-party speakers, nor is Tradu responsible for the content, veracity or opinions of third-party speakers, presenters or participants.

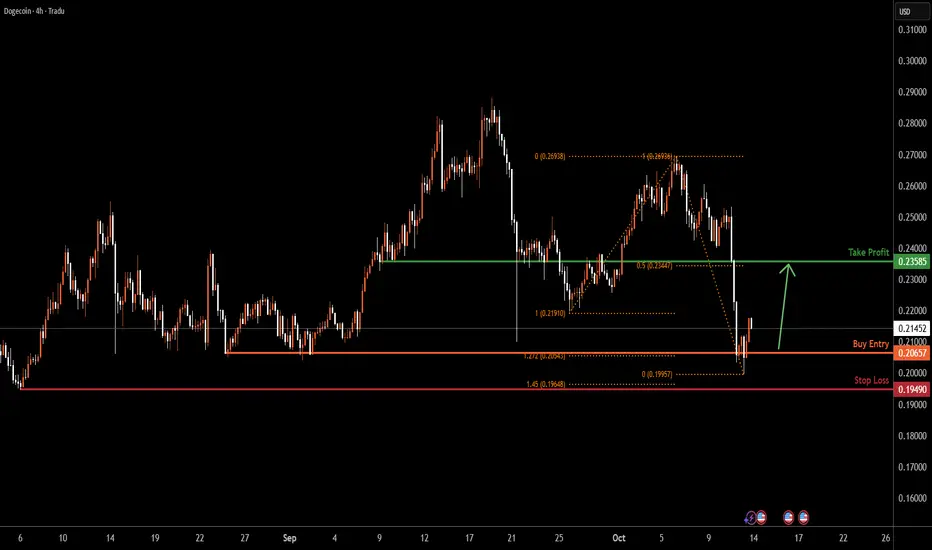
DOGEUSD H4 | Bullish ReversalBased on the H4 chart analysis, we can see that the price has bounced off the buy entry which is a multi-swings glow support that aligns with the 127.2% Fibonacci extension and could potentially rise from this level to the upside.
Buy entry is at 0.20657, which is a multi swing low support that aligns with the 127.2% Fibonacci extension.
Stop loss is at 0.19490, which is a pullback support that lines up with the 145% Fibonacci extension.
Take profit is at 0.23585, which is an overlap resistance that aligns with the 50% Fibonacci retracement.
High Risk Investment Warning
Trading Forex/CFDs on margin carries a high level of risk and may not be suitable for all investors. Leverage can work against you.
Stratos Markets Limited (tradu.com ):
CFDs are complex instruments and come with a high risk of losing money rapidly due to leverage. 65% of retail investor accounts lose money when trading CFDs with this provider. You should consider whether you understand how CFDs work and whether you can afford to take the high risk of losing your money.
Stratos Europe Ltd (tradu.com ):
CFDs are complex instruments and come with a high risk of losing money rapidly due to leverage. 66% of retail investor accounts lose money when trading CFDs with this provider. You should consider whether you understand how CFDs work and whether you can afford to take the high risk of losing your money.
Stratos Global LLC (tradu.com ):
Losses can exceed deposits.
Please be advised that the information presented on TradingView is provided to Tradu (‘Company’, ‘we’) by a third-party provider (‘TFA Global Pte Ltd’). Please be reminded that you are solely responsible for the trading decisions on your account. There is a very high degree of risk involved in trading. Any information and/or content is intended entirely for research, educational and informational purposes only and does not constitute investment or consultation advice or investment strategy. The information is not tailored to the investment needs of any specific person and therefore does not involve a consideration of any of the investment objectives, financial situation or needs of any viewer that may receive it. Kindly also note that past performance is not a reliable indicator of future results. Actual results may differ materially from those anticipated in forward-looking or past performance statements. We assume no liability as to the accuracy or completeness of any of the information and/or content provided herein and the Company cannot be held responsible for any omission, mistake nor for any loss or damage including without limitation to any loss of profit which may arise from reliance on any information supplied by TFA Global Pte Ltd.
The speaker(s) is neither an employee, agent nor representative of Tradu and is therefore acting independently. The opinions given are their own, constitute general market commentary, and do not constitute the opinion or advice of Tradu or any form of personal or investment advice. Tradu neither endorses nor guarantees offerings of third-party speakers, nor is Tradu responsible for the content, veracity or opinions of third-party speakers, presenters or participants.
BCHUSD H4| Bullish Bounce Off Major SupportBCH/USD has bounced off the buy entry which is a multi-swing low support and could rise from this level to the upside.
Buy entry is at 527.26, which is a multi-swing low support.
Stop loss is at 509.38, which is a pullback support that aligns with the 127.2% Fibonacci extension.
Take profit is at 566.31, which is a pullback resistance that lines up with the 50% Fibonacci retracement.
High Risk Investment Warning
Trading Forex/CFDs on margin carries a high level of risk and may not be suitable for all investors. Leverage can work against you.
Stratos Markets Limited (tradu.com ):
CFDs are complex instruments and come with a high risk of losing money rapidly due to leverage. 65% of retail investor accounts lose money when trading CFDs with this provider. You should consider whether you understand how CFDs work and whether you can afford to take the high risk of losing your money.
Stratos Europe Ltd (tradu.com ):
CFDs are complex instruments and come with a high risk of losing money rapidly due to leverage. 66% of retail investor accounts lose money when trading CFDs with this provider. You should consider whether you understand how CFDs work and whether you can afford to take the high risk of losing your money.
Stratos Global LLC (tradu.com ):
Losses can exceed deposits.
Please be advised that the information presented on TradingView is provided to Tradu (‘Company’, ‘we’) by a third-party provider (‘TFA Global Pte Ltd’). Please be reminded that you are solely responsible for the trading decisions on your account. There is a very high degree of risk involved in trading. Any information and/or content is intended entirely for research, educational and informational purposes only and does not constitute investment or consultation advice or investment strategy. The information is not tailored to the investment needs of any specific person and therefore does not involve a consideration of any of the investment objectives, financial situation or needs of any viewer that may receive it. Kindly also note that past performance is not a reliable indicator of future results. Actual results may differ materially from those anticipated in forward-looking or past performance statements. We assume no liability as to the accuracy or completeness of any of the information and/or content provided herein and the Company cannot be held responsible for any omission, mistake nor for any loss or damage including without limitation to any loss of profit which may arise from reliance on any information supplied by TFA Global Pte Ltd.
The speaker(s) is neither an employee, agent nor representative of Tradu and is therefore acting independently. The opinions given are their own, constitute general market commentary, and do not constitute the opinion or advice of Tradu or any form of personal or investment advice. Tradu neither endorses nor guarantees offerings of third-party speakers, nor is Tradu responsible for the content, veracity or opinions of third-party speakers, presenters or participants.

DGBUSD - DigiByte, the Hidden GemThis is an idea based on the DGBUSD chart 1W log using Fibs levels and Bars Patterns.
DigiByte is known as the most decentralized coin on the market. Open Source, better tech than Bitcoin, smart contracts, decentralized applications and secure authentication, make DGB a True Gem.
Rumors about the incoming DigiDollar stable coin and years of accumulation could skyrocket soon the demand. DigiByte is ready for a 100-200x
This is not a financial advice. Do Your Own Research

Altseason on the Horizon?Technically, BTC Dominance has retested the breakdown of the rising channel, confirming a clean rejection from the retest area.
If price manages to break below the current support zone, we could see a strong shift toward altcoins as capital starts rotating out of BTC.
This recent move also flushed out over-leveraged traders, resetting market positioning, a healthy sign before the next major leg.
Stay patient and always analyze your risk before entering any position. The next few weeks could be decisive for the altcoin market.
DYOR, NFA
Stay tuned for more update
THANKS FOR THE READING
#PEACE

Bitcoin: Bull Trend Intact, Wedge Breakout Setting UpWe’re pivoting back to Bitcoin (BTCUSD) this week after its recent breakout to fresh all-time highs. It’s a strong reminder that the broader trend remains bullish, and the bulls are still very much in control.
🔍 On the daily chart, we’re watching a new wedge formation develop. BTC is currently consolidating just beneath a major resistance zone. A break and daily close above the $124K–$125K range would likely confirm the next leg of this bull cycle.
📈 If the breakout holds, the measured move from the wedge projects a rally into the $138K–$140K zone. That’s our near-term upside target, contingent on momentum and confirmation.
📉 On the downside, support holds firm between $112K–$114K. As long as price remains above this level, the path of least resistance is still higher.
Up onlyWe are at the light blue cross.
August 2020 after heavy deleverage, precious metals in ATH while Governments of the world are easing.
Dollar should fall a little more from here.
Tech and crypto will continue higher while commodities go up but underperform.
Cheers.

TradeCityPro | Bitcoin Daily Analysis #195👋 Welcome to TradeCity Pro!
Let’s move on to Bitcoin analysis. Yesterday, price started an upward move, so let’s see what triggers we have today.
⌛️ 1-Hour Timeframe
Yesterday, price found support at our key zone and also activated the 112,420 risk trigger we had identified.
✨ If you opened a position, it’s not a bad time to take profits, since this was a risky setup, and such positions should be managed quickly.
🧮 Currently, a resistance high has formed around 115,698. If this level breaks, price could continue its upward movement.
💫 As long as price stays above 112,420, this trigger remains active and can be used to open positions.
✔️ For shorts, I personally won’t be taking any until price breaks below 107,000 and stabilizes under that zone.
❌ Disclaimer ❌
Trading futures is highly risky and dangerous. If you're not an expert, these triggers may not be suitable for you. You should first learn risk and capital management. You can also use the educational content from this channel.
Finally, these triggers reflect my personal opinions on price action, and the market may move completely against this analysis. So, do your own research before opening any position.

TradeCityPro | BNB Surges Beyond All-Time Highs👋 Welcome to TradeCity Pro!
In this analysis, I’m going to review BNB, the official token of Binance Exchange, which currently holds the #3 spot on CoinMarketCap with a market capitalization of $188 billion.
⌛️ 4-Hour Timeframe
On the 4-hour chart, after the broad market downturn, this coin managed to recover very well. Supported from the 1100 zone, BNB began to move upward again.
📊 A risky long trigger appeared on the lower timeframes around 1143, and if you entered based on that trigger, your position should now be sitting in good profit.
🎲 BNB has now broken through its all-time high after surpassing 1317, and the next corrective wave could potentially begin from here.
✔️ So far, the volume and momentum have both been strong, and there are no signs of weakness in the trend yet—meaning the upward movement can still continue.
✨ However, if this move turns out to be a fake breakout and the price stabilizes below 1317, BNB could enter a longer corrective phase. In that case, with confirmation of the fake breakout below 1317, a short position could also be considered.
📝 Final Thoughts
Stay calm, trade wisely, and let's capture the market's best opportunities!
This analysis reflects our opinions and is not financial advice.
Share your thoughts in the comments, and don’t forget to share this analysis with your friends! ❤️

AVAX Ignites Bias: Long
Timeframe: 15-min (scalp to intraday swing)
Not a financial advice. Just sharing my personal setup and observations.
Always DYOR, manage your risk, and trade safe.

BTCUSD: Buy signal forming📊 BITSTAMP:BTCUSD Analysis – October 13, 2025
🔁 Last Week Summary
Last week, we successfully completed the BTC Sell plan,
and the trade reached its target as expected.
📈 Market Outlook for the New Week
After a deep correction, BTC is showing signs of recovery.
Currently trading around 115,561, above the EMA,
indicating that a short-term bullish structure is forming.
🧭 Trading Plan for Today
Scenario 1 – Buy with trend:
Wait for a pullback to EMA and look for a DD (Double Doji) setup.
If confirmation appears near EMA → enter long following the bullish momentum.
Profit target for long position is 2R or more.
Scenario 2 – No setup / breakdown below EMA:
If price fails to form DD and closes back below EMA,
it may lead to the formation of a wider consolidation range.
In this case, stay on the sidelines and wait for clear trading signals before entering.
🎯 Summary:
Short-term bias: Slightly bullish, pending confirmation.
Key plan: Buy near EMA if DD forms.
If price breaks below EMA → expect wider accumulation, stay patient.
Please like and comment below to support our traders. Your reactions motivate us to do more analysis in the future 🙏✨
Daniel Miller @ ZuperView

BTCUSD: 1R secured, looking for next short signal📊 BITSTAMP:BTCUSD Analysis – October 10, 2025
🔁 Current Position Update
The Sell position from October 8 remains active and profitable.
The trade is currently up around 1R.
Traders can move stop-loss to breakeven to secure profits and eliminate downside risk.
📈 Market Outlook & Trading Plan
Trend bias remains bearish.
The main plan for today: continue looking for short entries in line with the trend.
On the H2 timeframe:
Price has closed below the EMA, confirming ongoing bearish momentum.
Wait for DD (Double Doji) or SB (Second Breakout) setup as confirmation for the next Sell opportunity.
For traders already holding positions, consider DCA add-on entries to compound profits if the downtrend extends further.
⚙️ Position Managemen t
The current trade remains safe and in profit.
Monitor price reaction near the H2 EMA for possible re-entry setups.
Avoid impulsive entries – focus only on clear signals with a proper R:R structure.
🎯 Summary:
The active Sell trade has reached 1R – stop can be moved to breakeven.
Continue monitoring for DD/SB setups on H2 to scale in or add new short positions in line with the trend.
You can refer to my previous analysis here:
Please like and comment below to support our traders. Your reactions motivate us to do more analysis in the future 🙏✨
Daniel Miller @ ZuperView

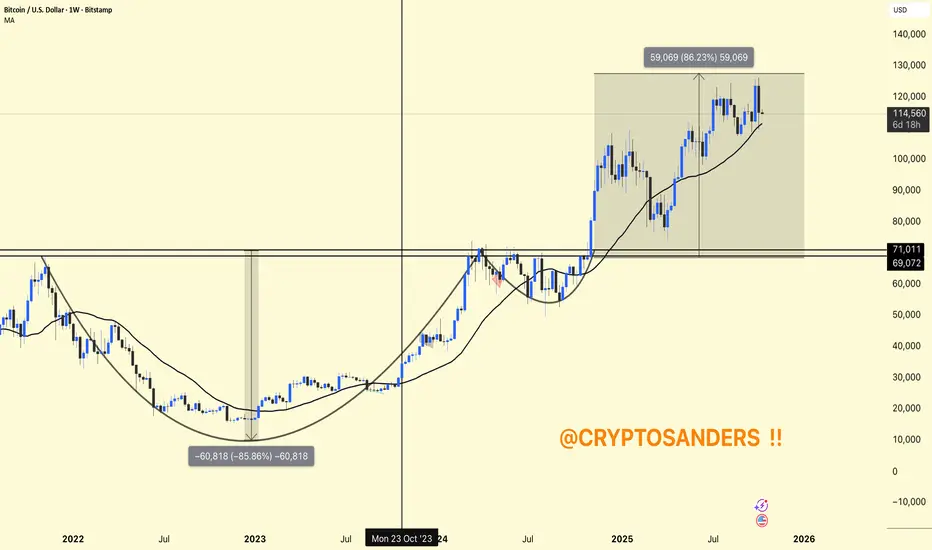
BTC/USDT Weekly Chart !!BTC/USDT Weekly Chart
Structure: The chart shows a complete market cycle – a deep correction (approximately -85%), followed by a strong recovery and breakout.
Current Area: Bitcoin is trading around $114K–$115K, holding above the 111K weekly MA (support).
Previous Resistance: The $69K–$71K area (old ATH) has now turned into a strong support zone.
Upward Momentum: From the breakout point (~$71K) to the recent high (~$130K), BTC gained approximately +86%, indicating strong bullish momentum.
Perspective: As long as the price remains above the $111K MA and does not lose support at $100K, the overall trend will remain bullish, and a retest of $130K–$135K is possible.
DYOR | NFA
Rebound in Motion: XLM Eyes Channel Top AgainCRYPTOCAP:XLM has bounced strongly from the lower trendline and re-entered the channel.
This move shows clear buyer strength and a potential shift in short-term momentum. As long as XLM holds within the channel, a retest of the upper boundary looks likely.

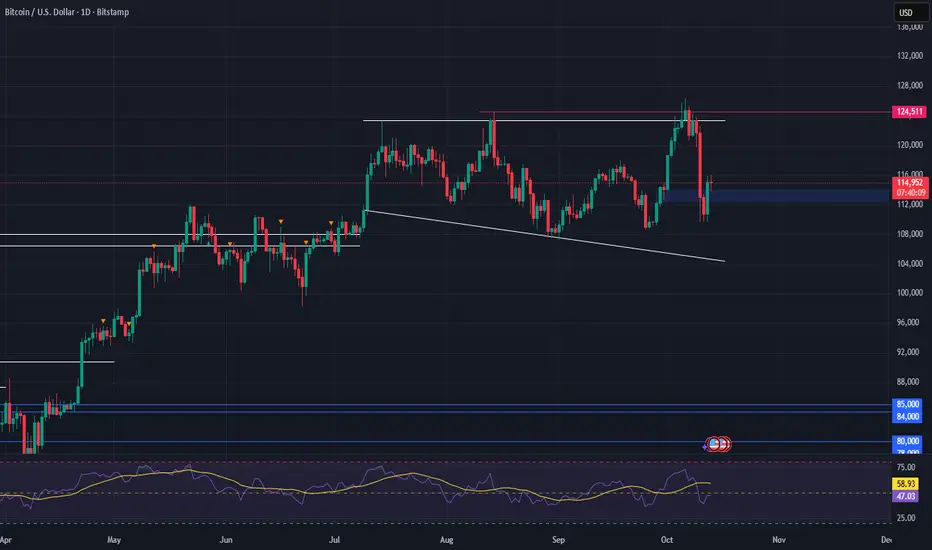
Bearish reversal off pullback resistance?The Bitcoin (BTC/USD) is rising towards the pivot which acts as a pullback resistance and could reverse to the 1st support which aligns with the 138.2% Fibonacci extension.
Pivot: 117,432.32
1st Support: 101,396.53
1st Resistance: 125,524.83
Disclaimer:
The above opinions given constitute general market commentary, and do not constitute the opinion or advice of IC Markets or any form of personal or investment advice.
Any opinions, news, research, analyses, prices, other information, or links to third-party sites contained on this website are provided on an "as-is" basis, are intended only to be informative, is not an advice nor a recommendation, nor research, or a record of our trading prices, or an offer of, or solicitation for a transaction in any financial instrument and thus should not be treated as such. The information provided does not involve any specific investment objectives, financial situation and needs of any specific person who may receive it. Please be aware, that past performance is not a reliable indicator of future performance and/or results. Past Performance or Forward-looking scenarios based upon the reasonable beliefs of the third-party provider are not a guarantee of future performance. Actual results may differ materially from those anticipated in forward-looking or past performance statements. IC Markets makes no representation or warranty and assumes no liability as to the accuracy or completeness of the information provided, nor any loss arising from any investment based on a recommendation, forecast or any information supplied by any third-party.

Bitcoin Faces Sudden Shakeout After Weeks of CalmBitcoin Volatility Returns as Market Momentum Resets
Hello Traders,
The Bitcoin market experienced a sudden burst of volatility in the recent session, ending a period of relative calm. On the 4H timeframe (Binance), intense selling pressure drove prices from near $117,000 down to roughly $109,000 before stabilizing around the $112K region. The swift decline marked a clear shift in short-term momentum, showing that buyers are beginning to lose dominance as broader market sentiment cools.
This pullback unfolded against a backdrop of renewed global uncertainty. A series of trade-related policy headlines reignited risk aversion, while continued strength in the U.S. dollar added additional stress to crypto markets. Institutional flows briefly reversed, signaling reduced confidence in near-term upside potential. The result was a wave of forced liquidations, magnified by leverage, as traders rushed to adjust exposure during the drop.
Despite the intensity of the move, market conditions remain structurally healthy. On-chain data shows that long-term holders are largely unmoved, suggesting this phase is more of a short-term repricing than a major cycle reversal. Derivative markets, however, have cooled significantly — open interest has thinned, and funding rates have normalized, indicating a temporary reset in speculative participation.
In the coming days, Bitcoin’s behavior will likely depend on liquidity dynamics rather than new macro data. With upcoming U.S. economic reports delayed and the dollar holding firm, volatility may persist as traders respond to headlines and reposition ahead of the next policy developments.
For now, the market appears to be in a state of balance after rapid liquidation. Whether this forms a new accumulation base or precedes deeper correction will depend on how quickly momentum returns. The broader sentiment remains cautious but stable — a waiting phase, as the market tests its conviction once more.

BTC Game Plan - DTB ModelBTC Game Plan – DTB Model
📊 Market Sentiment
After the sharp 10/10 crash triggered by Trump’s announcement of up to 100% tariffs on Chinese imports, risk assets — especially altcoins — faced massive liquidation, with some dropping over 80%.
As of 12/10, headlines indicate that Trump may reach out to President Xi, with Vice President Vance clarifying the statement. The market reacted bullishly, showing a strong rebound.
However, sentiment remains neutral, as volatility persists and geopolitical uncertainty continues to influence short-term direction.
📈 Technical Analysis
BTC retraced into the HTF Demand Zone, running the daily swing liquidity inside it.
Additionally, price retested the bearish trendline, confirming it as a key technical pivot.
Currently, BTC is attempting to recover toward the equilibrium (0.5 Fibonacci) of the recent decline.
📘 Model to be used – Demand to Trendline Break (DTB Model)
1-Identify HTF trend and valid demand zones.
2-Wait for liquidity sweep inside demand for energy confirmation.
3-Watch for price recovery toward equilibrium (0.5 fib).
4-Confirm with a strong close above bearish trendline and equilibrium for entry signal.
📌 Game Plan
I’ll be waiting for BTC to break and close above the 0.5 Fibonacci (equilibrium) and the orange bearish trendline. That will be the first confirmation that the bearish phase may end, and momentum may shift to the upside.
🎯 Setup Trigger
Daily strong close above the orange bearish trendline and 0.5 Fibonacci equilibrium level.
📋 Trade Management
Stoploss: Below $107,500 (protecting capital is more important than chasing profits)
Target: $126,300 (near previous all-time highs)
💬 Like, follow, and comment if this breakdown supports your trading! More setups and market insights coming soon — stay connected!
⚠️ Disclaimer: This content is for informational and educational purposes only and does not constitute financial, investment, or trading advice. Always DYOR before making any financial decisions.

ETH 1D AnalysisCRYPTOCAP:ETH is at crucial zone. Still supporting long term daily trend line.
Rejection from here can lead to the levels down as shown on the chart.
Stay Cautious.

BTC 1D AnalysisBitcoin is still at the support of Up trendline on daily timeframe. Hopes are still alive.
Also we can say it is on the support zone. If you wish to take trade on any side please confirm it on 4H once.

TradeCityPro | Bitcoin Daily Analysis #194👋 Welcome to TradeCity Pro!
Let’s analyze Bitcoin today, the market has calmed down a bit, and we can perform some analysis.
⏳ 1-Hour Timeframe
In the 1-hour timeframe, Bitcoin has reached a support level around $109,000 and has shown a reaction to this level.
⭐ After the heavy drop that occurred two days ago, the open interest and market volume have decreased significantly, which clearly indicates that market participants are currently indecisive.
✨ Yesterday, the price reacted to the support zone on Bitcoin, and a significant resistance was created around $112,420, which it has now reached again.
💥 The RSI oscillator has finally moved out of the Oversell zone, and it’s currently below the 50 level.
🧮 Although there’s still fear and a bearish momentum in the market, breaking the $112,420 resistance could be a very risky long trigger.
✔️ Personally, I’m waiting and observing. However, for those who like to open positions every day, breaking this resistance is the only long trigger I can provide.
💡 For a short position, we could enter after the price breaks below the level. I’m passing on this position for now and will wait for a confirmation to search for a short trigger after the price stabilizes below this zone.
❌ Disclaimer ❌
Trading futures is highly risky and dangerous. If you're not an expert, these triggers may not be suitable for you. You should first learn risk and capital management. You can also use the educational content from this channel.
Finally, these triggers reflect my personal opinions on price action, and the market may move completely against this analysis. So, do your own research before opening any position.

Bitcoin Bullish Confirmation Above $119500 | Watch November MoveBitcoin is currently trading below a key resistance level of **$114,500**, and a **strong Monday closing on 13 October above this level** is crucial for confirming a short-term bullish recovery.
If BTC successfully closes above **$114,500**, the next important resistance will be around **$119,500**.
A **Monday closing on 20 October above $119,500** would confirm a temporary bullish structure, giving Bitcoin the strength to test higher levels toward the **$127,600 liquidity zone** in November.
Currently, major liquidity is sitting near **$124,600 and $127,600**, which might attract price movement before any major reversal begins.
The market has already taken liquidity around **$101,000**, trapping retail sellers — and now, it may move up to grab the **short-side liquidity** before the next larger downtrend begins.
⚠️ **Be patient and stay disciplined. Avoid long positions for now.**
Focus on the market’s move toward the top, and prepare for **short positions near the highs** to capture the **2026 bear market** — which is expected to last from **September to November 2026**.
📊 The market often manipulates both sides before showing the real direction. Watch levels carefully and trade with confirmation.
💬 **Follow me on TradingView** for more Bitcoin and Ethereum updates — and comment below which coin you’d like me to analyze next!

XRPUSD: From Panic to Opportunity - The Drop I'm Waiting ForGood morning everyone and Happy Sunday once again. Last Friday was a mess for a lot of us who hold long positions. But sometimes these sudden big drops creates opportunities for those who are patiently waiting.
I only have two cryptos that I kept buying every time it tested the 200MA. These are BITSTAMP:BTCUSD and BITSTAMP:ETHUSD and I considered it as my long term investments.
BITSTAMP:XRPUSD was supposed to be my 3rd one but because of the legal history happened between Ripple and US S.E.C. I stayed away.
These dispute was settled and won by Ripple last 2023, and honestly I missed the train when XRP breakouts after the US election last year.
For those who wants to understand BITSTAMP:XRPUSD , here's some quick points:
XRP is a cryptocurrency created by Ripple Labs. Its main goal isn’t to replace traditional money — it’s to make global money transfers faster and cheaper, especially between banks and financial institutions.
Here’s the core idea:
When you send money internationally through traditional systems (like SWIFT), it’s slow, expensive, and goes through several intermediaries.
Ripple built the XRP Ledger (XRPL) — a blockchain that can settle cross-border payments in seconds, at a fraction of a penny per transaction.
XRP acts as a bridge currency — meaning it can be used to instantly convert one fiat currency to another (say USD → EUR or PHP → CAD) without holding both in reserve.
XRP usage is a big game changer and I think bank institutions could or might adapt the system - who knows.
Last Friday, I bought my first XRP when I saw the big drop, I was really waiting for that sub $2.00 level but the price action was so fast and I ended up filled at $2.41-$2.45.
I think this will test back again from that Friday's low (Oct.10) which was at around $1.78- $1.80s and if that happens, I will add from that again. I know we shouldn't be averaging down but like I said from the beginning that I want this to hold long (like the same strategy I'm using for BTC and ETH).
As of this writing, XRP is trading at around $2.40s but I don't care. My exposure here is not that much plus I am really planning to add more at $1.80's, if for some reason it comes back there.
Just remember that to always manage your risk ok, watch your position size and most of all God Bless You all...
