LTC : ETFHello friends
Due to the US government shutdown and the Lit coin ETF request that has been raised and is being reviewed, when the government and relevant institutions reopen, it is most likely that the ETF will be approved and expected. Now that the price has corrected and the good decline we had, there is a good opportunity to buy in steps in the specified areas with capital and risk management and move with it to the specified goals.
*Trade safely with us*
Cryptomarket

No QE, No Alt SeasonIf we mirror the current setup to the 2019 QE playbook, altcoins could face significant selling pressure in the near term.
From last night’s Fed statement, the central bank confirmed it will halt balance sheet reduction (QT) on December 1st. While the market initially interpreted this as a risk-on signal for high-beta assets like altcoins, the implication may be less straightforward.
Ending QT is not the same as starting QE . It simply means the pace of liquidity withdrawal will stop, but it doesn’t imply new liquidity is being injected. Without active balance sheet expansion, the overall liquidity environment remains tight compared to a true QE phase.
Historically, when the Fed ended QT in 2019, the altcoin market dropped by roughly 42%, even as the S&P 500 rallied strongly. The real “altcoin season” only began after the Fed launched full-scale QE in March 2020, when balance sheet expansion accelerated and risk assets across the board surged.
Given that backdrop, halting QT alone is unlikely to trigger a broad altcoin rally. For altcoins to meaningfully outperform, one of the following would need to occur:
1. The Fed initiates a new QE cycle, which appears highly unlikely in the near term.
2. The U.S. Treasury releases liquidity via TGA (Treasury General Account) distributions, which is also improbable as long as the government shutdown persists.
My base case : From now until year-end, we expect continued pressure on the crypto market, with liquidity likely rotating toward equities instead.

Crypto will boom, BUT...In my view, the cryptocurrency market is poised for a significant multi-year rally.
However, such a rally cannot begin without a major transfer of capital, from weaker holders to large institutional players. This is why I believe we are likely to experience a sharp correction in the coming days or weeks, possibly extending toward the end of the year.
My outlook for this short-term downturn is driven by two key factors:
Persistent uncertainty surrounding the Federal Reserve’s next policy move, particularly whether it will proceed with an interest rate cut in December, and a bearish pattern emerging in the global money supply. After a notable recent decline, this formation suggests further contraction ahead.
The good news is that this potential market shakeout may serve as the final reset before Bitcoin establishes its bottom. Those who withstand the upcoming volatility will likely find themselves well-positioned for the next major bull run.
#bitcoin #crypto #finance #economy #market #analysis

Bitcoin Daily target hit and now, we wait for support to kick in
I drew that Circle around Late August and here we are, PA just entered it.
This Means that PA is now just above a Strong Long Term line of support that we bounced off well Earlier in the Year. . This line was tested a week or so ago and we bounced. This should happen again but maybe not this month.
The 2.768 Fib extension we are currently bouncing off, bumps into that rising line of support in the First week of November, around the 4th, a Tuesday.
PA is under that Local dashed line of local support.
The Daily MACD
This is in Oversold and has tried to bounce but is currently heading back towards its red signal line. We need to wait and see if this MACD bounces off it or not...But we should remember that the Weekly MACD is still falling Bearish above Neutral.
The Daily RSI
RSI is trying to bounce off its MA, testing it as support.
We did talk about a smaller bounce higher and then a turn lower a week or so ago.
This may have played out and a Move lower for Bitcoin Could happen if this support does not hold and a visit to the 95K area may occur, though I expect it to be A Wick down IF IT HAPPENS>
It does look like October will close RED and this may scare some people.
Interesting days ahead
We need to be patient and wait.
.

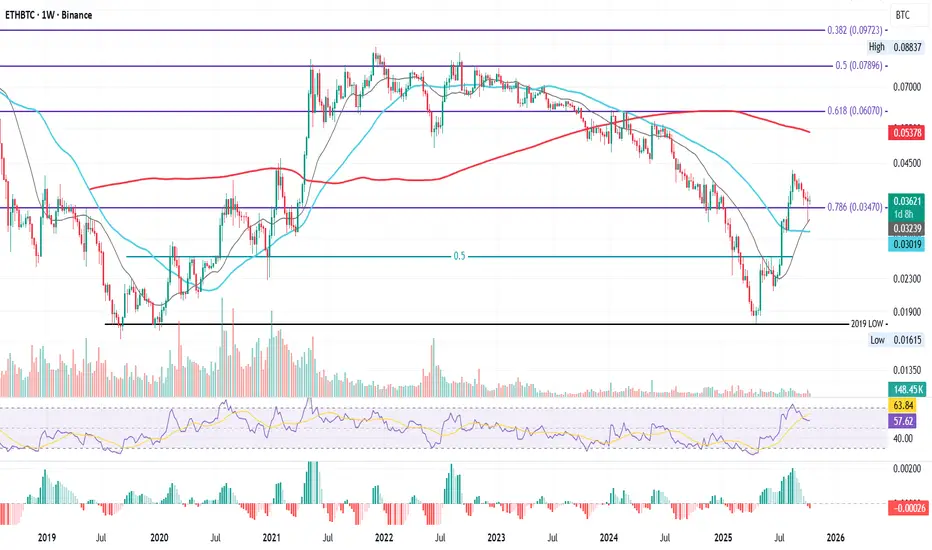
ETHBTC Weekly Series – Tracking the Shift, Week by WeekETHBTC Weekly – Confluence at the 0.786 Fib
This is ETHBTC on the weekly, now retesting one of the most important Fibonacci levels on the chart: the 0.786 Fib at 0.03470.
This time, price isn’t testing it alone. Just below, we have the 21-week MA and 50-week MA, both providing strong confluence. Last week’s flash crash on October 10th already tagged the 21-week MA, showing how reactive this area is for buyers.
This zone could serve as a structural base for a potential bounce toward higher resistance: such as the 200-week MA, or Fibonacci levels around 0.06–0.07. But for any of that to happen, price must hold here first.
That’s why, starting this week, I’ll be tracking this pair closely and updating this idea regularly, to better understand whether ETH can regain strength against BTC, and what that means for the altcoin market as a whole.
Because as history has shown:
when ETHBTC climbs, altcoins breathe again.
Right now, most alts look bruised after the flash crash, but some, especially those with real-world use cases, still hold long-term promise.
The key is timing.
And timing starts with ETHBTC holding this level.
Bias:
Neutral–bullish, strong confluence support, but confirmation needed through weekly close above 0.0347.
Always take profits and manage risk.
Interaction is welcome.
Ethereum Daily OutlookCOINBASE:ETHUSD Price is currently trading above the key structural line while respecting the latest bullish FVG. After the recent rejection 🧠 from the distribution zone, ETH shows early signs of accumulation within the grey mitigation block.
As long as price holds above
3,850–3,880, the bias remains long, targeting the upper FVG zones near 4,200–4,400.
A clean break below that block, however, could open the road toward the lower liquidity pool around 3,500–3,600, where a deeper accumulation phase might form.
The volume profile shows declining sell pressure signaling potential bullish reaccumulation before the next leg up.
📊 Key Zones:
• Accumulation: 3,850–3,880
• Distribution: 4,200–4,400
• FVG Targets: 4,250 / 4,450
• Invalidation: Below 3,800

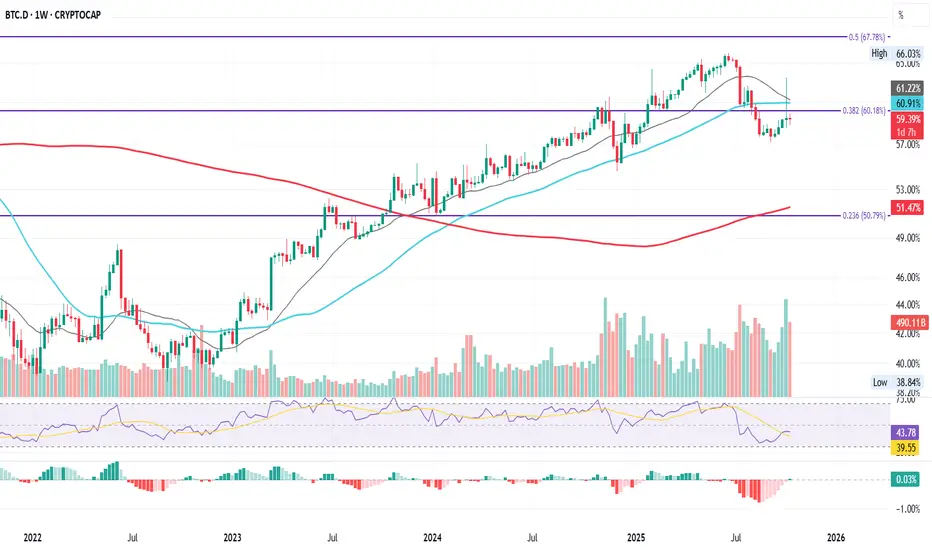
BTC.D Weekly Series – Tracking the 60% level , Week by Week
This is BTC Dominance (BTC.D) on the weekly.
After climbing steadily since January 2023, BTC.D followed both the 21-week (grey) and 50-week (cyan) MAs all the way up, reclaiming key Fibonacci levels at 50% (0.236 Fib) and 60% (0.382 Fib) before finally getting rejected at the 0.5 Fib near 67%.
That rejection in June 2025 marked a structural shift: BTC.D dropped below the 21W and 50W MAs, and back under the 0.382 Fib (60%).
Last week’s flash recovery briefly spiked above these levels, but failed to hold, closing back under.
This week’s candle is confirming that weakness again.
Until the 0.382 Fib turns into solid support, dominance remains technically in a downtrend: meaning capital might be slowly rotating away from BTC toward ETH and large-cap alts.
For traders, this level defines the next phase:
Hold above 60% → BTC continues to dominate.
Break lower → rotation and volatility spread wider across the market.
Either way, BTC.D is the map, and this chart is worth watching closely in the coming weeks.
Bias: Bearish-to-neutral short term, trend losing momentum while capital flow diversifies.
Always take profits and manage risk.
Interaction is welcome.
ETHUSDT 4-Hour Chart Analysis !!ETHUSDT 4-Hour Chart Analysis
Trend: ETH has found support at the intersection of a long-term downtrend line and a horizontal demand zone ($3,850–$3,900 area). This area has held steady several times and is acting as a base for the price.
Structure: The price has recently pulled back after rallying to $4,220, but continues to make higher lows on this timeframe, indicating that the bullish structure remains intact as long as $3,900 remains stable.
Key Levels:
Support: $3,850–$3,900 (trend line and horizontal zone)
Resistance: $4,220 (recent swing high), $4,830 (key target—see green arrow projection)
Perspective: If ETH remains stable above $3,900 and bounces back from this support, the next targets will be $4,220 and then $4,830. A breakdown below $3,850 would weaken this bullish outlook.
ETH remains bullish above support, and an upward move towards $3,900 is highly likely. Watch for a break above and sustain above the $4,220 level for further momentum.
DYOR | NFA

ETHUSD H1 | Bearish Momentum Building UpBased on the H1 chart analysis, we can see that the price has rejected off the sell entry at 3,987.68, which is a pullback resistance that aligns with the 38,2% Fibonacci retracement and could drop from this levle to the downside.
Stop loss is at 4,144.26, whichis a pullback resistance that is slightly below the 78.6% Fibonacci retracement.
Take profit is at 3,744.29, whichis a swing low support.
Stratos Markets Limited (tradu.com ):
CFDs are complex instruments and come with a high risk of losing money rapidly due to leverage. 68% of retail investor accounts lose money when trading CFDs with this provider. You should consider whether you understand how CFDs work and whether you can afford to take the high risk of losing your money.
Stratos Europe Ltd (tradu.com ):
CFDs are complex instruments and come with a high risk of losing money rapidly due to leverage. 70% of retail investor accounts lose money when trading CFDs with this provider. You should consider whether you understand how CFDs work and whether you can afford to take the high risk of losing your money.

LTCUSD H4 | Bullish Bounce Off Pullback SupportLTC/USD has bounced off the buy entry which is a pullback support that aligns with he 50% Fibonacci retracemnt and could rise from this level to the upside.
Buy entry is at 96.09, which is a pullback support that aligns with he 50% Fibonacci retracemnt.
Stop loss is at 84.76, which is a swing low support.
Take profit is at 115.31, whichis a pullback resistance that aligns with the 61.8% Fibonacci retracemnt.
Stratos Markets Limited (tradu.com ):
CFDs are complex instruments and come with a high risk of losing money rapidly due to leverage. 68% of retail investor accounts lose money when trading CFDs with this provider. You should consider whether you understand how CFDs work and whether you can afford to take the high risk of losing your money.
Stratos Europe Ltd (tradu.com ):
CFDs are complex instruments and come with a high risk of losing money rapidly due to leverage. 70% of retail investor accounts lose money when trading CFDs with this provider. You should consider whether you understand how CFDs work and whether you can afford to take the high risk of losing your money.

SOLUSD H4 | Bearish Drop-Off in MomentumSOL/USD has rejected off the sell entry which is an overlap resistance that aligns with the 50% Fibonacci retracemnt and could drop from this level to the downside.
Sell entry is at 204.97, whichis an overlap resistance that aligns with the 50% Fibonacci retracemnt.
Stop loss is at 221.25, whichis a pullback resistance that is slightly below the 78.6% Fibonacci retracement.
Take profit is at 174.91, whichis a swing low support.
Stratos Markets Limited (tradu.com ):
CFDs are complex instruments and come with a high risk of losing money rapidly due to leverage. 68% of retail investor accounts lose money when trading CFDs with this provider. You should consider whether you understand how CFDs work and whether you can afford to take the high risk of losing your money.
Stratos Europe Ltd (tradu.com ):
CFDs are complex instruments and come with a high risk of losing money rapidly due to leverage. 70% of retail investor accounts lose money when trading CFDs with this provider. You should consider whether you understand how CFDs work and whether you can afford to take the high risk of losing your money.

BNBUSD H4 | ullish Momentum BuildingBNB/USD is reacting off the buy entry, which is a pullback support that aligns with the 61.8% Fibonacci retracement and could rise from this level to the upside.
Buy entry is at 1,115.60, which is a pullback support that aligns with the 61.8% Fibonacci retracement.
Stop loss is at 1,027.90, which is an overlap support.
Take profit is at 1,224.16, which is a pullback resistance that is slightly below the 61.8% Fibonacci retracement.
Stratos Markets Limited (tradu.com ):
CFDs are complex instruments and come with a high risk of losing money rapidly due to leverage. 68% of retail investor accounts lose money when trading CFDs with this provider. You should consider whether you understand how CFDs work and whether you can afford to take the high risk of losing your money.
Stratos Europe Ltd (tradu.com ):
CFDs are complex instruments and come with a high risk of losing money rapidly due to leverage. 70% of retail investor accounts lose money when trading CFDs with this provider. You should consider whether you understand how CFDs work and whether you can afford to take the high risk of losing your money.

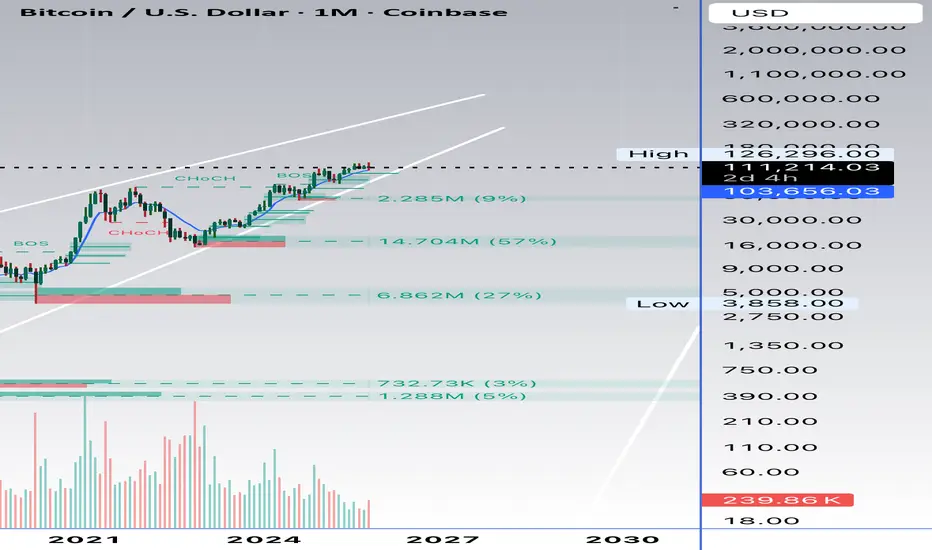
Logarithmic Trend Looks Bullish AF Could always be wrong, but we are in that part of the cycle where bears and bulls are speculating upon whether the top is in.
In those times it’s best to zoom out and look at the macro, and this is what that trend line seems to suggest.
Strong Recovery, Key Level Ahead $TRUMPAfter the recent crash, $TRUMP/USDT has made a strong comeback, recovering sharply from the bottom with solid momentum.
On the daily timeframe, the price has successfully broken above the key resistance trendline, showing clear bullish intent. However, it’s now testing a major resistance on the weekly chart.
If the price manages to break and close above this weekly resistance trendline, it could trigger an explosive upside move for TRUMP.
DYOR, NFA
Thanks for reading! Appreciate your support and engagement 🙏

ETH: Range-Bound, But Breakdown Could Get UglyOn the CRYPTOCAP:ETH daily chart, the mid-zone is acting as a clear barrier. The price is currently consolidating within a range, caught between the key support zone and this mid S/R zone.
A breakout above could trigger a strong move higher, while a breakdown here would be a scary scenario for the overall market.
DYOR, NFA
Thanks for reading! Appreciate your support and engagement 🙏

COAI Buy/Long Setup (2H)First of all, you should know that this is a highly volatile and risky asset, so you need to enter the position in a way that if it hits the stop loss, you only lose about 1–2% of your capital, or even less | so manage your risk carefully.
The marked entry zones are considered strong supports for this coin, which could potentially lead to good profits. You should enter in spot, as this coin has wide zones.
Targets are shown on the chart.
For risk management, please don't forget stop loss and capital management
When we reach the first target, save some profit and then change the stop to entry
Comment if you have any questions
Thank You

BTC: Hold Here or Drop to 104K?CRYPTOCAP:BTC is currently retesting a crucial zone after facing rejection from the recent resistance area.
This “important zone” around $111K–$110K will likely decide the next move, a strong hold here could trigger a bounce back toward the highs, while a breakdown below it might open the doors toward $108K or even $104K.
In short — this is a key make-or-break level. Keep a close eye on how the daily candle closes here.
DYOR, NFA
#BTCUSDT #unichartz

Solana – Saucer Pattern & Key Resistance in FocusSolana is starting to stand out with notable relative strength versus both Bitcoin and Ethereum, and it's catching my attention this week.
✅ Key Support Holding:
Price recently held firm at the $185–$190 support zone, bouncing with strength and attempting to establish a higher low. If this level holds, it would further confirm the uptrend in place since April.
📉 Corrective Phase Since September:
Despite the pullback, the larger trend structure remains bullish. A break above the September high is still needed to confirm trend continuation.
🔵 Multi-Month Saucer Formation:
A rounded base is developing on the daily chart—a classic saucer bottom. If confirmed, this pattern points to major upside potential, with a projected move possibly targeting $500 over time.
⚠️ Watch This Zone Closely:
The $250–$260 resistance area is the key overhead level to clear. A decisive breakout here could trigger a strong rally and confirm the saucer breakout.
📌 Summary:
Solana is showing resilience, building a bullish structure, and forming a significant base. If momentum builds above $260, bulls may take control in a big way.

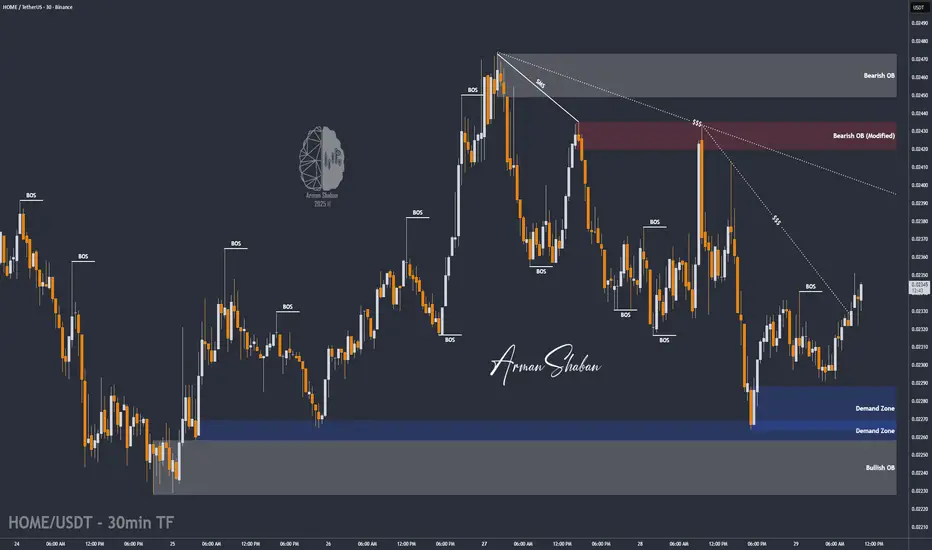
HOME/USDT | $HOME Ready to Pump – Watch $0.0232 Breakout!By analyzing the BME:HOME chart on the 30-minute timeframe, we can see that after a correction down to $0.02265, the price found strong buying interest and is now trading around $0.02338.
If the price manages to hold above $0.02320, we can expect a strong bullish move from this token.
The key demand zone lies between $0.02265–$0.02288, and the next targets for this potential rally are $0.02350, $0.02375, $0.02410, $0.02435, and $0.02450.
Please support me with your likes and comments to motivate me to share more analysis with you and share your opinion about the possible trend of this chart with me !
Best Regards , Arman Shaban
A few important steps for creating robust and winning StrategiesAs the title says, I want to share knowledge & important insights into the best practices for creating robust, trustworthy and profitable trading Strategies here on TradingView.
These bits of information that my team I have gathered throughout the years and have managed to learn through mostly trial and error. Costly errors too .
Many of these points more professional traders know, however, there are some that are quite innovative for all levels of experience in my opinion. Please, feel free to correct me or add more in the comments.
There are a few strategic and tactical changes to our process that made a noticeable difference in the quality of Strategies and Indicators immediately.
Firstly and most importantly, we have all heard about it, but it is having the most data available. A good algorithm, when being built NEEDS to have as many market situations in its training data as possible. Choppy markets, uptrends, downtrends, fakeouts, manipulations - all of these are necessary for the strategy to learn the possible market conditions as much as possible and be prepared for trading on unknown data.
Many may have heard the phrase "History doesn't repeat itself but rhymes well" - you need to have the whole dictionary of price movements to be able to spot when it rhymes and act accordingly.
The TradingView Ultimate plan offers the most data in terms of historical candles and is best suited for creating robust strategies.
___
Secondly, of course, robustness tests. Your algorithm can perform amazingly on training data, but start losing immediately in real time, even if you have trained it on decades of data.
These include Monte-carlo simulations to see best and worst scenarios during the training period. Tests also include the fundamentally important out-of-sample checks . For those who aren’t familiar - this means that you should separate data into training sets and testing sets. You should train your algorithm on some data, then perform a test on unknown to the optimization process data. It's common practice to separate data as 20% training / 20% unknown / 20% training etc. to build a data set that will show how your algorithm performs on unknown to it market movements. Out of sample tests are crucial and you can never trust a strategy that has not been through them.
Walk-forward simulations are similar - you train your algorithm on X amount of data and simulate real-time price feeds and monitor how it performs. You can use the Replay function of TradingView to do walk-forward tests!
When you are doing robustness tests, we have found that a stable strategy performs around 90% similarly in terms of win rate and Sortino ratio compared to training data. The higher the correlation between training performance and out of sample performance, the more risk you can allocate to this algorithm.
___
Now lets move onto some more niche details. Markets don’t behave the same when they are trending downward and when they are trending upwards. We have found that separating parameters for optimization into two - for long and for short - independent of each other, has greatly improved performance and also stability.
Logically it is obvious when you look at market movements. In our case, with cryptocurrencies, there is a clear difference between the duration and intensity of “dumps” and “pumps”. This is normal, since the psychology of traders is different during bearish and bullish periods. Yes, introducing double the amount of parameters into an algorithm, once for long, once for short, can carry the risk of overfitting since the better the optimizer (manual or not), the better the values will be adjusted to fit training data. But if you apply the robustness tests mentioned above, you will find that performance is greatly increased by simply splitting trade logic between long and short. Same goes for indicators.
Some indicators are great for uptrends but not for downtrends. Why have conditions for short positions that include indicators that are great for longs but suck at shorting, when you can use ones that perform better in the given context?
___
Moving on - while overfitting is the main worry when making an algorithm, underoptimization as a result of fear of overfitting is a big threat too . You need to find the right balance by using robustness tests. In the beginning, we had limited access to software to test our strategies out of sample and we found out that we were underoptimizing because we were scared of overfitting, while in reality we were just holding back the performance out of fear. Whats worse is we attributed the losses in live trading to what we thought was overfitting, while in reality we were handicapping the algorithm out of fear.
___
Finally, and this relates to trading in general too, we put in place very strict rules and guidelines on what indicators to use in combination with others and what their parameter range is. We went right to theory and capped the values for each indicator to be within the predefined limits.
A simple example is MACD . Your optimizer might make a condition that includes MACD with a fast length of 200, slow length of 160 and signal length of 100. This may look amazing on backtesting and may work for a bit on live testing, but these values are FUNDAMENTALLY wrong (Investopedia, MACD). You must know what each indicator does and how it calculates its values. Having a fast length bigger than the slow one is completely backwards, but the results may show otherwise.
When you optimize any strategy, manually or with the help of a software, be mindful of the theory. Mathematical formulas don’t care about the indicator’s logic, only about the best combination of numbers to reach the goal you are optimizing for - be it % Return, Profit Factor or other.
Parabolic SAR is another one - you can optimize values like 0.267; 0.001; 0.7899 or the sort and have great performance on backtesting. This, however, is completely wrong when you look into the indicator and it’s default values (Investopedia, Parabolic SAR).
To prevent overfitting and ensure a stable profitability over time, make sure that all parameters are within their theoretical limits and constraints, ideally very close to their default values.
Thank you for reading this long essay and I hope that at least some of our experience will help you in the future. We have suffered greatly due to things like not following trading theory and leaving it all up to pure mathematical optimization, which is ignorant of the principles of the indicators. The separation between Long / Short logic was also an amazing instant improvement.
View the linked idea where we explain the psychology of risk management and suggest a few great ways to calculate and manage your risk when trading - just as important as the strategy itself!
What do you think? Do you use any of these methods; Or better ones?
Let us know in the comments.
SOL: chart on the background of the news!Greetings, colleagues 😊💻
It's time to🔎 look and disassemble the charts coins SOL
A lot of positive news has been 📅 coming out recently , and thus may attract more and more buyers of this asset .
💡 For those who are not engaged in investing, but in extracting medium and short-term profits, I recommend that you always rely on graphical data, rather than on the news background (which is often misleading and forces you to make decisions based on emotions)
🚩 A few technical characteristics of this coin, for those who just came to the market
Ticker: SOL (Solana)
Current price (at the time of publication): 194.53$
Market capitalization: $106.93B (ranked 9th)
⭐ Solana - is a high-performance blockchain built for scalable decentralized applications (dApps), DeFi, NFT and Web3
Average commission: <$0.00025
Consensus: A combination of Proof of History (PoH) + Proof of Stake (PoS)
Network launch: March 2020
Founder: Anatoly Yakovenko (former Qualcomm engineer)
PoH is a unique time—binding mechanism that allows validators to process transactions without constant synchronization. This is Solana's "secret weapon" against Ethereum and other L1s.
↗️ From the latest news:
▶ The first American spot ETF on Solana — Bitwise Solana Staking ETF (BSOL) — on the first day of trading, the fund raised $69.45 million, and its net assets reached $289 million.
The fund's share in Solana's market capitalization was 0.27%.
▶ Fidelity has added support for CRYPTOCAP:SOL for American clients.
▶ VanEck has submitted an updated version of the S-1 application for the spot CRYPTOCAP:SOL ETF.
▶ Grayscale has registered a CRYPTOCAP:SOL ETF in Delaware. This is the first formal step that companies usually take before filing a formal application with the SEC.
📊Technical picture:
🗓 Let's start the analysis with the quarterly chart (3M):
one of the significant advantages is that the price is trading above the annual opening mark ($189.31)
📎 Also, before the last increase, the price removed liquidity from the $ 110 mark and, according to the Fibonacci grid, the correction was in the OTE zone (0.62 - 0.705), which is quite a "healthy" correction for continued growth.
There is a liquidity zone on top - this is ATH - $295.83, which may become the first target for an upward movement.
📎 If we take into account more global goals, then we are guided by the extended Fibonacci grid ... 373$ … 474$
🗓 Weekly chart: the structure is ascending, but the open liquidity points of $155 and $126 are "confusing" from below
🗓 On the daily time frame: the trend is in a downward movement, now we are seeing a correction to the wave of decline, liquidity is forming on both sides
one of the options is to allow the price to go down and collect orders with a shadow, remaining in the range of the trend line (if the price is not held = $ 133)
🤔 I'm still waiting, I need to see the withdrawal of liquidity in order to understand which way the asset is going first
↗️ With growing institutional interest and technological improvements ahead, SOL remains one of the top candidates for the 2025-2026 altseason.
SOL is a mature ecosystem with real demand, infrastructure, and vision. It's wise to keep it in a briefcase. Trade cautiously, but actively 😊
Always calculate the risks and make informed decisions
Good luck to all! 🍀

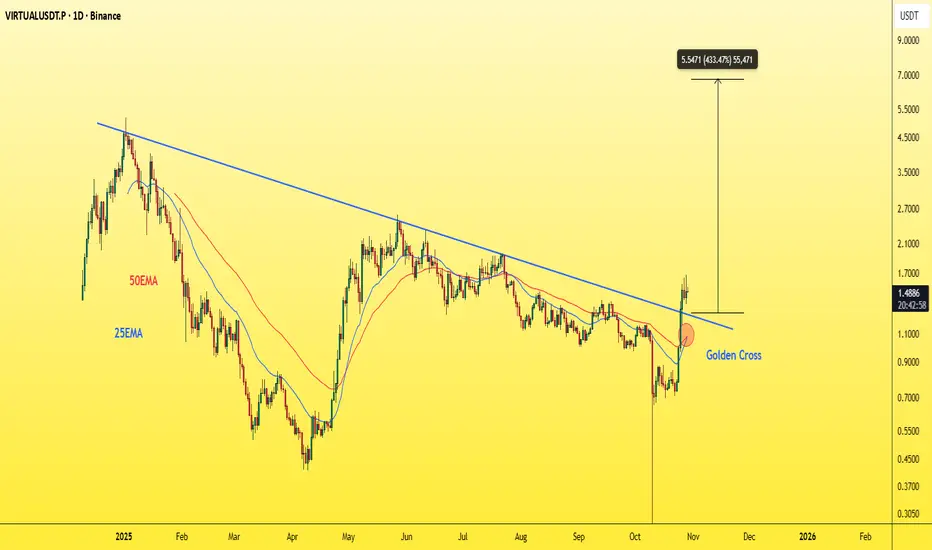
VIRTUAL - Extremely bullishKeep your eyes on it over the next period — it’s about to skyrocket.
It just broke a trendline it’s been trying to break for around 300 days,
and it’s also formed a golden cross on the daily chart.
Best Regards:
Ceciliones🎯
$0.55 is the baseA little over a month ago, Sept 17, selling was exhausted at $0.55. Them price action feel off a cliff but demand rose sharply as indicated by the rise in the ADX. this leads me to believe we will break out from this ascending triangle without breaking lower than $0.55. This is literally the new ground floor.
