DOGEUSD H4 | Bearish drop offBased on the H4 chart analysis, we can see that the price has rejected off the sell entry which is an overlap resistance that aligns with the 61.8% Fibonacci retracement and could drop from this level to our take profit.
Sell entry is at 0.23848, which is an overlap resistance that aligns with the 61.8% Fibonacci retracement.
Stop loss is at 0.25869, which is a pullback resistance that is slightly below the 61.8% Fibonacci retracement.
Take profit is at 0.2184, which is a pullback support.
High Risk Investment Warning
Trading Forex/CFDs on margin carries a high level of risk and may not be suitable for all investors. Leverage can work against you.
Stratos Markets Limited (tradu.com ):
CFDs are complex instruments and come with a high risk of losing money rapidly due to leverage. 65% of retail investor accounts lose money when trading CFDs with this provider. You should consider whether you understand how CFDs work and whether you can afford to take the high risk of losing your money.
Stratos Europe Ltd (tradu.com ):
CFDs are complex instruments and come with a high risk of losing money rapidly due to leverage. 66% of retail investor accounts lose money when trading CFDs with this provider. You should consider whether you understand how CFDs work and whether you can afford to take the high risk of losing your money.
Stratos Global LLC (tradu.com ):
Losses can exceed deposits.
Please be advised that the information presented on TradingView is provided to Tradu (‘Company’, ‘we’) by a third-party provider (‘TFA Global Pte Ltd’). Please be reminded that you are solely responsible for the trading decisions on your account. There is a very high degree of risk involved in trading. Any information and/or content is intended entirely for research, educational and informational purposes only and does not constitute investment or consultation advice or investment strategy. The information is not tailored to the investment needs of any specific person and therefore does not involve a consideration of any of the investment objectives, financial situation or needs of any viewer that may receive it. Kindly also note that past performance is not a reliable indicator of future results. Actual results may differ materially from those anticipated in forward-looking or past performance statements. We assume no liability as to the accuracy or completeness of any of the information and/or content provided herein and the Company cannot be held responsible for any omission, mistake nor for any loss or damage including without limitation to any loss of profit which may arise from reliance on any information supplied by TFA Global Pte Ltd.
The speaker(s) is neither an employee, agent nor representative of Tradu and is therefore acting independently. The opinions given are their own, constitute general market commentary, and do not constitute the opinion or advice of Tradu or any form of personal or investment advice. Tradu neither endorses nor guarantees offerings of third-party speakers, nor is Tradu responsible for the content, veracity or opinions of third-party speakers, presenters or participants.
Cryptomarket

EOSUSD H4 | Bearish continuation in playEOSUSD has rejected off the sell entry which is a pullback resistance and could drop from this level to the downside.
Sell entry is at 0.4046, which is a pullback resistance.
Stop loss is at 0.4436, which is a pullback resistance that aligns with the 61.8% Fibonacci retracement.
Take profit is at 0.3407, which aligns with the 61.8% Fibonacci retracement.
High Risk Investment Warning
Trading Forex/CFDs on margin carries a high level of risk and may not be suitable for all investors. Leverage can work against you.
Stratos Markets Limited (tradu.com ):
CFDs are complex instruments and come with a high risk of losing money rapidly due to leverage. 65% of retail investor accounts lose money when trading CFDs with this provider. You should consider whether you understand how CFDs work and whether you can afford to take the high risk of losing your money.
Stratos Europe Ltd (tradu.com ):
CFDs are complex instruments and come with a high risk of losing money rapidly due to leverage. 66% of retail investor accounts lose money when trading CFDs with this provider. You should consider whether you understand how CFDs work and whether you can afford to take the high risk of losing your money.
Stratos Global LLC (tradu.com ):
Losses can exceed deposits.
Please be advised that the information presented on TradingView is provided to Tradu (‘Company’, ‘we’) by a third-party provider (‘TFA Global Pte Ltd’). Please be reminded that you are solely responsible for the trading decisions on your account. There is a very high degree of risk involved in trading. Any information and/or content is intended entirely for research, educational and informational purposes only and does not constitute investment or consultation advice or investment strategy. The information is not tailored to the investment needs of any specific person and therefore does not involve a consideration of any of the investment objectives, financial situation or needs of any viewer that may receive it. Kindly also note that past performance is not a reliable indicator of future results. Actual results may differ materially from those anticipated in forward-looking or past performance statements. We assume no liability as to the accuracy or completeness of any of the information and/or content provided herein and the Company cannot be held responsible for any omission, mistake nor for any loss or damage including without limitation to any loss of profit which may arise from reliance on any information supplied by TFA Global Pte Ltd.
The speaker(s) is neither an employee, agent nor representative of Tradu and is therefore acting independently. The opinions given are their own, constitute general market commentary, and do not constitute the opinion or advice of Tradu or any form of personal or investment advice. Tradu neither endorses nor guarantees offerings of third-party speakers, nor is Tradu responsible for the content, veracity or opinions of third-party speakers, presenters or participants.

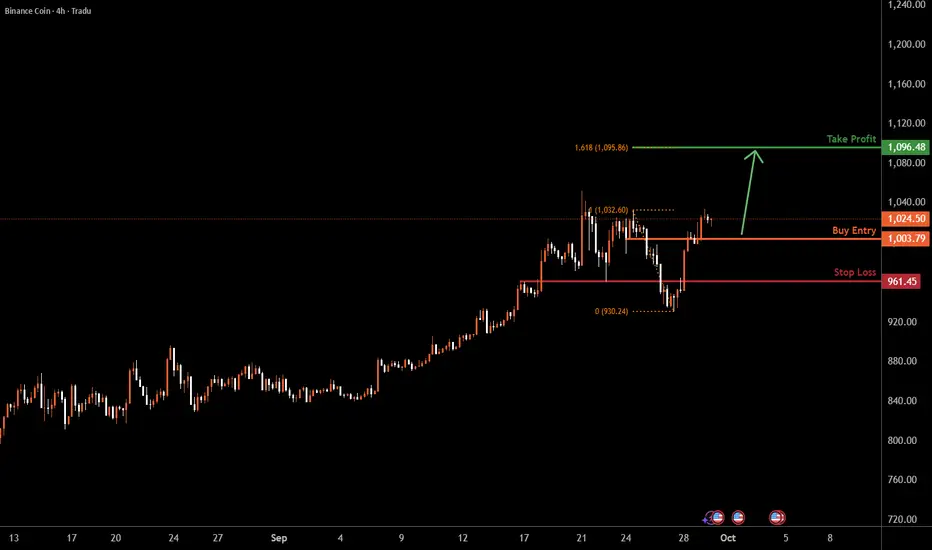
BNBUSD H4 | Bullish bounceBNB/USD is falling towards the buy entry which is a pullback uport and could bounce from this level to the upside.
Buy entry is at 1,003.79, which is a pullback support.
Stop loss is at 961.45, which is a pullback support.
Take profit is at 1,096.48, which aligns with the 161.8% Fibonacci extension.
High Risk Investment Warning
Trading Forex/CFDs on margin carries a high level of risk and may not be suitable for all investors. Leverage can work against you.
Stratos Markets Limited (tradu.com ):
CFDs are complex instruments and come with a high risk of losing money rapidly due to leverage. 65% of retail investor accounts lose money when trading CFDs with this provider. You should consider whether you understand how CFDs work and whether you can afford to take the high risk of losing your money.
Stratos Europe Ltd (tradu.com ):
CFDs are complex instruments and come with a high risk of losing money rapidly due to leverage. 66% of retail investor accounts lose money when trading CFDs with this provider. You should consider whether you understand how CFDs work and whether you can afford to take the high risk of losing your money.
Stratos Global LLC (tradu.com ):
Losses can exceed deposits.
Please be advised that the information presented on TradingView is provided to Tradu (‘Company’, ‘we’) by a third-party provider (‘TFA Global Pte Ltd’). Please be reminded that you are solely responsible for the trading decisions on your account. There is a very high degree of risk involved in trading. Any information and/or content is intended entirely for research, educational and informational purposes only and does not constitute investment or consultation advice or investment strategy. The information is not tailored to the investment needs of any specific person and therefore does not involve a consideration of any of the investment objectives, financial situation or needs of any viewer that may receive it. Kindly also note that past performance is not a reliable indicator of future results. Actual results may differ materially from those anticipated in forward-looking or past performance statements. We assume no liability as to the accuracy or completeness of any of the information and/or content provided herein and the Company cannot be held responsible for any omission, mistake nor for any loss or damage including without limitation to any loss of profit which may arise from reliance on any information supplied by TFA Global Pte Ltd.
The speaker(s) is neither an employee, agent nor representative of Tradu and is therefore acting independently. The opinions given are their own, constitute general market commentary, and do not constitute the opinion or advice of Tradu or any form of personal or investment advice. Tradu neither endorses nor guarantees offerings of third-party speakers, nor is Tradu responsible for the content, veracity or opinions of third-party speakers, presenters or participants.
BCHUSD H4 | Bearish drop offBCH/USD is reacting off the sell entry which is a pullback resitance that ailgns with the 23.6% Fibonacci retracement and oculd drop from this level to tour take profit.
Sell entry is at 559, whic is a pullback resistance that aligsn with the 23.6% Fibonacci retracement.
Stop loss is at 576.77, which is a pullback resitance that lines up with the 38.2% Fibonacci retracement.
Take profit is at 526.72, which is a pullback support.
High Risk Investment Warning
Trading Forex/CFDs on margin carries a high level of risk and may not be suitable for all investors. Leverage can work against you.
Stratos Markets Limited (tradu.com ):
CFDs are complex instruments and come with a high risk of losing money rapidly due to leverage. 65% of retail investor accounts lose money when trading CFDs with this provider. You should consider whether you understand how CFDs work and whether you can afford to take the high risk of losing your money.
Stratos Europe Ltd (tradu.com ):
CFDs are complex instruments and come with a high risk of losing money rapidly due to leverage. 66% of retail investor accounts lose money when trading CFDs with this provider. You should consider whether you understand how CFDs work and whether you can afford to take the high risk of losing your money.
Stratos Global LLC (tradu.com ):
Losses can exceed deposits.
Please be advised that the information presented on TradingView is provided to Tradu (‘Company’, ‘we’) by a third-party provider (‘TFA Global Pte Ltd’). Please be reminded that you are solely responsible for the trading decisions on your account. There is a very high degree of risk involved in trading. Any information and/or content is intended entirely for research, educational and informational purposes only and does not constitute investment or consultation advice or investment strategy. The information is not tailored to the investment needs of any specific person and therefore does not involve a consideration of any of the investment objectives, financial situation or needs of any viewer that may receive it. Kindly also note that past performance is not a reliable indicator of future results. Actual results may differ materially from those anticipated in forward-looking or past performance statements. We assume no liability as to the accuracy or completeness of any of the information and/or content provided herein and the Company cannot be held responsible for any omission, mistake nor for any loss or damage including without limitation to any loss of profit which may arise from reliance on any information supplied by TFA Global Pte Ltd.
The speaker(s) is neither an employee, agent nor representative of Tradu and is therefore acting independently. The opinions given are their own, constitute general market commentary, and do not constitute the opinion or advice of Tradu or any form of personal or investment advice. Tradu neither endorses nor guarantees offerings of third-party speakers, nor is Tradu responsible for the content, veracity or opinions of third-party speakers, presenters or participants.

Daily Bitcoin Signal: Sell , target 110KBitcoin is currently showing signs of strength as it tests the key resistance level around 113,500.
A confirmed 1H candle breakout this zone could trigger fresh bearish momentum, opening the door for lower targets in the short term.
My Personal Long Setup
If the price breaks and closes a 1H candle under 113,500, I will enter a sell position.
🎯 Target 1: 112,000
🎯 Target 2: 110,000
❌ Stop-loss: 115,200
👍 Don’t forget to boost this trading idea if you found it helpful,
and follow me for more daily crypto insights and trade setups.
⚠️ Please note:
This is not financial advice – I’m only sharing my personal trades.
Always do your own research before taking action.
Best of luck 🌹

XAU/USD – Bulls Eyeing Breakout Toward 3,820From my point of view, Gold (XAU/USD) is showing signs of strength after rejecting support levels multiple times. The chart highlights a clear horizontal range where buyers have consistently stepped in around the 3,713 – 3,720 zone. This area is acting as a strong base, signaling that demand is present whenever price dips lower.
On the other side, resistance near 3,780 has been tested several times, and each rejection has been weaker than the last – which often signals that sellers are losing control. A breakout above this zone could unleash a strong impulsive rally.

Ethereum Elliott Wave Daily Analysis : Target 4500Ethereum (Timeframe: 4H)
1. Price Action & Trend
The chart shows a completed bearish wave that ended around zone (i) near the $3,700 level.
From this point, Ethereum started a clear upward move with strong bullish candles, suggesting the beginning of a new impulsive wave according to Elliott Wave Theory.
The first expected target for the current move is the key resistance area at $4,500, which represents a major technical level (the previous high .. clear horizontal line).
2. Support & Resistance
Nearest Support: $3,950 – $4,000 pivot zone of the latest bullish move.
Main Resistance: $4,500 both psychological and technical barrier.
3. Supporting Indicators
Momentum: The strong bullish candles reflect renewed buying demand.
Short-Term Trend: Bullish as long as price holds above $4,000.
✍️ Conclusion:
Analysis suggests that Ethereum is in the process of extending its bullish wave, potentially targeting the $4,500 zone in the coming sessions.
Any corrective pullback toward $4,000 remains a critical level to watch
👍 Don’t forget to boost this trading idea if you found it helpful,
and follow me for more daily crypto insights and trade signals.
Please note:
This is not financial advice – I’m only sharing my personal trades.
Always do your own research before taking action.
Best of luck 🌹

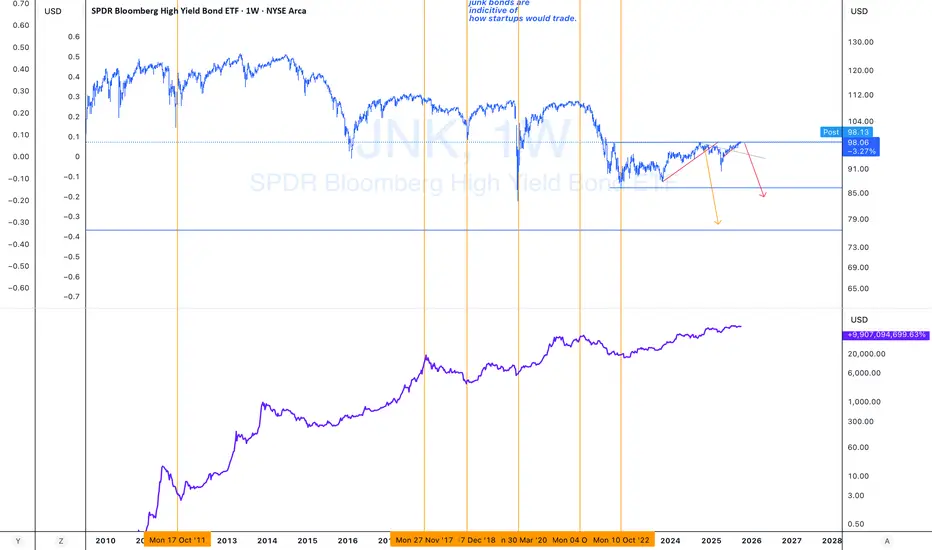
BREAKING: Crypto Is A Junk Security! $JNKJust a quick PSA showing the correlation between #junk debt and #crypto.
Notice the highs and lows are all undeniably correlated.
Proceed with extreme caution. As data releases are suspended (covered up), expect the high-risk junk stuff to collapse into oblivion.
Godspeed.
Stacking logarithmic (log) channels - Secret tool in crypto Ep 3Stacking Logarithmic Channels - Bitcoin's Hidden Fractal Structure | Signal & Structure Episode 3
In this third episode of Signal and Structure, we explore a powerful but little-known technique: stacking logarithmic channels to identify critical support and resistance levels in exponentially growing assets like Bitcoin.
Core Technique Revealed:
The Logarithmic Channel Stacking Method
Start with a base channel on log scale (demonstrated from November 2011)
Copy and stack identical channels above/below the original
The midline of one channel becomes the boundary of adjacent channels
Creates a fractal structure that respects Bitcoin's exponential growth pattern
Key Principles:
Always use logarithmic scale for crypto channels
Midlines are as important as channel boundaries
Multiple touches validate channel placement
Channels maintain proportional relationships when stacked
Practical Demonstrations:
Historical Validation Points
November 2013: Top of first channel ($1,200)
December 2017: Top of second stacked channel ($19,000)
November 2021: Bottom of third stacked channel ($69,000)
March 2023: Bottom of fourth stacked channel ($15,500)
Current Market Analysis:
Bitcoin dancing around the midline of the current channel
Lower boundary support around $90-92K (aligning with CME gap)
Technical ceiling projections discussed with appropriate caveats
Channel Construction Details:
Monthly channels: Black, thickness 4, 30% opacity
Weekly channels: Maroon/brown, thickness 3
Always include midlines for additional confluence
Adjust opacity to prevent chart clutter
Advanced Insights:
Why log scale channels reveal patterns invisible on linear scale
How to validate channels using midline touches
The relationship between channel midlines and new channel boundaries
Dealing with ambiguous channel placement (multiple valid options)
Time-Saving Tips:
Use TradingView's copy/paste to maintain exact channel angles
Set consistent color coding for different timeframes
Keep channels semi-transparent for better visibility
This technique works because logarithmic scale represents percentage moves consistently - a 100% move always appears the same height regardless of price level. This creates natural harmonic levels that price tends to respect over long timeframes.
While specific price projections should be taken as possibilities rather than certainties, the method itself provides a robust framework for understanding Bitcoin's price structure across its entire history. The convergence of these channel levels with other technical factors (like CME gaps) adds additional weight to these zones.
Remember: Channels are guides, not guarantees. Use them for context and confluence, not as standalone trading signals.

CHZ/USDT ; BUY ...Hello friends
Well, you can see that after a good rise, the price has formed a flag, and if this flag breaks, we can expect growth to the specified limits.
*Trade safely with us*

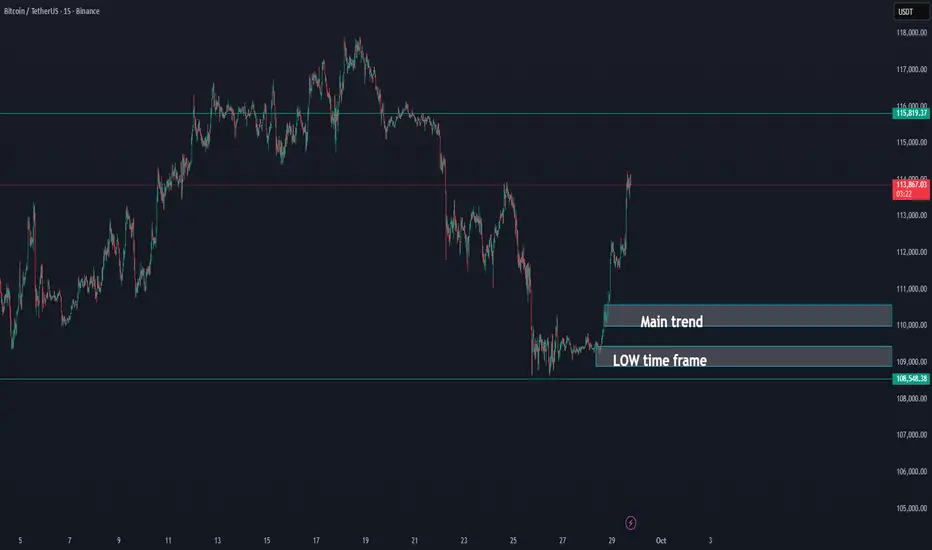
Bitcoin going on the flow UPDATE 29-09-2025BTC/USDT Update
✅ Bitcoin has successfully moved above the main trend, a strong signal that momentum is shifting positively.
🔑 As long as BTC holds this main trend support, the outlook remains bullish.
📈 This structure opens the door for further upside continuation, with buyers maintaining control above this level.
📌 Summary:
BTC is currently holding above the main trend, which keeps the short-term outlook positive as long as this level is defended.
M-USDT SHORT #Update1Hello everyone 😍
💁♂️ Let's go for an exciting update
The M-USDT cryptocurrency touched 3 of its targets with a Sharpie move
It fell 34% from where I placed the analysis and 40% from where the trigger entered until now 🔥🔥🔥
In the previous analysis, I said what the signs of the decline were
It wouldn't be bad to review it together once again
💁♂️ Signs of trend weakness:
The slope of the tops is decreasing
The tops are getting closer
The chart's movement angle is also decreasing and becoming negative
Lower tops are forming
Lower bottoms are forming
Did you use this analysis?
⚠️The analysis may not reach the final target, so at each target, if you make a good profit and see signs of a trend change, you can exit the trade or manage your capital.
⚠️ None of the analysis is a recommendation to buy or sell, but simply my personal opinions on the charts. You can use the charts and choose any that interest you and take a position if you wish.
To support me, I would appreciate it if you boost the analysis and share it with your friends so that I can analyze it with more energy for you, my dears. Thank you all. 💖

LIGHT CONFIRMS THE MAIN TREND - BREAK VIEWAfter the confirmation of the main trend zone, there is a good chance this coin is able to break to a new trend level, with the possibility of up $2

Could BTC Break $100K on the Way Down?History Might Rhyme Again
Looking at BTC on the 1D timeframe, a pattern seems to be forming, one that we’ve already seen twice this cycle.
🔎 March 2024:
Price made an ATH just above the 78.6% Fib, chopped around that level, then dropped below the 50MA first a fake-out, then the real break. After that came the drop below the 200MA.
All price action stayed confined between:
• 78.6% – 61.8%
• 61.8% – 50%
Meanwhile, RSI formed higher lows → a clear bullish divergence while price was making lower lows.
🔎 December 2024:
ATH at the 127.2% Fib level, same pattern: chop → fake-out under 50MA → real drop → break below 200MA.
Price again stayed confined between:
• 127.2% – 100%
• 100% – 78.6%
And again, RSI showed higher lows while price went lower, another bullish divergence.
🔎 Today:
ATH in July (or August, with just a few dollars difference), chop at 161.8% Fib, fake-out under 50MA, now real drop under 50MA. Price is getting close to the 200MA.
The big question:
Will it do the same again?
– Drop under the 200MA
– Trade between 161.8% – 127.2% and 127.2% – 100%
– Form a bullish divergence on RSI while making lower lows
If history rhymes, we could see BTC trade below $100K before forming the next major leg up.
🎯 Plan:
I’m preparing for this scenario and adjusting risk accordingly. High-leverage trades here need surgical precision.
📌 Mindset Reminder:
This is where patience and discipline get tested. It’s not just about charts, it’s about staying calm when fear takes over.
🟠 Macro Wildcard:
The Fed has already started cutting rates.
A rate cut in October could shift BTC’s trajectory upward, but a pause in October could just as easily push price lower.
🎯 Closing Line:
History may not repeat, but right now it’s rhyming loudly and I’m listening.
Always take profits and manage risk.
Interaction is welcome.

TradeCityPro | Bitcoin Daily Analysis #183👋 Welcome to TradeCity Pro!
Let's dive into today's Bitcoin analysis. The market has had an upward movement. Let's see what's ahead in the market.
⏳ 1-Hour Timeframe
Yesterday, I mentioned that there was a high probability of movement and that it would be a good idea to keep an eye on the chart during the New York session as the market could move.
📊 With the start of the New York session, good buying volume entered the market, and after breaking 109890, Bitcoin started an upward wave.
🔑 The first area where the price could have faced resistance was 111605, which was broken on the first attempt. After a pullback, the next leg started.
🚀 The break of 109890, along with RSI entering Overbuy and the entry of buying volume, was a good trigger for a long position, and we could have opened a position with it.
⭐ Now, the price has reached a very important resistance zone, and the probability of a correction starting is high. For taking profit, I suggest you lock in profits whenever RSI exits the Overbuy zone, as this will reduce the upward momentum and increase the chances of a correction.
📈 For new positions, no triggers are available yet, and it's better to wait until the market gives us a clearer structure. However, if the price reacts several times to the level, we can open a long position in subsequent attempts if it breaks.
❌ Disclaimer ❌
Trading futures is highly risky and dangerous. If you're not an expert, these triggers may not be suitable for you. You should first learn risk and capital management. You can also use the educational content from this channel.
Finally, these triggers reflect my personal opinions on price action, and the market may move completely against this analysis. So, do your own research before opening any position.

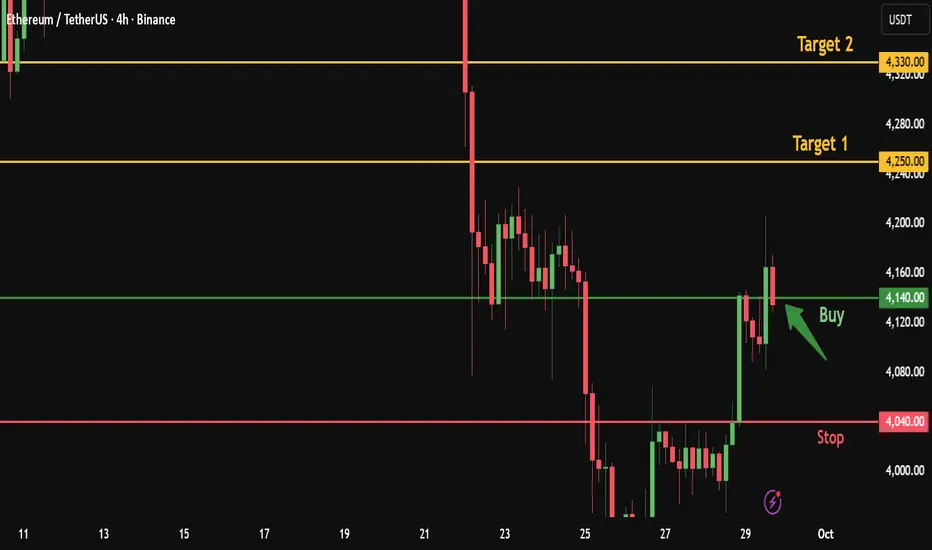
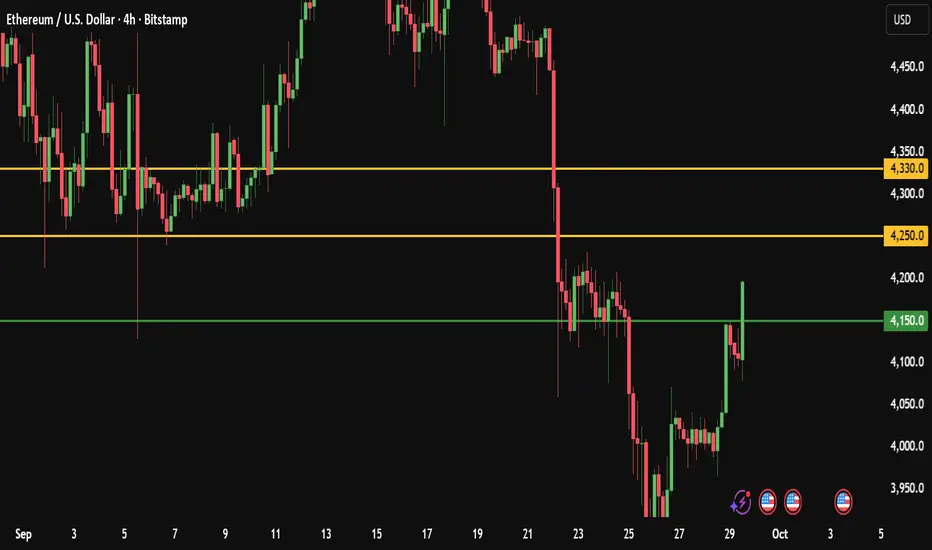
Ethereum Quick Buy from Broken Resistance – Targeting 4330After Ethereum broke the 4140 resistance with a bullish 4H candle and reached 4205, the price has now retested the broken resistance at 4140.
This level acts as a strong entry point for a long position, aiming for higher targets.
Here’s my personal trade plan:
✅ Entry : Buy from current price 4140
🎯 Target 1: 4250
🎯 Target 2: 4330
Stop-loss: 4040
👍 Don’t forget to boost this trading idea if you found it helpful,
and follow me for more daily crypto insights and trade signals.
Please note:
This is not financial advice – I’m only sharing my personal trades.
Always do your own research before taking action.
Best of luck 🌹
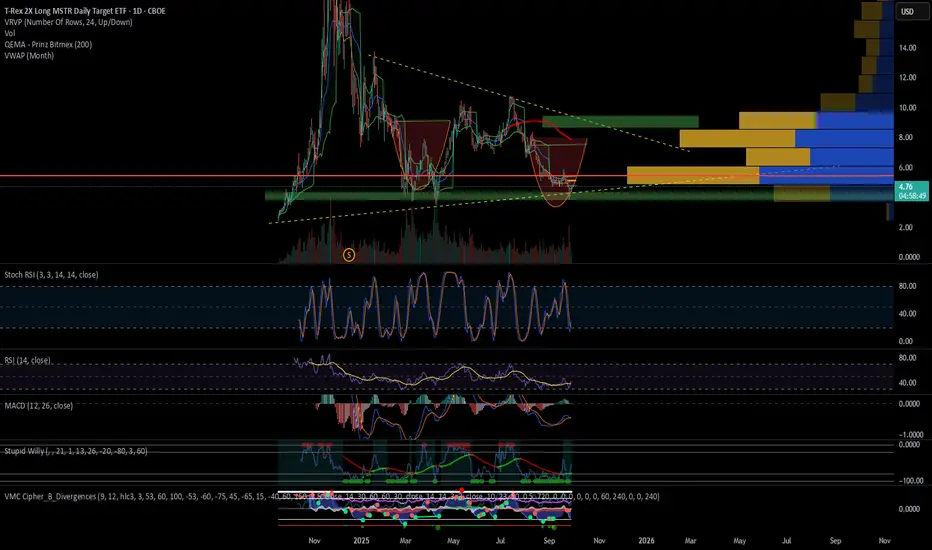
MSTU chasing BTCThere is a nice delay on MSTR and MSTU proportional to BTC on smaller timeframes, allowing for nice entries and exits. It's already run 8% for me, but you might find a nice entry on MSTU when BTC pulls back. However, if you are long term bullish you might not want to wait. My first target is around $9 , at which point, I may just hold it for continuation depending on what BTC is doing at that time. Not financial advice, DYOR.
Ethereum Daily Technical Signal: Buy and Target 4330Ethereum Daily Technical Analysis
Ethereum is currently showing signs of strength as it tests the key resistance level around 4150.
A confirmed 4H candle breakout above this zone could trigger fresh bullish momentum, opening the door for higher targets in the short term.
My Personal Long Setup
If the price breaks and closes a 4H candle above 4150, I will enter a long position.
🎯 Target 1: 4250
🎯 Target 2: 4330
❌ Stop-loss: 4040
👍 Don’t forget to boost this trading idea if you found it helpful,
and follow me for more daily crypto insights and trade setups.
⚠️ Please note:
This is not financial advice – I’m only sharing my personal trades.
Always do your own research before taking action.
Best of luck 🌹
Cryptocurrency : The New Normal & The World of Leverage Trading.📌 Cryptocurrency: The New Normal & The World of Leverage Trading ⚔️ ( A Sweet Killer! )
🌍 Why Are Traders Shifting to Crypto? COINBASE:BTCUSD BITSTAMP:ETHUSD COINBASE:SOLUSD
✔️ Lower capital required compared to stocks
✔️ Fewer gaps (24/7 market = no overnight gap-up/down shockers)
✔️ High leverage opportunities (control bigger trades with smaller margin)
✔️ Global accessibility (Binance, Bybit, OKX, CoinDCX, Mudrex etc.)
📊 Types of Trading in Crypto
💠 **Spot Trading** → In India, 30% tax on capital gains ( check according to your country ).
💠 **Options & Futures** → Taxed as *Business Income* ( like F&O in stocks ). No flat % rule.
⚡ What is Leverage?
👉 Leverage means using *small capital* to control a *large trade size* , because the exchange lends you money.
Think of it like **margin trading** in stocks — but much more aggressive.
🔹 Example 1 : Normal Trade style ( No Leverage )
suppose you have 💰 Capital = $10,000
Bought BTC at Price = $10,000,000
* You can buy 0.001 BTC ( 10000 ➗ 10,000,000 ).
* If BTC rises 10% → Profit = $1,000 (+10%)
* If BTC falls 10% → Loss = $1,000 (-10%)
👉 Risk & reward move in proportion to your capital.
🔹 Example 2 : Leverage Trade style ( 10x Leverage )
suppose you have 💰 Capital = $10,000
opted Leverage = 10x
New Trade Size ( margin ) = $1,00,000 ( you can now utilize this margin amount for trading )
* You can buy 0.01 BTC ( 10000 ➗ 10,000,000 ).
* If BTC rises 10% → Profit = $10,000 (+100% return)
* If BTC falls 10% → Loss = FULL $10,000 ( Liquidation 🚨 )
👉 A 10% move = your account will be blown.
🔹 Example 3:
suppose you have 💰 Capital = $10,000
opted Leverage = 50x (Extreme ⚠️)
New Trade Size ( margin ) = $5,00,000 ( you can now utilize this margin amount for trading )
* You can buy 0.05 BTC ( 50000 ➗ 10,000,000 ).
* If BTC rises just 2% → Profit = $10,000 (+100% return)
* If BTC falls just 2% → FULL $10,000 loss ( Liquidation 🚨 )
* If BTC rises just 10% → Profit = $50,000 (+500% return)
* If BTC falls just 10% → FULL $10,000 loss ( Liquidation 🚨 )
👉 Tiny moves in high volatile asset class = jackpot or wipeout/blown.
⚔️ Key Takeaways :
1️⃣ Leverage multiplies profits 💸 but also multiplies losses too💀 ( a sweet killer! )
2️⃣ Crypto is *highly volatile* (10–20% daily moves are common) → High leverage is extremely risky, if not managed well.
3️⃣ Beginners should **never use more than 2x–3x leverage**
👉 In simple words: **Leverage is a double-edged sword ⚔️**
Used wisely → You’re a king 👑
Used recklessly → You’re broke 🥀
---
🚘 Liquidation Explained ( ex: Car Analogy )
Imagine you pay $10,000 ( as a security ) to rent a car worth $1,00,000. (That’s 10x leverage).
* The car is in your hands, but $90,000 still belongs to the owner of car (exchange).
* If the damage goes beyond your $10,000 margin → the owner takes back the car immediately.
👉 That’s liquidation: when your loss = your margin.
🔹 Case 1: Normal Trade style ( No Leverage )
Margin = $10,000 → Buy BTC.
If BTC drops 10% → Loss = $1,000.
You still have $9,000 left.
✅ No liquidation. Just a normal loss.
🔹 Case 2: 10x Leverage Trade style
Margin = $10,000
New Trade Size ( margin ) = $1,00,000
* BTC rises 10% → Profit = $10,000 (+100%)
* BTC falls 10% → Margin wiped = Liquidation 🚨
🔹 Case 3: 20x Leverage Trade style
Margin = $10,000
New Trade Size = $2,00,000 ( margin )
* BTC rises 5% → Profit = $10,000 (+100% return)
* BTC falls 5% → Margin wiped = Liquidation 🚨
👉 Just 5% against you = Account gone.
🔹 Case 4: 50x Leverage Trade style (High-Risk Zone ⚠️)
Margin = $10,000
New Trade Size = $5,00,000 ( margin )
* BTC rises 2% → Profit = $10,000 (+100% return)
* BTC falls 2% → FULL $10,000 loss = Liquidation 🚨
👉 Just 2% against you = Blown account = Game over.
🎯 Final Word
Leverage = Power ⚡
But in crypto’s volatile world, it’s also a **trap for the impatient**.
* Liquidation is directly proportionate to Leverage.
* Smart traders use small leverage.
* Impulsive traders burn out with high leverage.
💬 Question for you: What’s the **highest leverage** you’ve ever used in a trade? Drop it below 👇 (Be honest—we’ve all been tempted!)
If this Idea gave you a value information then please, Boost it, share your thoughts in comments, and follow for more practical trading!
Happy Trading & Investing!
@TradeWithKeshhav and team
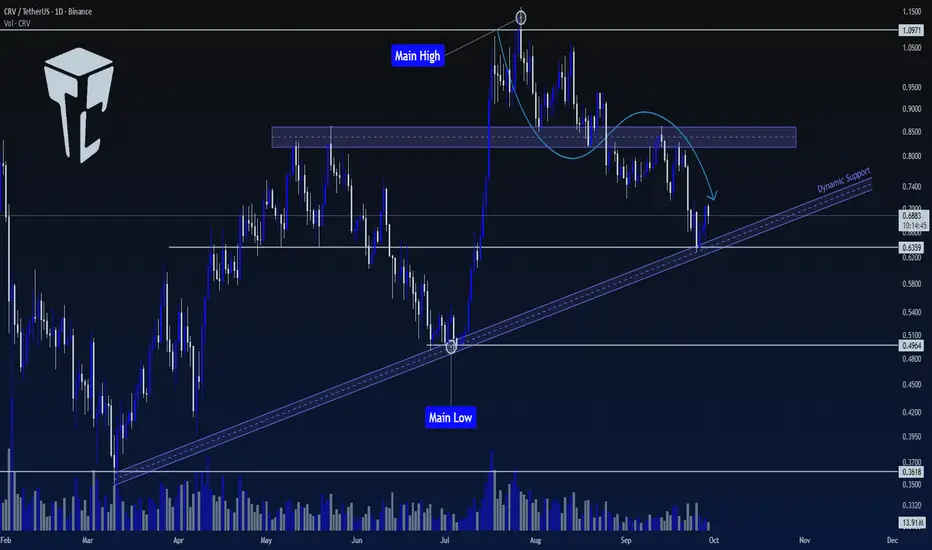
TradeCity Pro | CRV Testing Key Support Zone for Trend Reversal👋 Welcome to TradeCity Pro!
In this analysis, I will be reviewing the CRV coin, one of the popular DEXs, with a market cap of $954 million, currently ranked 81 on CoinMarketCap.
📅 Daily Timeframe
In the daily timeframe, this coin is in an uptrend with a trendline, and the price has currently reached it.
🔍 In higher cycles, the trend of this coin is bullish. However, in lower cycles, after being rejected from 1.0971, a downward movement has started, and it has corrected to the 0.6359 level.
✔️ This level is currently overlapping with the trendline and forms an important support zone.
✨ If this PRZ zone breaks, we can confirm the bearish reversal for CRV, and a short position can be opened. This trigger is one of the first signals for a trend change, and the main trend change will be confirmed after breaking 0.4964.
📈 For a long position, we will have to wait until a proper bullish structure is formed. If the price moves sharply, we will confirm the bullish trend after stabilization above the zone.
❌ Disclaimer ❌
Trading futures is highly risky and dangerous. If you're not an expert, these triggers may not be suitable for you. You should first learn risk and capital management. You can also use the educational content from this channel.
Finally, these triggers reflect my personal opinions on price action, and the market may move completely against this analysis. So, do your own research before opening any position.
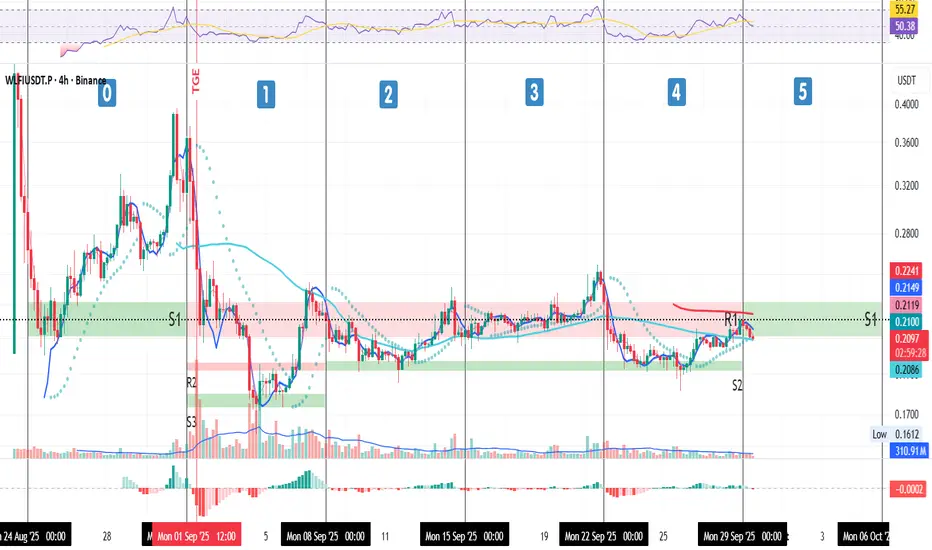
Week 5 Update – WLFI (4H)
Week 5 Update – WLFI (4H)
After holding S2 last week, price pushed higher into the red resistance zone, broke above the 50MA, and stopped right at the newly-formed 200MA, sitting perfectly in the middle of that red zone.
Today (Monday), price is testing the bottom of the S1 zone as support, which is now aligned with the 50MA, an important confluence level.
📈 Position:
I’m still long and plan to hold for a longer period, as long as the structure stays intact.
⚠️ Risk Management:
If price closes under S2, I’ll start scaling out to protect capital and avoid liquidation.
Always take profits and manage risk.
Interaction is welcome.
BCH 4H Trade IdeaMarket is doing recovery and I have find opportunity on BCH. Entry & Exit point are given. NFA. DYOR.

Bitcoin DROP & RISEThere is a possibility Bitcoin drop to daily 200MA at $104,700 and go up from that area to $138k
