AVAX Swing Long Idea – TTKZD ModelAVAX Swing Long Idea – TTKZD Model
📊 Market Sentiment
FED has resumed its rate-cutting cycle, starting with a 0.25% cut in September, with two more expected. Institutional liquidity inflows have accelerated as the U.S. officially adopts crypto as part of its reserves. Despite elevated inflation, a weakening labor market is forcing the FED to ease, pushing more capital into risk-on assets.
📈 Technical Analysis
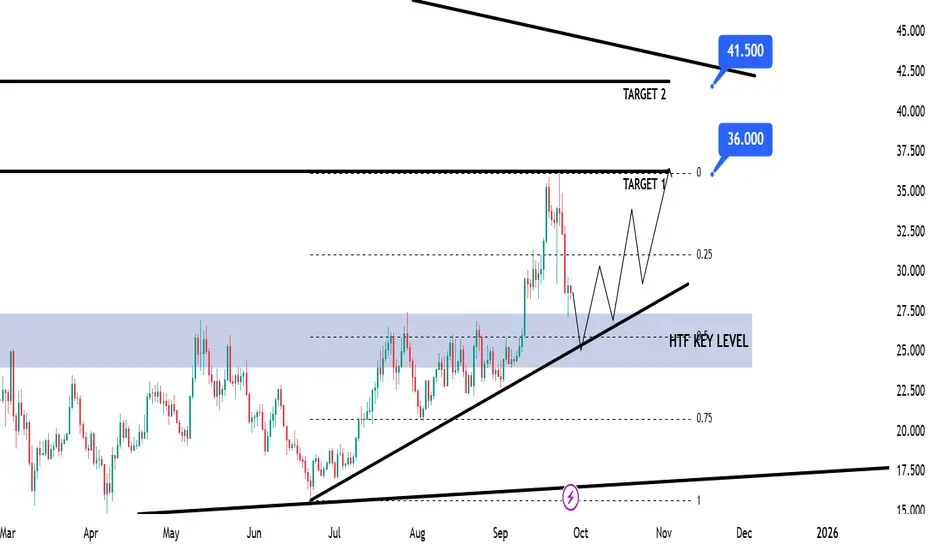
Price remains in a HTF bullish trend, signaling continuation potential.
Price broke the HTF Key Zone and closed aggressively above → strong buyer defense.
Supported by the HTF Bullish Trendline → potential retest & rejection.
Approaching the Fibonacci 0.5 equilibrium (discount) → ideal for long positioning.
📘 Model to be used – TTKZD (Trendline + Key Zone + Discount)
In this model, we look for 3 confluences:
1-Clear HTF bullish trendline supporting structure
2-HTF Key Zone defense after aggressive break
3-Fibonacci 0.5 discount zone as entry alignment
📌 Game Plan
Price to test bullish trendline
Retest of HTF Key Zone
Confluence at 0.5 discount → long entry
🎯 Setup Trigger
12H Break of Structure → confirmation for entry.
📋 Trade Management
Stoploss: Below 12H swing low that creates BOS
Targets:
TP1 → $36
TP2 → $41.5
Move stop to breakeven after TP1.
💬 Like, follow, and comment if this breakdown supports your trading! More setups and insights coming soon — stay connected!
⚠️ Disclaimer: This content is for educational purposes only and does not constitute financial advice. Always DYOR before trading.
Cryptomarket
ETHEREUM HIGH PROBABILITY SETUP SOON!!!🚨 ETHER HIGH PROBABILITY BUY SETUP 🚨
* Here We Can See Clearly The Next Potential Moves For ETHUSD Coming Hours/Days.
* Keep Your Eyes Close On Your Trading Positions.
* Happy PIP Hunting Traders.
FXKILLA.

BITCOIN HIGH PROBABILITY SETUP SOON!!!🚨 BTC HIGH PROBABILITY BUY SETUP 🚨
* Here We Can See Clearly The Next Potential Moves For BTCUSD Coming Hours/Days.
* Keep Your Eyes Close On Your Trading Positions.
* Happy PIP Hunting Traders.
FXKILLA.

TradeCityPro | Bitcoin Daily Analysis #181👋 Welcome to TradeCity Pro!
Let's dive into Bitcoin analysis, today is Saturday, and it's part of the weekend, so the market is relatively quiet. Bitcoin has shown some bearish movement, and now is a critical moment for decision-making.
⏳ 1-Hour Timeframe
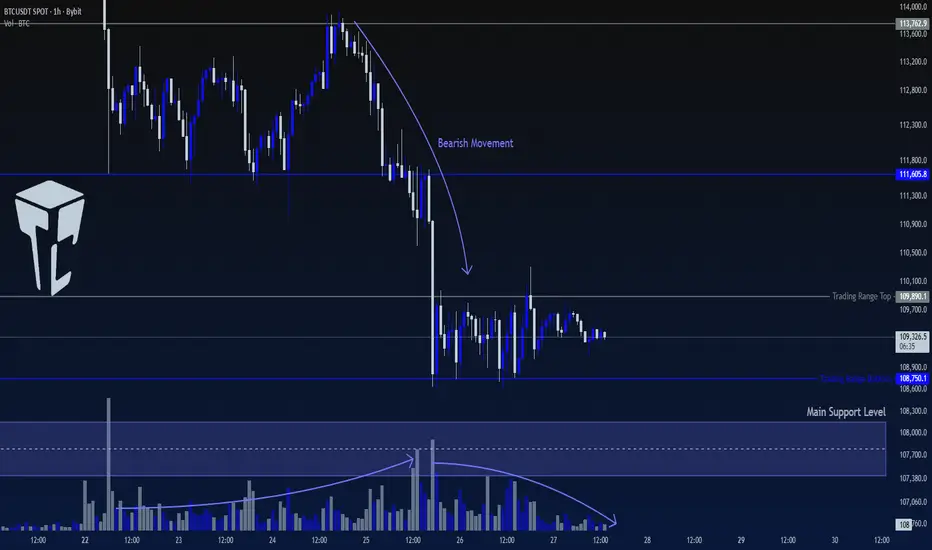
After breaking 111,605, Bitcoin dropped and reached 108,750.
✔️ During the downward move, volume increased, indicating strong selling pressure. However, as the price reached the 108,750 support and formed a range box, volume decreased, and with the start of the Saturday candle, the volume has dropped to its lowest level.
🎲 This box is formed above a very important support level, so breaking this box is crucial.
🔔 If the price breaks the box to the downside, the likelihood of breaking the support increases. However, one important thing to note is that shorting after breaking 108,750 is not an ideal trigger because the price might bounce from the support, causing a stop-loss.
📊 On the other hand, if the box breaks to the upside, we can assume that the price is correcting the downward move and could potentially retrace back to 111,605.
💥 If the price stabilizes above 111,605 or forms a higher high and low above 109,890, we can take this as the first sign of a bullish reversal.
🧩 Overall, neither shorting nor longing seems ideal at the moment, so I believe the best choice is to wait and see if the price either stabilizes below the support and moves downward or moves upward again, in which case we can consider entering a long position.
❌ Disclaimer ❌
Trading futures is highly risky and dangerous. If you're not an expert, these triggers may not be suitable for you. You should first learn risk and capital management. You can also use the educational content from this channel.
Finally, these triggers reflect my personal opinions on price action, and the market may move completely against this analysis. So, do your own research before opening any position.
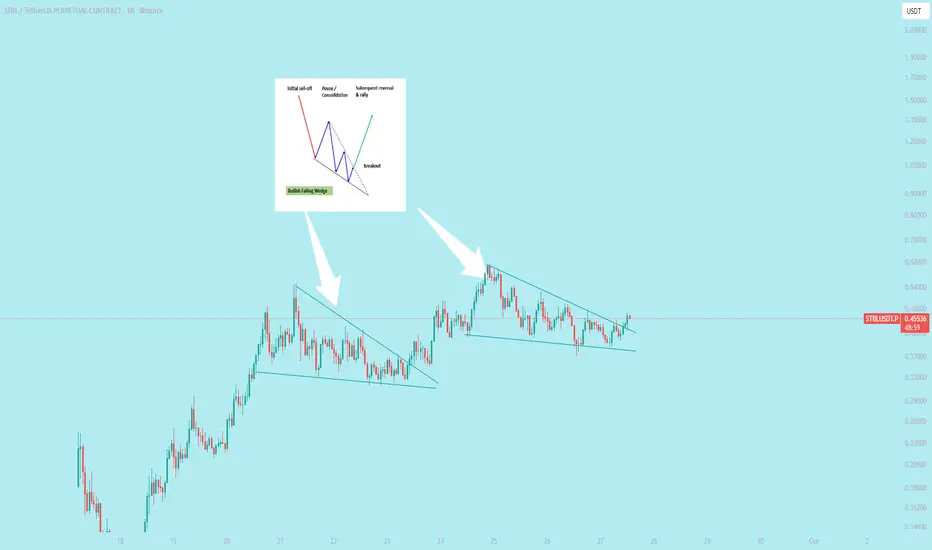
$STBL Breakout falling wedge pattern
`A falling wedge breakout is a bullish signal in technical analysis, occurring when the price of an asset, which has been trending downward in a tightening range, pushes decisively above the upper resistance line of the wedge formation. This indicates that selling pressure is weakening and a potential trend reversal to the upside is underway.`
**How to Trade a Falling Wedge Breakout (Simple)**:
1. **Spot the Pattern**: Find a falling wedge—price forms lower highs and lows, converging into a tighter range.
2. **Wait for Breakout**: Buy when price breaks and closes above the upper trendline with strong volume.
3. **Entry**: Enter long at the breakout or on a retest of the trendline as support.
4. **Stop-Loss**: Set below the lower trendline or recent low.
5. **Target**: Measure the wedge’s height at its widest, add it to the breakout point for the target.
6. **Manage Risk**: Use low leverage (3x-5x), risk 1-2% of your account, and trail stops to lock profits.
@everyone
SOLUSDT 1D - Bulls back in control with Golden Cross and channelOn the daily chart, SOLUSDT is forming a bullish continuation structure. After the Golden Cross (MA50 crossing MA200), the price is now pulling back toward the midline of the ascending channel and the 0.5 Fibonacci level at 166.38. This confluence with the broken trendline and 200 EMA makes this zone a prime technical area of interest.
Support: 166.38 (0.5 Fibo), EMA200 (161.77), broken trendline
Resistance: 182.84–189.67 (Fibo 0.705–0.79), 206.54, target - 255.93 (Fibo 1.618)
This retracement looks healthy, supported by higher volume during the prior bullish leg. As long as the 166.38–161.77 zone holds, continuation toward 206.54 and potentially 255.93 is on the table.
Fundamentally, Solana remains a key L1 narrative with strong traction in DePIN and AI-linked dApps. The rising TVL and investor sentiment support the trend.
Watch price action around 166 for confirmation - this is the battleground.

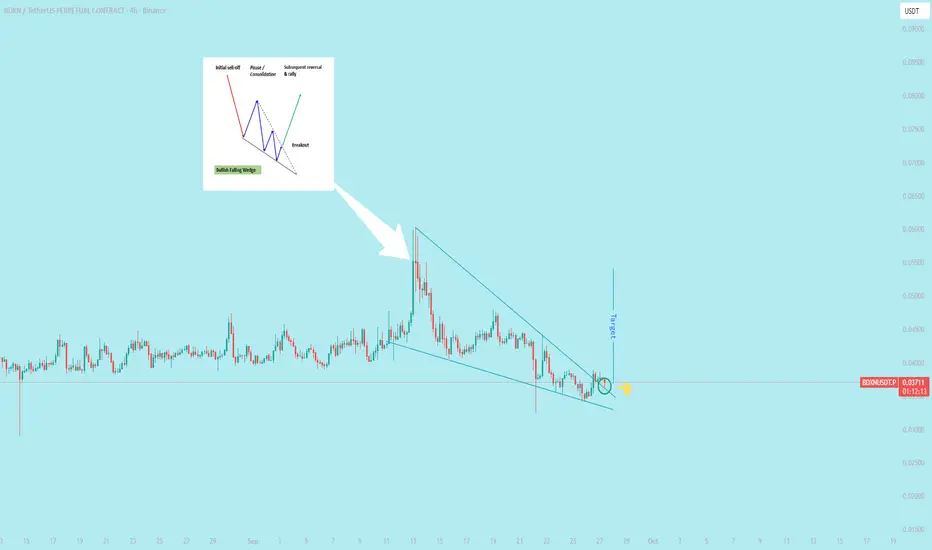
$BDXN Breakout falling wedge pattern A falling wedge breakout is a bullish signal in technical analysis, occurring when the price of an asset, which has been trending downward in a tightening range, pushes decisively above the upper resistance line of the wedge formation. This indicates that selling pressure is weakening and a potential trend reversal to the upside is underway.
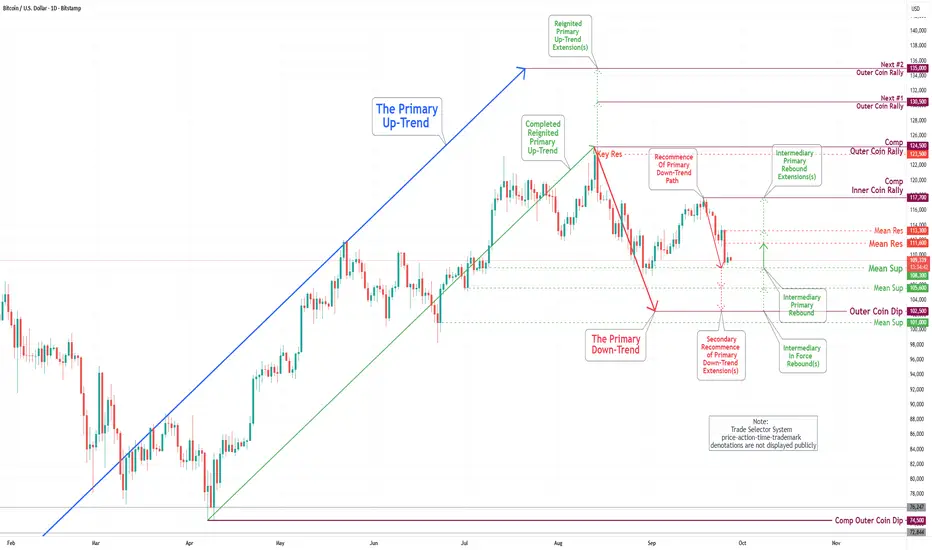
Bitcoin(BTC/USD) Daily Chart Analysis For Week of Sep 26, 2025Technical Analysis and Outlook:
In the most recent trading session, the Bitcoin market experienced a significant decline, surpassing Mean Support levels at 114500 and 111500, and is currently fluctuating around the Mean Support level of 108300. Consequently, Bitcoin is continuing its trajectory in a primary downward trend, with the primary target identified as the Outer Coin Dip 102500.
Current analysis suggests a modest likelihood that the continuation of the primary downtrend could lead to a retest of the Mean Resistance at 111600, potentially extending to the Mean Resistance at 113300.
Nevertheless, it is essential to acknowledge that the prevailing sentiment within the Bitcoin market remains bearish. Following the conclusion of the primary downtrend at the outer support level of 102500, it is anticipated that Bitcoin will resume its upward trajectory.
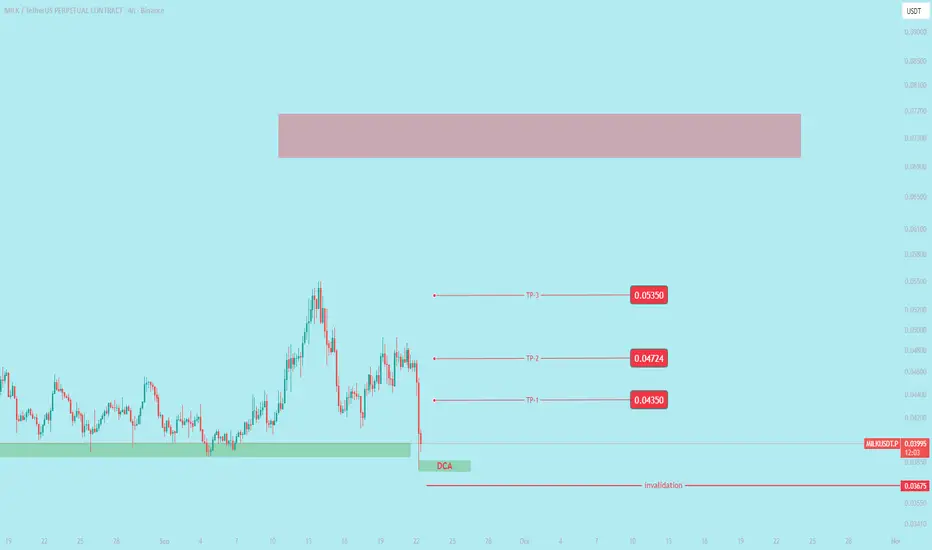
$MILK LONG TRADE IDEAI hope everyone understands risk management well. I am taking a long trade in milk, and you can follow along too. The targets are mentioned in the chart.
$BARD Performing Bullish Ascending TriangleA bullish ascending triangle is a continuation chart pattern in technical analysis that signals a likely breakout to the upside. The pattern forms when an asset's price consolidates between a flat upper resistance line and an upward-sloping lower trendline, indicating that buyers are steadily gaining strength.
How to trade the pattern
Spot the pattern:
Look for an existing uptrend, followed by a period of consolidation that forms a horizontal resistance and rising support line. The pattern is more reliable on longer timeframes, such as daily or weekly charts.
Wait for the breakout:
Enter a long position only after the price closes decisively above the horizontal resistance line. An entry is strongest when confirmed by a spike in trading volume.
Set a stop-loss:
To manage risk, place a stop-loss order just below the breakout level or the most recent higher low within the triangle.
Determine a profit target:
A common strategy is to measure the height of the triangle at its widest point (the beginning of the pattern) and add that distance to the breakout price. This provides a target for the potential upward move.

BTC LOOKS POSITIVE ON LOW TIME FRAME - UPDATE 27-09-2025BTC/USDT Update
On the low time frame, BTC has turned positive, showing signs of recovery after consolidation.
Price action is now trending upward toward the main trend zone, which will be the key resistance area to watch.
Key levels:
Low time frame zone → currently acting as support after the bounce.
Main trend zone → upcoming resistance. A clean breakout and confirmation above this level would strengthen the bullish case.
Upside scenario: If BTC can reclaim and hold above the main trend zone, momentum could expand strongly, shifting structure back into an uptrend.
Downside risk: Failure to break into the main trend zone could keep BTC stuck in sideways or corrective action.
📌 Summary
BTC is up on the low time frame → short-term momentum is bullish.
Next target: main trend zone for confirmation.
Break above main trend = uptrend confirmation; rejection = sideways risk.

IMX ABOUT TO BREAK MAIN LEVEL ON WAY - UPDATE 27-09-2025📊IMX/USDT Update
IMX has successfully moved above the low time frame zone, showing early signs of strength.
Price is now approaching the main trend level (around 0.708 – 0.715). This is the critical zone where confirmation could trigger the next bigger move.
Key levels:
0.708 – 0.715 → main trend resistance. Breakout here would confirm strength.
0.654 → cycle support. As long as this level holds, the bullish structure remains valid.
0.969 – 1.00 → breakout target zone.
Upside scenario:
If IMX clears the main trend zone, probability increases for a breakout rally toward $0.95 – $1.00.
Downside risk:
If IMX fails to break the main trend and falls back below 0.708, sideways consolidation could continue, with 0.654 as the must-hold support.
📌 Summary
IMX is above the low time frame zone → momentum is improving.
Main trend breakout above 0.715 = increased probability of rally.
Target: $0.95 – $1.00 if breakout is confirmed.
Support: $0.654 remains the cycle base.

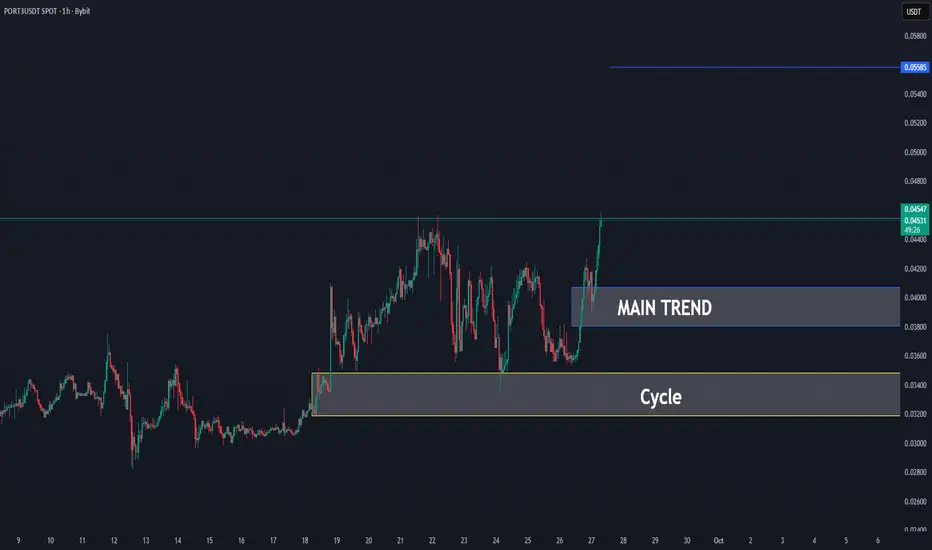
PORT3/USDT UPDATE ✅PORT3/USDT Update
The coin has activated its cycle after holding and bouncing strongly from the cycle zone (~0.032 – 0.034).
It has now also cleared the main trend zone (~0.038 – 0.040), confirming momentum shift.
Key levels:
Cycle base: 0.032 – 0.034 → must-hold area for long-term bullish cycle.
Main trend breakout: 0.038 – 0.040 → successfully reclaimed, now acting as support.
Next resistance/target: 0.053 – 0.055 → upside level to watch if momentum continues.
Upside scenario:
With the cycle activated and the main trend reclaimed, price has room to expand toward 0.053 – 0.055 in the coming sessions.
Downside risk:
Losing 0.038 – 0.040 again would weaken the breakout and increase risk of retest toward the cycle base (0.032).
📌 Summary
Cycle activation confirmed above 0.032.
Main trend breakout confirmed above 0.040.
Target: 0.053 – 0.055 if momentum continues.
Support: 0.038 (main trend) & 0.032 (cycle).
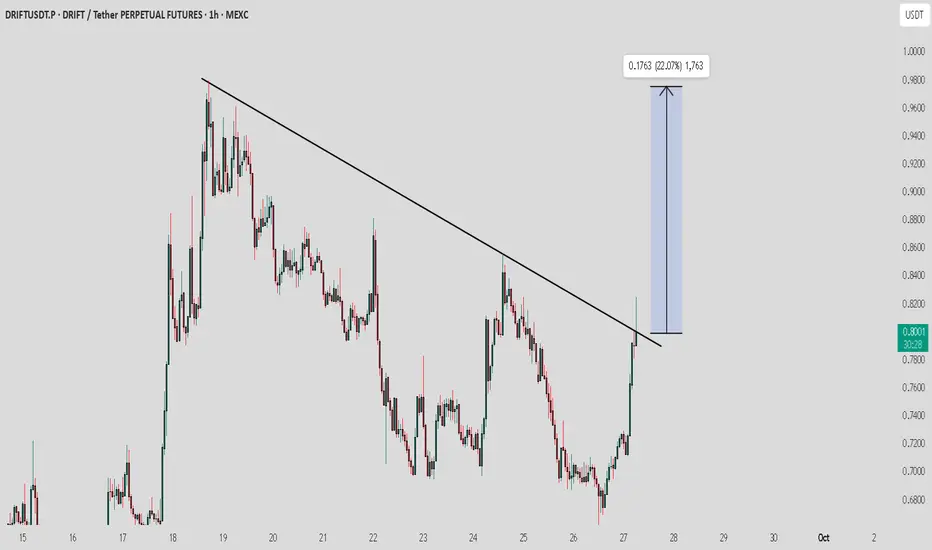
DRIFT / USDT : Trying to breakout with potentialDRIFT / USDT is breaking out from trend line resistance with strong potential. If momentum holds, we could see a sharp short-term rally of 20–30%.
Always manage risk properly and wait for confirmation of the bullish move.
BTCUSD – Short-term Downward Channel.....BTCUSD – Short-term Downward Channel, Accumulation Before a Potential Rally
Good day traders,
On the H4 timeframe, BTC is moving within a short-term descending channel. After testing a strong support level, selling pressure has started to ease. That said, the 107.4k zone has yet to be retested, and it is quite likely the price will revisit this level once again.
Technical Outlook
Over the past week, BTC has traded in a highly technical manner – with clear ranges, precise reversal points, and a sustained channel structure.
Key Support: around 107.4k, coinciding with the Long Entry Zone.
Short-term Resistance: 110k – 111k, an area where price has frequently reacted during recovery moves.
Fundamental Perspective
From a fundamental standpoint, there are currently few factors pointing to a deeper decline in BTC. Furthermore, historical patterns suggest that October is often a month where BTC and the wider crypto market tend to recover. This underpins the likelihood of a strong rebound once support has been fully tested.
Trading Scenarios
Short towards support
Entry: 110.3k
SL: 110.8k
TP: 109k – 107.6k
Long at strong support
Entry: 107.4k
SL: 106.8k
TP:Strong reaction: hold the trade, adjust SL to breakeven, and aim for higher levels in line with the broader uptrend.
Weak reaction: close around 109k for a short-term gain.
Conclusion
Short-term: preference is to look for short opportunities near 110.3k, targeting a move back towards support.
Medium-term: watch for long entries around 107.4k, with the expectation that BTC could resume an upward phase into October.
Risk Management
Adhering to stop-losses is essential, particularly for longs at support, as this is the pivotal level that may determine BTC’s next direction.
This represents my personal outlook on BTC heading into the weekend. Please take it as a reference and adapt it to your own strategy.
👉 Follow me to share scenarios and receive the quickest updates when price structure shifts.

CYCLE UPDATE IMX/USDT AFTER CONFIRMATION TO up $2 in 2025📊Immutable - IMX/USDT – Cycle Update 2025
IMX has completed a long accumulation phase after months of sideways trading and is now entering a new cycle structure.
It happened before from the same trend line
Upside scenario:
A sustained reclaim above 0.70 – 0.75 signals strength and could trigger the start of the new volume.
From there, the next major resistance levels to watch are 1.40 (mid-cycle confirmation) and 2.00 – 2.25 (cycle target).
Cycle projection:
As shown on the chart, IMX could accelerate from the cycle base into a parabolic run toward $2.00+ in 2025.
First test will be a reclaim of $1.00+, followed by momentum expansion once $1.40 is cleared.
📌 Summary
Cycle breakout zone: $0.70 – $0.75.
Mid-cycle confirmation: ~$1.40.
2025 cycle target: $2.00 – $2.25.

BNB Swing Long Idea - TTKZ Model📊 Market Sentiment
FED has resumed its rate-cutting cycle, starting with a 0.25% cut in September, with two more 0.25% cuts expected in the coming months. Additionally, institutional liquidity inflows have accelerated as the U.S. officially adopts crypto as part of its reserves. While inflation remains elevated, the weakening labor market is forcing the FED to ease, driving more capital into risk-on assets.
📈 Technical Analysis
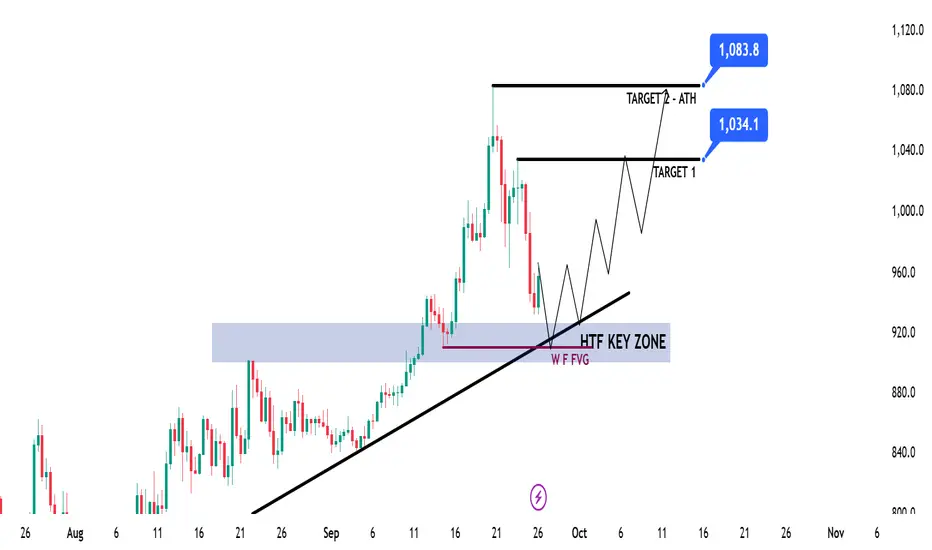
Price is making new all-time highs continuously. The HTF Weekly–Daily structure remains bullish, so my bias is only long.
Currently, price is retracing toward the HTF bullish trendline and a HTF Key Zone, both of which I assume are strong levels for a potential bounce and continuation higher.
📘 Model to be used – Trendline Test w HTF Key Zone (TTKZ)
In this model, I look for a clear HTF trendline that continuously supports price. When price comes back to test that line, I check if there’s also a HTF Key Zone aligned for confluence. Strong overlapping zones create higher probability bounce areas for long setups.
📌 Game Plan
1-Wait for a test of the HTF trendline
2-Confirm test of the HTF Key Zone
🎯 Setup Trigger
I will be waiting for a 4H break of structure before entering the trade.
📋 Trade Management
Stoploss: Below the 4H swing low that creates the break of structure
Targets: TP1: 1034$ | TP2: 1083$
Once TP1 is reached, stoploss will be moved to breakeven.
💬 Like, follow, and comment if this breakdown supports your trading! More setups and market insights coming soon — stay connected!
⚠️ Disclaimer: This content is for informational and educational purposes only and does not constitute financial, investment, or trading advice. Always DYOR before making any financial decisions.
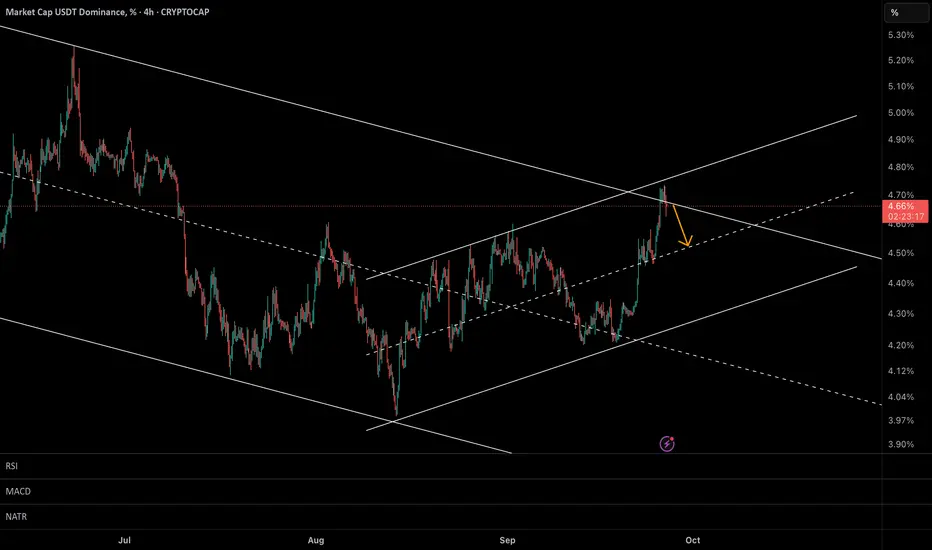
USDT Dominance at a Critical Turning Point–Will Correction BeginIn my previous analysis, I highlighted that USDT dominance had likely completed a 5-wave Elliott structure around 4.60%–4.65%, suggesting that a corrective ABC decline could follow.
That call played out accurately, with dominance stalling right at the projected resistance zone.
🔎 Current Update:
• Price has now hit the top of the larger descending channel as well as the upper boundary of the short-term rising channel → creating a confluence resistance near 4.70%.
• This level remains a high-probability reversal zone.
📊 Scenarios:
• 🔻 Bearish (More Likely):
Rejection from 4.65%–4.70% could confirm the corrective ABC pattern, targeting 4.30%–4.20% next.
👉 This would signal capital rotation back into crypto & altcoins.
• 🟢 Bullish (Alternative):
A confirmed breakout above 4.70% would open the door toward 4.90%, extending pressure on the crypto market.
⸻
📌 Conclusion:
Given the technical confluence, the odds still favor a pullback in USDT dominance, which could give altcoins some room to breathe in the coming sessions.
BANANA has formed a bullish Double Bottom pattern 📊 BANANA Market Update
BANANA has formed a bullish Double Bottom pattern ✅
It has broken out of the red resistance zone 🔴 and the first target is the blue line level 🎯

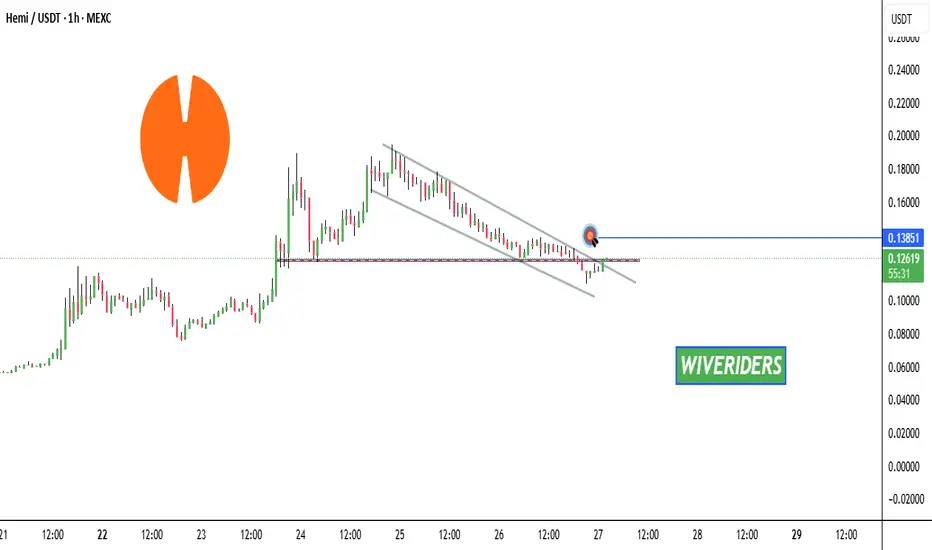
HEMI is testing the red resistance zone📊 $HEMI Market Update
$HEMI is testing the red resistance zone 🔴
If it breaks out with confirmation, the first target will be the blue line level 🎯
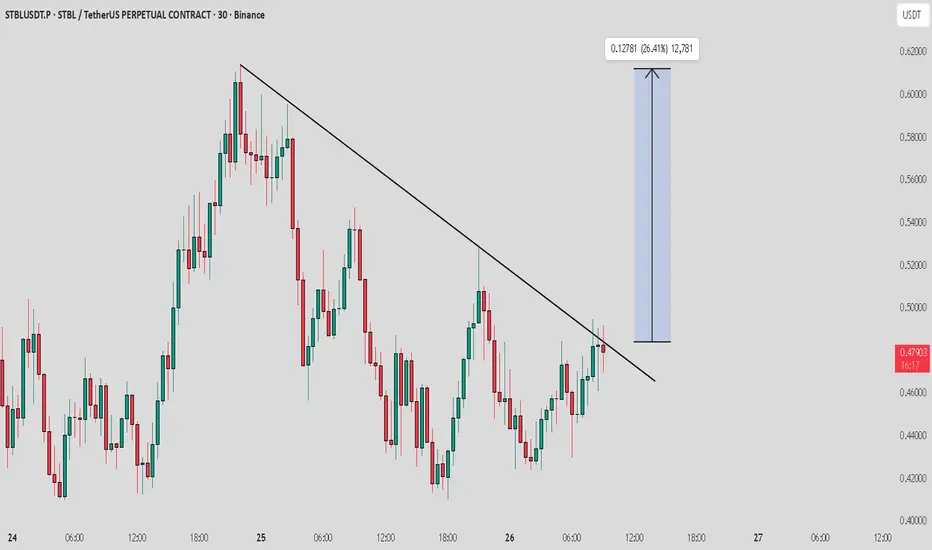
STBL / USDT : Short term rally expected if breakout doneSTBL / USDT is attempting to break out from trend line resistance. Keep it on your watchlist—if the breakout confirms, we can expect a strong short-term rally.
Always wait for confirmation before entering and manage risk properly.
BTC 1H: Selling pressure remains dominant.1. Trend Context
The short-term structure remains bearish, with the price trading below the EMA.
After breaking through the 111,200 – 112,000 zone, the market is forming a small correction.
2. Key Levels
Nearest Resistance: 110,700 – 111,800. Important zone to watch during this correction.
Main Support (Demand Zone): 108,000 – 108,500. Next target if the downtrend continues.
3. Scenario
Key Scenario : Currently, an uptrend line has been formed, indicating a slight recovery after the previous sharp decline. Wait for the EMA to move closer to the price and form a momentum accumulation zone, after which a first breakout through the uptrend line will appear.
Alternative scenario : If BTC sustains recovery to 110,700, sell-off at this level could be considered.
Please like and comment to support our traders. Your feedback motivates us to produce more analysis in the future 🙏✨

DOTUSD H4 | bearish drop offDOT/USD has rejected off the sell entry which and could potentially drop from this levle to the downside.
Sell entry is at 3.843, whichis a pullback resistance.
Stop loss is at 4.119, which is a pullback resistance.
Take profit is at 3.453, which acts as a pullback support.
High Risk Investment Warning
Trading Forex/CFDs on margin carries a high level of risk and may not be suitable for all investors. Leverage can work against you.
Stratos Markets Limited (tradu.com ):
CFDs are complex instruments and come with a high risk of losing money rapidly due to leverage. 65% of retail investor accounts lose money when trading CFDs with this provider. You should consider whether you understand how CFDs work and whether you can afford to take the high risk of losing your money.
Stratos Europe Ltd (tradu.com ):
CFDs are complex instruments and come with a high risk of losing money rapidly due to leverage. 66% of retail investor accounts lose money when trading CFDs with this provider. You should consider whether you understand how CFDs work and whether you can afford to take the high risk of losing your money.
Stratos Global LLC (tradu.com ):
Losses can exceed deposits.
Please be advised that the information presented on TradingView is provided to Tradu (‘Company’, ‘we’) by a third-party provider (‘TFA Global Pte Ltd’). Please be reminded that you are solely responsible for the trading decisions on your account. There is a very high degree of risk involved in trading. Any information and/or content is intended entirely for research, educational and informational purposes only and does not constitute investment or consultation advice or investment strategy. The information is not tailored to the investment needs of any specific person and therefore does not involve a consideration of any of the investment objectives, financial situation or needs of any viewer that may receive it. Kindly also note that past performance is not a reliable indicator of future results. Actual results may differ materially from those anticipated in forward-looking or past performance statements. We assume no liability as to the accuracy or completeness of any of the information and/or content provided herein and the Company cannot be held responsible for any omission, mistake nor for any loss or damage including without limitation to any loss of profit which may arise from reliance on any information supplied by TFA Global Pte Ltd.
The speaker(s) is neither an employee, agent nor representative of Tradu and is therefore acting independently. The opinions given are their own, constitute general market commentary, and do not constitute the opinion or advice of Tradu or any form of personal or investment advice. Tradu neither endorses nor guarantees offerings of third-party speakers, nor is Tradu responsible for the content, veracity or opinions of third-party speakers, presenters or participants.
