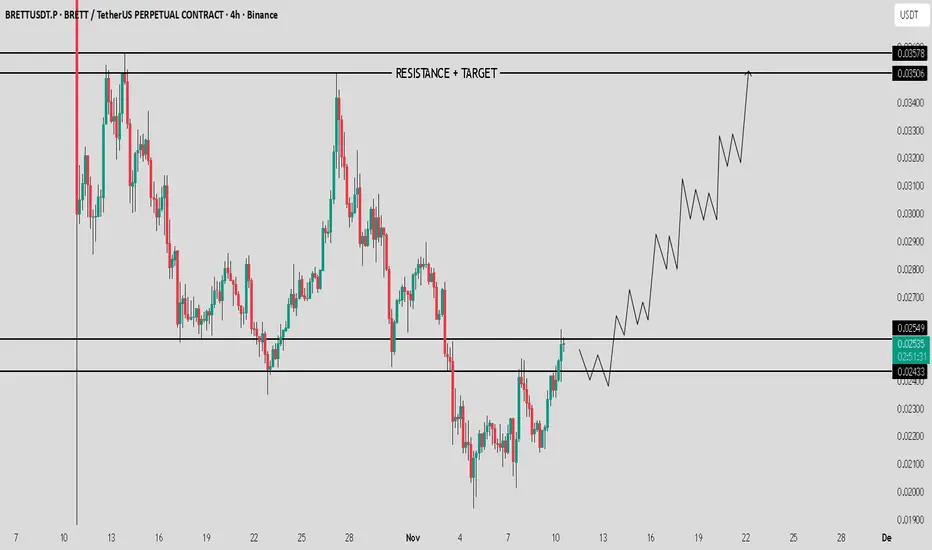
BRETT / USDT : 30-40% move ahead if breakout confirmsBrett / USDT is showing strong momentum and currently testing key zones.
A confirmed breakout from this level could trigger a 30-40% bullish move.
Wait for confirmation and manage risk wisely.
Cryptomarket
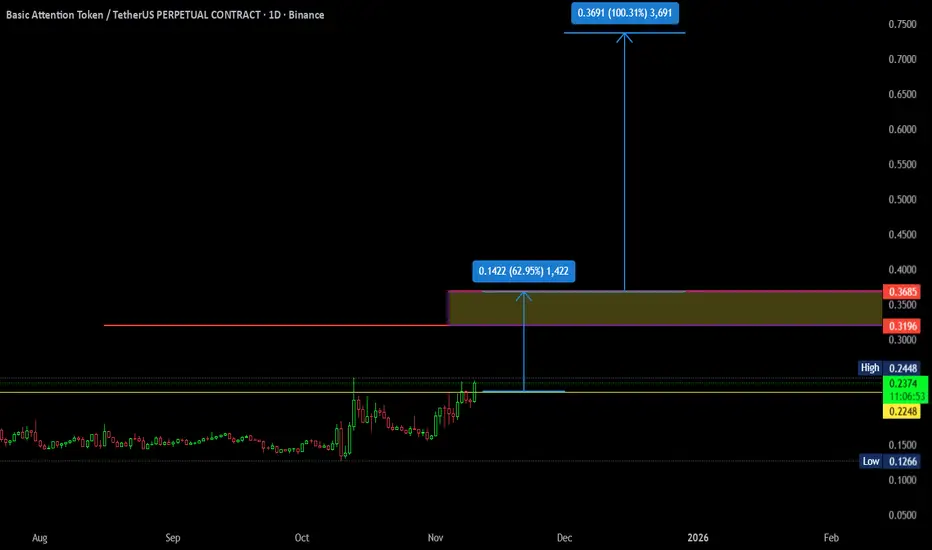
$BAT/USDT Analysis - VWAP-BasedThis analysis is based on VWAP (Volume Weighted Average Price) using monthly and daily charts.
Key Points:
- VWAP levels indicate significant support and resistance zones.
- The highlighted box represents the price expected on November 30 (note: November has 30 days, not 31).
- A daily close above $0.24 could signal a 62–100% potential upside.
Using VWAP across multiple timeframes helps identify both short-term and long-term trends.
💡 My strategy combines VWAP with Z-score deviations to pinpoint high-probability moves, this is what sets my approach apart.
TradeCityPro | Bitcoin Daily Analysis #216👋 Welcome to TradeCity Pro!
Let’s dive into the Bitcoin analysis. The market has finally started an upward move, and the triggers we set yesterday have been activated.
⏳ 1-Hour Timeframe
Yesterday, Bitcoin created a smaller range box between the 10,601 and 10,2489 levels, and after breaking the upper range of the box, the price moved up to the upper boundary of the main box at 10,3855.
📊 Volume increased throughout this move, and the strength of the green candles grew significantly. The 10,3855 resistance was also broken, and with the RSI entering the overbought zone, a sharp upward move began.
✅ This upward move continued to 10,6412, and after reaching this level, momentum started to slow down, and RSI exited the overbought zone. The price is now ranging below 10,6412.
🚀 Today’s trigger:
The key trigger for Bitcoin today is breaking the 10,6412 level. If this level is broken, the upward move will continue.
🔽 In case of a correction, if the price forms a higher low above 10,3855, the bullish trend will remain intact, and the next upward leg could start.
⚖️ For a short position, I don’t think we should pursue it yet. We should wait for the trend to turn bearish again. The confirmation for a bearish trend will come if the price stabilizes below 10,3855.
❌ Disclaimer ❌
Trading futures is highly risky and dangerous. If you're not an expert, these triggers may not be suitable for you. You should first learn risk and capital management. You can also use the educational content from this channel.
Finally, these triggers reflect my personal opinions on price action, and the market may move completely against this analysis. So, do your own research before opening any position.

Bitcoin Dominance Breakdown Ahead? Altseason Signals Emerging!Analysis:
BTC Dominance is showing strong signs of weakness.
After a failed breakout and rejection from the upper boundary of the descending channel, dominance is now testing the short-term ascending trendline (orange).
Losing this level (~59%) could trigger a deeper drop toward 57% and possibly 54.5%.
Main scenario (65% probability):
🔻 Breakdown below 59% → bearish continuation → capital rotation into altcoins.
Alternative scenario (25%):
⚖️ Sideways movement between 59–61% before decision.
Bullish invalidation (10%):
🟢 Daily close above 61.5% → short-term BTC strength continuation.
Momentum and structure both favor downside — altcoins may soon take the lead.

TradeCityPro | WLFI Coin: Eyes on Trump’s Project for Big Moves👋 Welcome to TradeCity Pro!
In this analysis, I want to review the WLFI coin.
✔️ Before we dive into the analysis, let me tell you that this coin is part of the World Liberty Finance project.
🔔 This is a DeFi project linked to Trump, which hasn't fully launched yet, and its token was recently listed. Given Trump's significant influence on social media, it might be worth keeping an eye on this coin, as it could potentially make sharp moves.
📅 Daily Timeframe
Since its listing in September, this coin has been trading in a range below the 0.2423 resistance level for about a month. After that, it experienced a sharp drop in line with the overall market downturn on October 10th.
📊 Currently, the main support level for this coin is at 0.1127, and the price is facing resistance at 0.1518.
🧩 One thing to note is that this chart is only two months old, so all the support and resistance levels in it have been formed within this short period. Therefore, don't view these levels as extremely strong and unbreakable. The token hasn't fully discovered its real value yet.
🧮 Moving on with the analysis:
If the price breaks 0.1518, the next resistance levels are 0.1804 and 0.2423. I will personally start buying this coin once the 0.2423 level is broken. The earlier trigger would be the break of 0.1518.
💡 For a bearish scenario, it’s quite clear:
A break of 0.1127 would confirm the start of a downward move.
📝 Final Thoughts
Stay calm, trade wisely, and let's capture the market's best opportunities!
This analysis reflects our opinions and is not financial advice.
Share your thoughts in the comments, and don’t forget to share this analysis with your friends! ❤️

Bitcoin Daily Analysis #12 — November 10, 2025
Bitcoin has triggered our entry setup 🔔
As I mentioned before, fear during FOMO candles means nothing — what truly matters is structure and confirmation.
It seems that Bitcoin has found support around the $100,000 zone and could be starting a new bullish leg 🚀
Any higher low above $104,000 will serve as a confirmation of an uptrend ✅
Disclaimer:
This content is for informational purposes only and does not constitute financial or investment advice. © DIBAPRISM
Larry D.Kohn

We are NOT finished.Weekly close has come in and, as expected, BTC has closed above the band once again.
Since the start of this cycle, Bitcoin has had the following pullbacks:
September 2023: 21%
August 2024: 34%
April 2025: 33%
November 2025: 21%
Tell me, people—what has changed? Has Bitcoin done anything different from what it’s been doing all cycle?
NO!
Yet 95% of sentiment is extremely bearish. The other 5% who aren’t bearish are patting themselves on the back because they “called the top”—you know, the same “top” everyone is staring at, the same top that can be calculated using basic math from the last two cycles.
Since I joined this space, I have NEVER seen sentiment this bad after only a 20% pullback. Complete madness. The only time I saw emotion this raw was during the COVID crash.
This level of bearish sentiment is what you find at the BOTTOM of rallies, not the top.
The idea that the top is in just because of “cycle length” is invalid—especially when EVERYONE is thinking the exact same thing. It’s never that easy with Bitcoin.
Mark my words: it WILL rally above 200k in 2026, and everyone who sold this year will be buying back in higher. That’s the nature of these markets.
Every cycle, you have to stay grounded, stick to the technical data, and ignore all the noise.
The technical are still holding strong—we are NOT finished!

Zcash: Privacy at the edge of the next crypto cycleCrypto isn’t new anymore. We’re past the toddler years. Total crypto market cap has surged past $3 trillion again, and maturity is following price. Each cycle brings innovation. The next one will be about infrastructure, scalability, compliance, privacy.
Zcash fits that last bucket. We must saw from the outset that crypto is different to other asset classes in that it is very much sentiment driven. The network grows and becomes self-fulfilling.
It's a sentiment asset class, based on utility, confidence, and durability. Liquidity drives interest, interest builds trust, trust scales networks.
Zero-knowledge proofs aren’t theory, they’re live. Zcash lets you send fully encrypted transactions. No blockchain breadcrumb trail. That’s a big deal in a world that’s getting more watched.
Regulators are moving. The EU’s MiCA framework is here. The US Treasury wants more visibility over crypto flows. Even stablecoins are facing surveillance. But there’s a line, privacy isn’t crime. Legitimate financial privacy will be demanded by users who value security, not secrecy.
Zcash is one of the few projects positioned for this. Its tech is peer-reviewed, its encryption is compelling. As crypto grows, so will scrutiny. And with that, demand for tools that offer privacy without leaving the system.
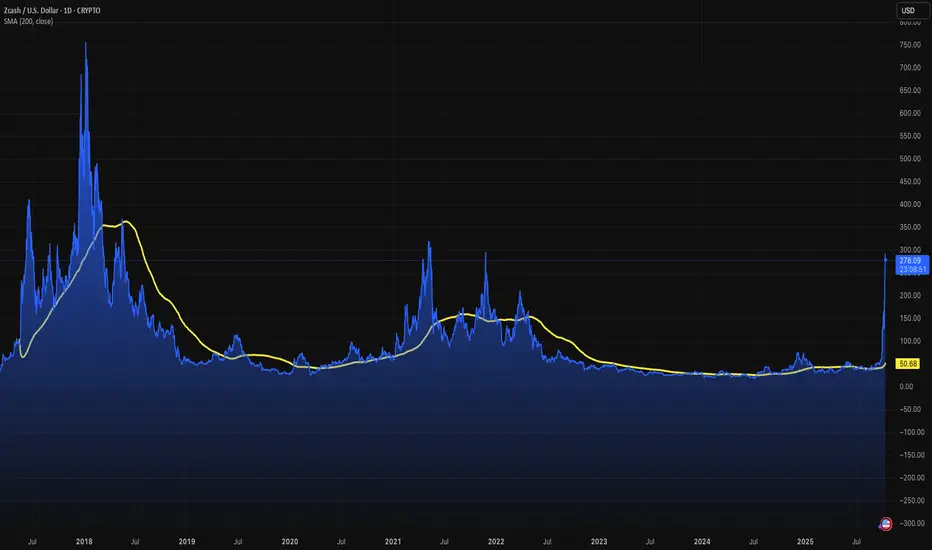
With a market cap of $3.8 billion, Zcash is a fraction of Bitcoin’s $1.2 trillion or Ethereum’s $450 billion (as of October 2025). Yet, it outshines competitors like Monero, whose $3.2 billion market cap lags despite similar privacy goals, thanks to Zcash’s superior zero-knowledge tech and transparent framework that regulators can trust.
While privacy coins face scrutiny, Monero was delisted from major exchanges like Binance in 2024, Zcash’s design mitigates these risks, balancing user privacy with regulatory accountability.
Add to your watch list and accept this will have a lot of volatility in the coming months.
The forecasts provided herein are intended for informational purposes only and should not be construed as guarantees of future performance. This is an example only to enhance a consumer's understanding of the strategy being described above and is not to be taken as Blueberry Markets providing personal advice.
$ASTER Update📊 SEED_WANDERIN_JIMZIP900:ASTER Update
SEED_WANDERIN_JIMZIP900:ASTER is testing the red resistance zone 🔴
If it breaks out above, it could confirm a bullish setup 📈
The first target would be the green line level 🟢

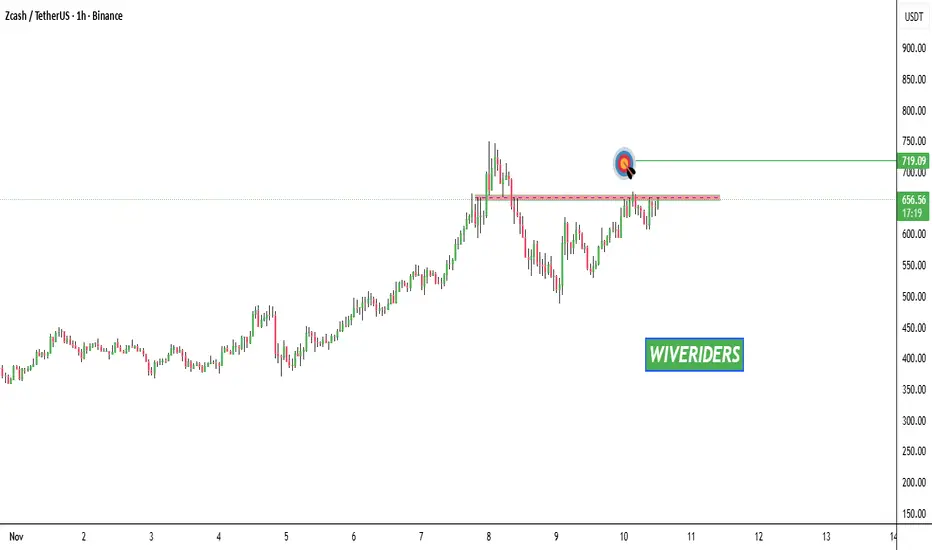
$ZEC Update📊 CRYPTOCAP:ZEC Update
CRYPTOCAP:ZEC is testing the red resistance zone 🔴
If it breaks out above, it could confirm a bullish setup 📈
The first target would be the green line level 🟢
$PUMP Update📊 NYSE:PUMP Update
NYSE:PUMP is testing the red resistance zone 🔴
If it breaks out above, it could confirm a bullish setup 📈
The first target would be the green line level 🟢

TRUST Update📊 TRUST Update
TRUST is testing the red resistance zone 🔴
If it breaks out above, it could confirm a bullish setup 📈
The first target would be the green line level 🟢

$STRK Update📊 NASDAQ:STRK Update
NASDAQ:STRK is testing the red resistance zone 🔴
If it breaks out above, it could confirm a bullish setup 📈
The first target would be the green line level 🟢

IS CRYPTOCURRENCY BACK AT IT?Most cryptocurrency are at the range/point of reversal back to the top. With much anticipation and investment made we will be looking at a new ATH. This is followed by a tap into the monthly IRL especially for markets like BTC,ETH and others in line with a strike of reversal. We will hope to see further confirmations as there has been a 4hr market shift and a sweep above last Friday high gearing it down to a smart money support zone for an opportunity to buy, invest and HODL.
FOLLOW FOR MORE TIPS

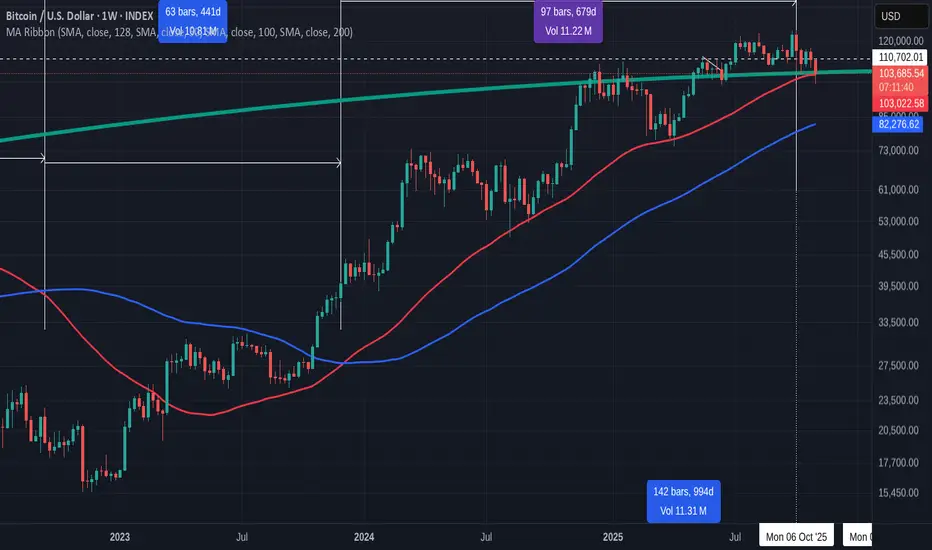
How important is This Weekly Candle close today ? VERY
Really simple to see.
On 2 previous occasions this cycle, were the PA has reached down and touched the 50 Week SMA (Red), it started the next week with a Push and followed with a Green week Candle.
Yesterday, PA dropped below that 50 SMA and today, it has risetn o sit on it, leaving a wick lower, like on the other occasions.
Zoomed in is easier to see
WE NEED TI KEEP THIS
This chart shows us two other things we should pay attentin to.
First is that the day count above is the expected point where the ATH is reached on a cycle, using the average of previous cycles, from when the 50 SMA rises above the 100 ( blue) and goes to ATH.
We had the current ATH Ver near this point.
Secondly, That Blue Arc is the Arc f resistance that has rejected EVERY ATH since BTC started.
We need to rise above this this cycle or PA will be driven down into Negativity, as shown below
I have NO DOUBT we can do this
But we need to start by keeping the PA above that 50 week SMA
All eyes on BITCOIN
Ether Breakout ImminentWith the Bitcoin testing the key trend, Trump's team start to talk about crypto, a lot. I think the ones who needed to buy the dip has finished their jobs. After that a sudden momentum to end shutdown begins but first attempts failed thus far. But the change of dynamics are clear and it could be positive for crypto and metals.
I will bet on upward breakout for Ether, and please check the BTC idea as well:

FIL / USDT: Breaking down from channel,10-20% downside potentialFIL / USDT is breaking down from the parallel channel.
Watch for clear confirmation to catch a 10–20% downside move.
⚠ Manage risk wisely and don’t enter without proper confirmation.

MSTR HIGH PROBABILITY BIG BULL MOVE SOON!!!🚨 MSTR HIGH PROBABILITY BUY SETUP 🚨
* Here We Can See Clearly The Next Potential Moves For MSTR Coming Hours/Days.
* Keep Your Eyes Close On Your Trading Positions.
* Happy PIP Hunting Traders.
FXKILLA.

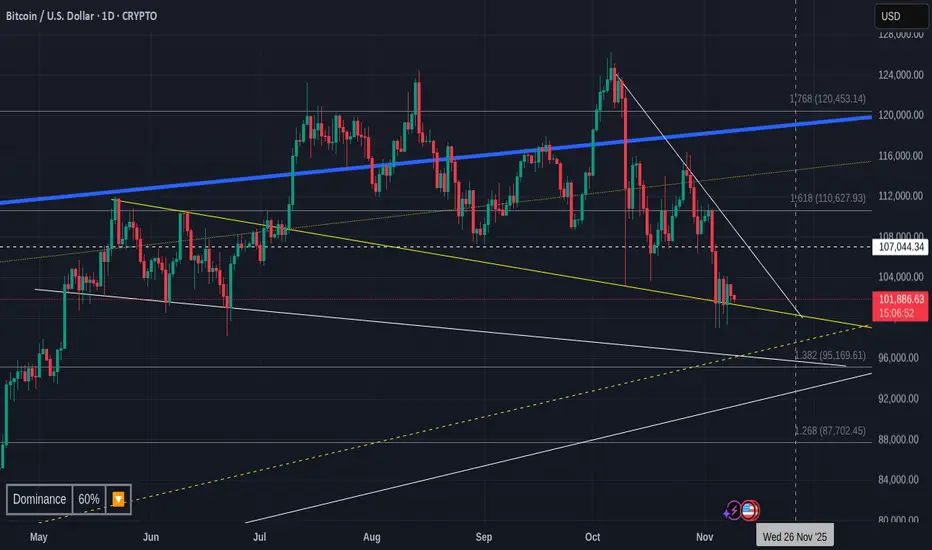
Bitcoin Trend lines tell same story as all the complicated TA
There are things to be said for complicated and highly technical TA using in dicators that read all the online data available.
But at the end of the day, Trend lines can very often tell you exactly the same thing.
The Chart above simply shows the lines of support and Resistance.
The Current line of support comes off a line made in May / June this year
The line of resistance comes from a line created in October this year
These 2 lines meet towards the end of the month and if PA remains between these 2 till then, that will create the expected RED month candle.
If we drop below this area, we arrive at 2 other trend lines that habe an intersection around 96K.
This is a Zone quoted by any analysts including myself, as an area of Make or Break.
But also nothe the line of support below that too....around 88K - 90K
This is also an area quoted by highlt technical indicators.
And just a quick Zoom out to see the whole picture.
TradeCityPro | JUP Bearish Bias Near Key Support Zones👋 Welcome to TradeCity Pro!
In this analysis, I want to review the JUP coin,one of the projects in the Solana ecosystem, with a market cap of $1.09 billion, currently ranked 64th on CoinMarketCap.
⏳ 1-Hour Timeframe
On the 1-hour timeframe, this coin has formed a structure between the 0.3357 and 0.3591 levels, and has already faked out the range once to the upside and once to the downside.
🔍 After the fakeout to the upside, the price made a downward move toward the 0.3357 support, and as you can see, the selling volume in the red candles has been very strong.
🎲 At the moment, I believe the sellers have much more control in the market compared to the buyers, so the probability of a further downward move is higher for now.
📈 In that case, we can open a short position if the 0.3357 level breaks. One important thing to note is that the zone between 0.3260 and 0.3357 is a very strong support area where many buyers are active.
📊 So if buying volume enters this range, we may see a shift in market strength. In that case, breaking the 0.3488 level could give us a long position.
📈 The main long trigger for this coin is at 0.3591. However, since the price has already faked this level once, it's better to wait for a reaction to refine the exact breakout point.
📝 Final Thoughts
Stay calm, trade wisely, and let's capture the market's best opportunities!
This analysis reflects our opinions and is not financial advice.
Share your thoughts in the comments, and don’t forget to share this analysis with your friends! ❤️

3th time is a charmxrm is trying to break out the larger consolidation fase. It will gravitate to the next feb (1.272).
BB are expanding which means prices is pushing up and a impulsive wave is starting!

TradeCityPro | Bitcoin Daily Analysis #215👋 Welcome to TradeCity Pro!
Let’s move on to Bitcoin analysis. Today is Sunday, and the price is ranging inside a new box it has formed. The breakout from this box is critical and could be the start of the next move.
⏳ 1-Hour Timeframe
On the 1-hour timeframe, Bitcoin has formed a large ranging box between the 100,308 and 103,855 levels, and the price has already faked out once to the downside.
🔔 After this fakeout, a bullish move began, pushing the price up to 103,855.
✅ However, since this move happened on Friday and we entered the weekend afterward, the market's momentum has faded, and now, the price is ranging within a much smaller box.
🎲 This range is forming between 101,601 and 102,489, and breaking either of these levels could give us a position.
💡 A key point to remember is that volume must increase in the direction the price breaks. If volume diverges from the price, the move is likely to be a fakeout.
☘️ The main triggers are still 100,308 and 103,855. Breaking either of these zones will set off the next major move in the market.
❌ Disclaimer ❌
Trading futures is highly risky and dangerous. If you're not an expert, these triggers may not be suitable for you. You should first learn risk and capital management. You can also use the educational content from this channel.
Finally, these triggers reflect my personal opinions on price action, and the market may move completely against this analysis. So, do your own research before opening any position.

OTHERSBTC – Altcoin Market Bottoming Before Major Breakout (1W)The altcoin market (OTHERSBTC) has been forming a massive falling wedge since 2021, and we’re now sitting right at the top resistance of that pattern.
Historically, every time this setup appeared, it marked the end of a bear cycle and the start of an altcoin expansion phase.
On the weekly TPA MACD, there’s a clear bullish divergence — momentum is rising while price made lower lows. This is exactly how previous alt seasons started (2017, 2020).
📅 What I expect:
November 2025: Still some sideways action (0.10–0.13 zone).
Dec 2025 – Q1 2026: Possible breakout → first targets 0.16–0.20.
Mid–Late 2026: If momentum continues, we could see a full altseason with 0.30–0.35 area retest.
Personally, I’m accumulating quality alts here and planning to hold through 2026. This looks like the final accumulation phase before the next big rotation out of BTC dominance.
⚠️ This is just my personal view based on the chart and what I’m planning to do — not financial advice.
