USDT dominance (USDT.D) USDT dominance (USDT.D) remains elevated and is in a major uptrend, indicating that a significant portion of crypto capital is still parked in stablecoins and in a risk-off position.
Current Structure:
USDT.D is around 5-6%, having broken above a long-term descending trendline that had capped dominance since 2022. This is typically a cautionary signal for risk assets when it remains above that breakout level.
From a technical perspective, USDT.D still appears to be in a large corrective pattern, with significant downside support around 4.2% and 3.8%; losing those levels would confirm a new downtrend in dominance and is usually accompanied by a strong rally in BTC and altcoins.
DYOR | NFA,
Cryptosanders

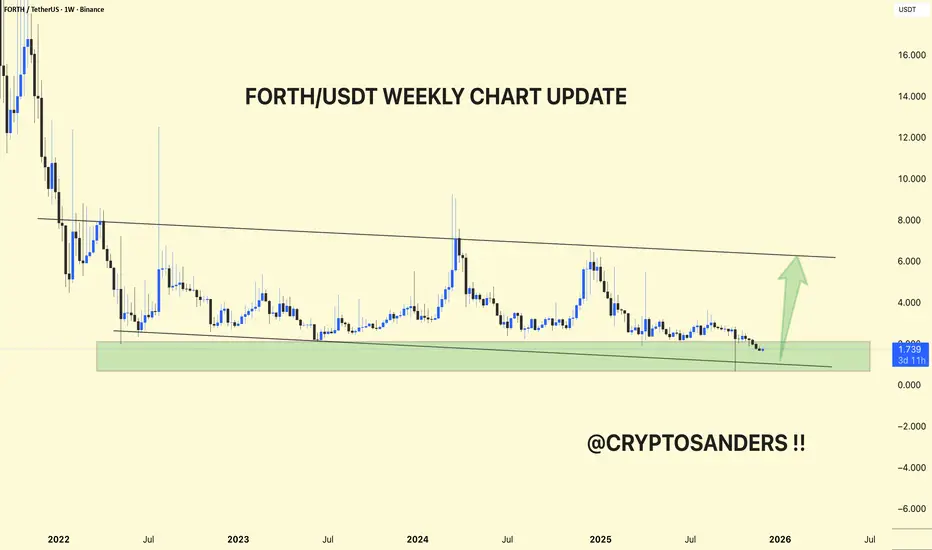
FORTH/USDT WEEKLY CHART UPDATE !! The weekly chart, FORTH/USDT, is still in a prolonged downtrend, but is once again within a large demand zone where previous rallies originated.
The price has been trending down below a major downward resistance line since 2022, with each upward impulse failing near that trendline and then retracing back to the same green support band around 1.4–2.0 USDT.
The latest candles have been holding within this green zone and the slightly rising underlying trendline, making this area a key higher-timeframe accumulation and invalidation zone for the pair.
As long as green support holds, a technical bounce towards downward resistance near 5–6 USDT remains a realistic medium-term scenario, matching the upward arrow on your chart.
A clean weekly close below the green band would break the multi-year base and create room for new lows, so risk on any long bias should be strictly managed below that zone.
DYOR | NFA
MYX/USDT 4HOUR CHART UPDATE !!MYX/USDT has broken out of the 4H symmetrical triangle and is now retesting the breakout area around 3.1–3.2, making the bullish setup valid as long as this zone holds.
The price compressed between a descending resistance line and an ascending support line for weeks, then finally broke above the upper boundary and made a local high near 3.4–3.5 before retracing.
The ascending base trendline currently intersects just below 3.0; this, combined with the old triangle top near 3.1, creates the necessary support for a breakout.
Buyers defend 3.0–3.1 and move back up from here, then continue the uptrend towards 3.8–4.0, followed by 4.5 and 5.0 as indicated by the arrows.
A clear 4H close below 3.0 and inside the triangle would turn this into a fakeout and reveal a lower level with rising support, so that zone is a logical invalidation for the current bullish bias.
DYOR | NFA

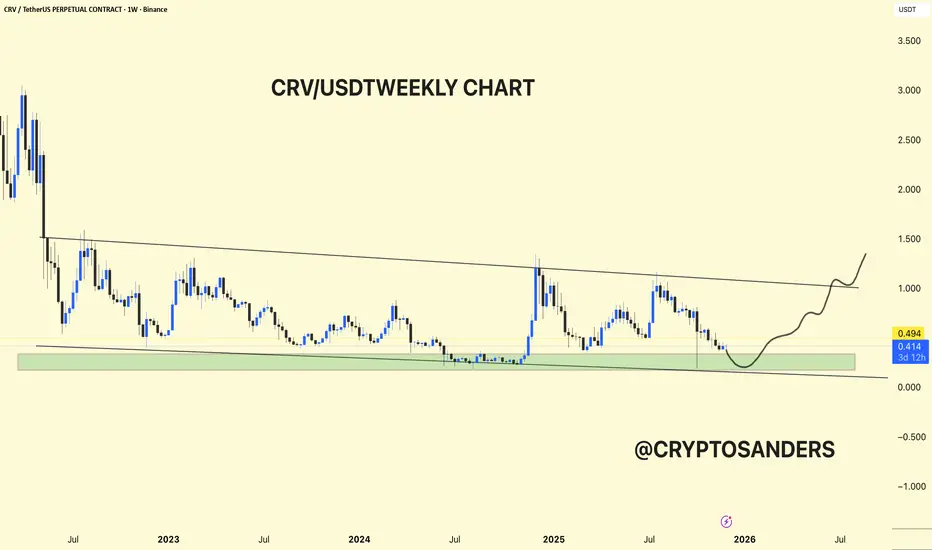
CRV/USDT WEEKLY CHART UPDATE !! The weekly chart, CRV/USDT, is still in a long-term downtrend, but within a large accumulation support zone, where strong surges have previously occurred.
The price has been following a large downward trendline since 2022, with each rally being rejected near that line and then retracing back towards the same horizontal green demand band around 0.35–0.45 USDT.
The current weekly candles are again parked in this green zone, which has repeatedly acted as a floor over the past few years, suggesting a higher-timeframe accumulation or base rather than a new breakdown so far.
The bullish view on the chart shows a rounded bottom forming at this support, followed by a potential move towards the downward trendline and then a breakout towards the 1.00–1.50 region if buyers can maintain momentum.
The bearish risk is that a clean weekly close below the green zone will invalidate the base and make room for a new lower low, so this support acts as a key invalidation zone for any medium to long-term bias.
DYOR | NFA
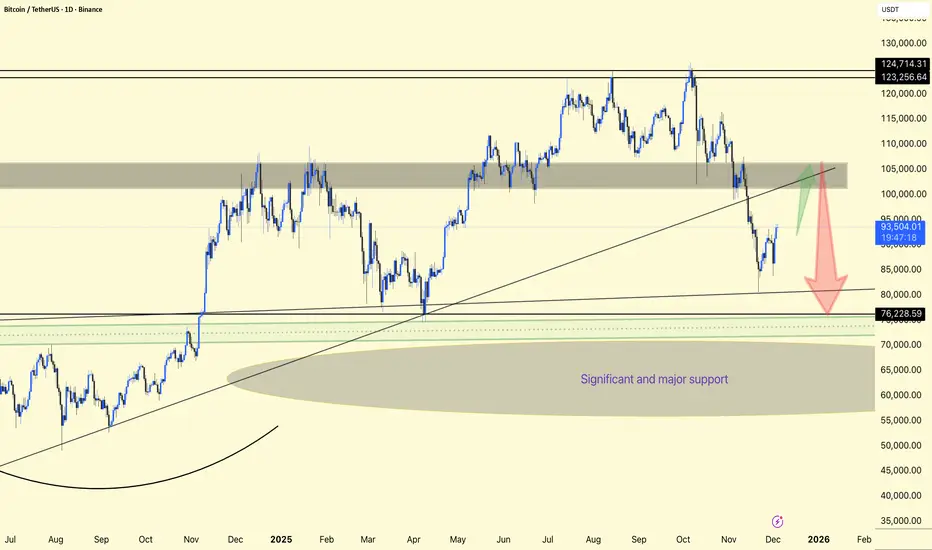
BTC/USDT 1DAY CHART ANALYSIS. Bitcoin (BTCUSDT) is in a corrective phase within a larger bullish structure, currently bouncing off support and heading back towards a large supply zone around 102,000–106,000 USDT.
The price was previously rejected from the top resistance band of 123,000–125,000 and sold off sharply, breaking mid-range support and retesting the long-term rising trendline and horizontal support around 80,000–82,000 as a key demand area.
The chart highlights a large “critical and key support” zone from around the mid-60,000s to the low-80,000s, where multiple higher-timeframe supports and rounded bases converge, making this a key zone.
After marking support, BTC has begun a relief rally towards the broken trendline and gray resistance band near 100,000–105,000; this area could serve as a decision point where either a downward continuation or a resumption of the trend is likely.
Bull Case: A strong daily close above the gray zone and reclaimed trendline would signal continuation towards 115,000 and potentially a retest of the 123,000–125,000 highs.
Bear Case: A break below 90,000 following rejection from this resistance will likely trigger another leg down towards 80,000–82,000 and, if that fails, another deep sweep into the “Significant and Major Support” region around 60,000 before a larger accumulation base can form.
DYOR | NFA
ETH/USDT 1DAY CHART ANALYSIS !!ETH/USDT on the 1D chart is in a corrective downtrend but currently bouncing toward a major resistance supply zone around 3,500–3,700 USDT.
Price broke below the rising trendline and retested lower, confirming a shift from a strong uptrend to a corrective phase; the main support below is the 2,400–2,550 demand area where the last major rally started.
Above, the grey 3,500–3,700 band is a strong supply/resistance zone formed by prior consolidation and distribution before the last drop, while the top range resistance sits near 4,800.
Bull case: If bulls can push price into the grey zone and break/close decisively above it, structure improves, and ETH can target the upper range toward 4,400–4,800 again.
Bear case: Rejection from the grey zone would likely send ETH back down toward the yellow 2,400–2,550 support, and losing that opens room for a deeper slide toward the 1,400 and 1,000 higher‑timeframe supports marked below.
DYOR | NFA

BTCUSDT WEEKLY CHART UPDATE !!(BTCUSDT) The weekly structure remains bullish overall, but is currently in a corrective leg back into a key higher-timeframe demand zone.
Confluence of the long‑term ascending trendline and horizontal zone around 80,000–82,000, just under the current price; a deeper buffer of 76,000 marks the top of the “significant and major support” area highlighted on your chart.
The previous distribution band at 123,000–125,000 remains the main upside target and weekly resistance; any new impulse leg will likely aim back into this zone first.
The rounded basing structures since 2022, plus the current pullback, suggest a large continuation pattern rather than a full trend reversal, as long as weekly candles keep closing above the 76k support shelf.
80k–76k holds and forms a clear higher low; the weekly chart favors a renewed push toward six-figure territory and a potential retest of the 123k–125k highs. A decisive weekly close below 76k would invalidate this and open risk toward the mid-60k demand block inside the grey zone.
DYOR | NFA

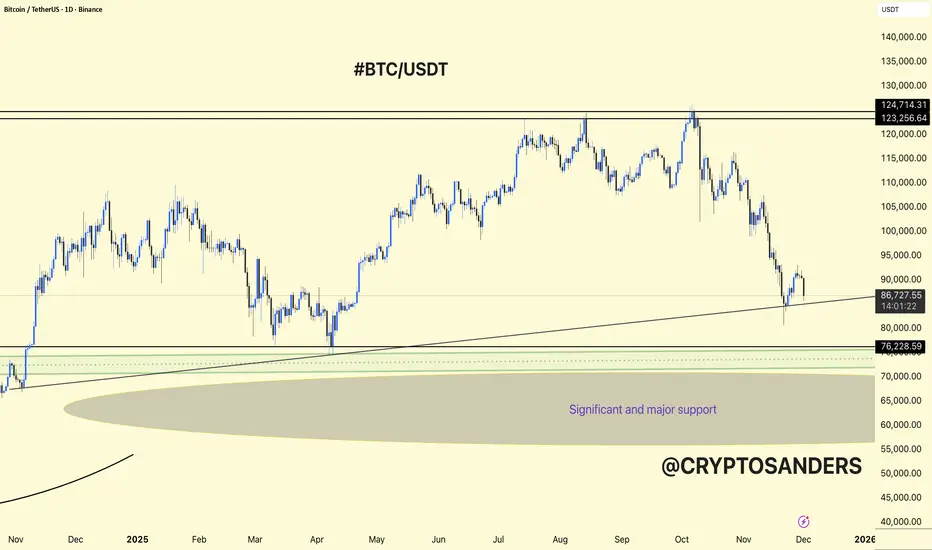
BTC/USDT 1DAY CHART UPDATE. BTCUSDT is in a corrective phase on the 1D chart, but it is still sitting above a major higher-timeframe support zone.
The chart shows a long-term ascending trendline from late 2024 to early 2025 that currently intersects just below the price, acting as dynamic support together with the horizontal 80k–82k area.
Below that, the wider “significant and major support” region lies roughly between 70k and 65k, which is the last strong demand block if 80k breaks.
Bullish case: Holding above the trendline and 80k–82k could form a higher low; from there BTCUSDT can attempt a recovery toward 95k–100k and eventually back to the 120k+ resistance, but it needs clear higher highs and higher lows on the daily to confirm.
Bearish case: A clean daily close below the trendline and 80k support opens room for a deeper flush into the 70k–65k major support zone, where a larger accumulation base may form before any new up‑leg.
DYOR | NFA
BTC/USDT CHART UPDATE !!Bitcoin (BTCUSDT) is currently approaching a major support zone between $76,000 and $80,000. The chart shows two possible scenarios:
If support holds, a rally to $90,000 or above is possible, continuing the overall long-term bullish trend.
If support breaks, a downward move is likely to retest the lower support zone before any major recovery move can begin.
The chart suggests that this area is crucial; the next major action depends on how the price reacts to this support zone.
DYOR | NFA

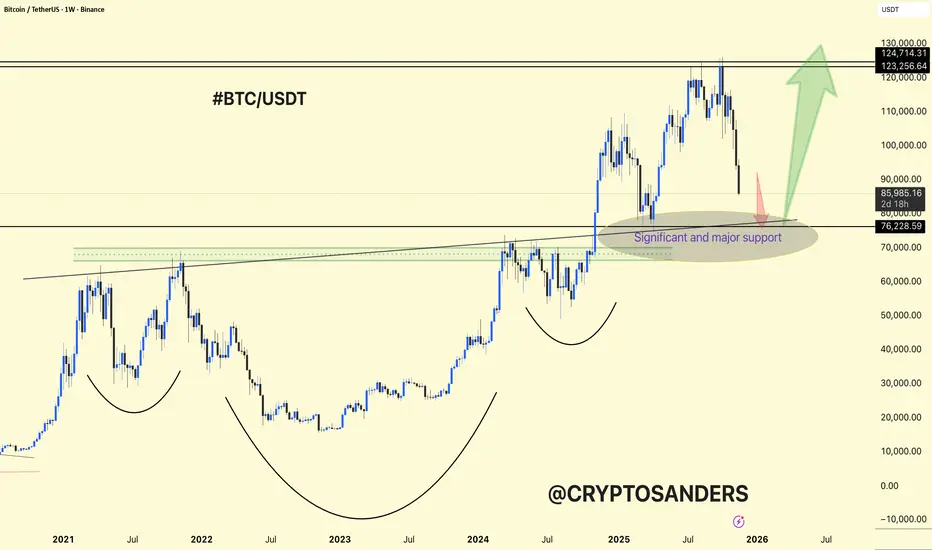
BTCUSDT Weekly Chart Analysis. BTCUSDT Weekly Chart Analysis
Major Structure: Bitcoin is experiencing a significant correction, now testing the most important multi-year support zone around $80,000–$82,000.
Patterns: The chart shows multiple rounded bottoms and a massive base structure, indicating repeated accumulation phases since 2021.
Support Zone: This highlighted area is not only a former breakout region but also converges with major horizontal and trendline support levels, making it highly significant for bulls.
If buyers defend this zone, a swift rebound toward $123,000–$130,000 is likely, maintaining the long-term uptrend.
Failure to hold here increases risk for deeper corrective moves, and the next support would be much lower.
Momentum Shift: The steepness and sharp drop into support reflect panic or forced selling, often associated with extreme sentiment lows.
DYOR | NFA
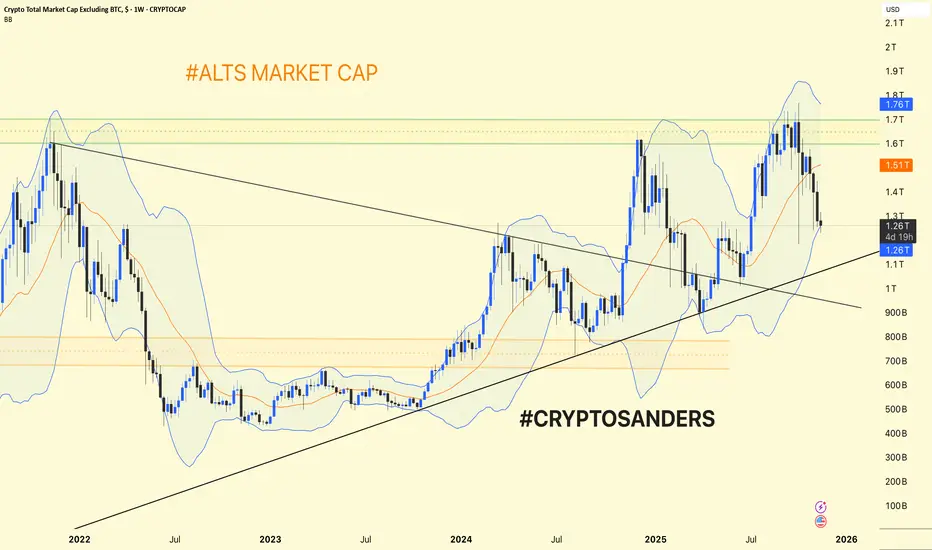
Alts Market Cap (#ALTS) Weekly Chart Update & Analysis. Alts Market Cap (#ALTS) Weekly Chart Update & Analysis
Trend Structure: The altcoin market cap (total crypto market cap excluding BTC) is trading within a broad uptrend channel after a major breakout in early 2024.
Support is currently found near $1.25T (recent swing low and channel support).
Resistance remains around $1.51T (orange line) and $1.76T (major horizontal/upper Bollinger Band zone).
Bollinger Bands: The chart uses weekly Bollinger Bands—price has pulled back from the upper band ($1.76T) and is now holding the midline ($1.26T) as short-term support.
A successful hold above $1.25T keeps the uptrend intact and sets the stage for a move back to $1.51–$1.76T.
A breakdown could lead to a deeper dip toward the long-term rising trendline (currently around $1T).
Alts are consolidating at higher lows inside an uptrend. Holding above the $1.25T area signals strength; a break above $1.51T confirms fresh upside momentum, while losing $1.25T would signal caution for further corrections.
DYOR | NFA
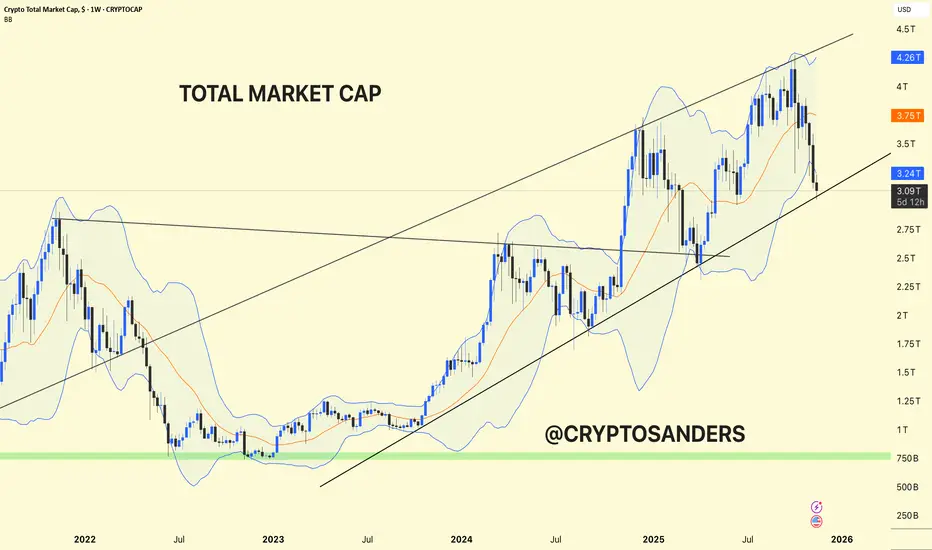
Crypto Total Market Cap. Crypto Total Market Cap – Weekly Chart Analysis & Full Update
The entire crypto market cap is trading within a large ascending channel, keeping the long-term uptrend intact.
Recent Action: After making new highs above $4 trillion, the market has corrected sharply, pulling back to the channel's lower support around $3 trillion USD. This area is a historic pivot and should act as strong support if bulls remain in control.
Upper channel resistance is near $4.4T.
Major horizontal support is well below, near $800B (green zone), but the current structure keeps the market safely above that.
A sustained break below the channel could lead to deeper retracement, while a bullish hold here sets up for another rally.
Holding this channel support can produce a recovery phase, targeting previous highs and new all-time highs.
Losing this support could trigger broader risk-off sentiment and test much lower ranges.
The crypto market is at a critical inflection—channel support is being tested after a steep correction. Staying above $3T maintains the bullish structure. Watch for a decisive bounce or breakdown in the coming weeks.
DYOR | NFA
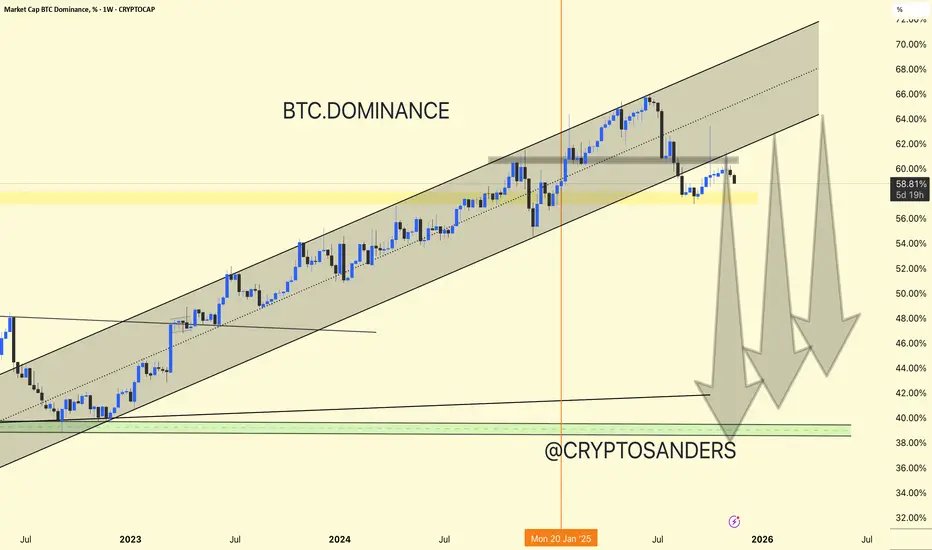
BTC Dominance Weekly Chart Analysis.BTC Dominance Weekly Chart Analysis.
BTC Dominance (% of total crypto market cap) spent most of 2023–2025 in a strong uptrend, forming a rising channel.
Recent Reversal: After peaking above 68%, dominance has broken below the lower channel boundary and is currently retesting previous support-turned-resistance near 60%.
Dominance is hovering above the important yellow horizontal zone (~58%). A sustained move below this could accelerate the downtrend, with further downside targets near the green zone around 40–42%.
Projection: The chart indicates the possibility of a large “altcoin season” ahead (altcoins outperforming BTC) if dominance continues lower. Sharp arrows mark multiple possible legs down, hinting at a prolonged reduction in BTC’s share.
Summary:
BTC.D has broken its major uptrend channel and is now vulnerable. If support at 58% breaks, expect capital rotation into altcoins to intensify, possibly pushing dominance as low as 40% over the coming months
DYOR | NFA
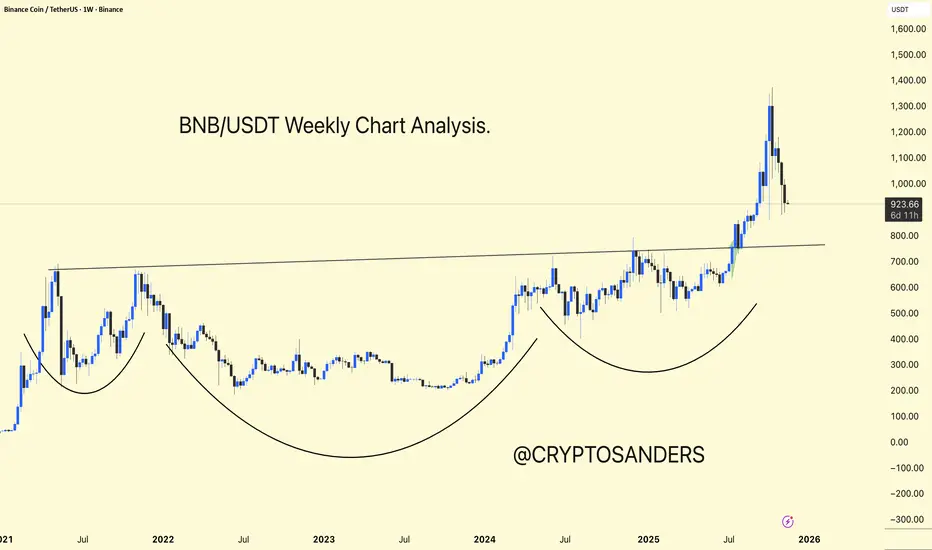
BNBUSDT Weekly Chart – Full AnalysisBNBUSDT Weekly Chart – Full Analysis
BNB is displaying a multi-year Inverse Head and Shoulders structure on the weekly chart, which is a bullish continuation pattern that indicates accumulation followed by a breakout.
Key Breakout: Horizontal resistance near $800 serves as a neckline for the pattern. BNB broke above this level with strong volume, confirming the bullish breakout and initiating a sharp uptrend.
Current Activity: After reaching above $1,300, BNB is currently retracing and testing the breakout area as support ($800–$900). This is a standard retest after a significant uptrend.
Bullish Scenario: If BNB holds $800–$900, a strong upward trend toward new all-time highs is likely, with targets potentially reaching $1,500 and above, measured using cup depth.
Bearish Risk: Losing the $800 neckline would invalidate the current breakout and could lead to a deeper retracement before another upward move.
BNB is in a strong long-term uptrend. After successfully breaking out of a massive cup-and-handle pattern, it is retesting support—a natural and healthy technical move. Holding above $800–$900 keeps BNB in a bullish setup, with further upside potential.
DYOR | NFA
ETHUSDT Weekly Chart – Full AnalysisETH is moving inside a long-term descending wedge/channel pattern, with the upper boundary acting as resistance and the lower as support.
Major Levels: Key horizontal levels include $2,502 (support) and $4,830 (major resistance). The wedge confines most price action since mid-2022.
Recent Action: ETH surged toward the wedge top near $4,830 but faced rejection, leading to the current pullback toward the wedge mid-zone and support. This retracement remains above trendline support and above the last key breakout region.
Bullish Path: If ETH rebounds from the wedge and horizontal support, a breakout above $3,600–$3,800 could re-test $4,830. On a breakout, long-term targets are $6,000+ based on the wedge height and prior cycle moves.
Bearish Risk: If the wedge support fails and ETH loses $2,500, further downside could be seen toward the $1,420–$1,030 area.
Cup & Handle/Accumulation: Multiple rounded bottoms and retests reflect long accumulation phases. A successful move above the wedge would complete this structure and suggest major upside.
ETH is consolidating within a large wedge structure, at support after a strong run and rejection near $4,830. Holding the $2,500–$2,800 zone is key for bullish continuation. A confirmed breakout can trigger a fresh multi-month rally, while a breakdown signals deeper retracement.
DYOR | NFA

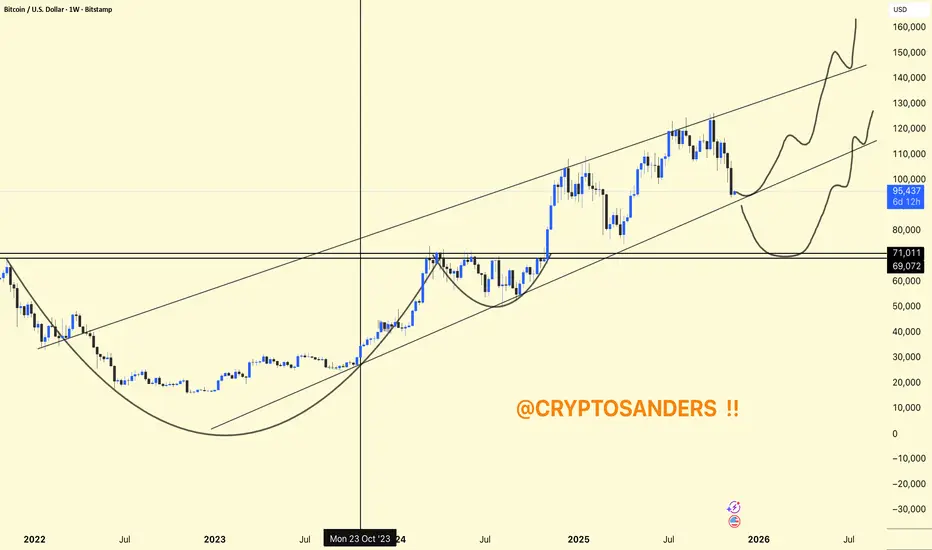
BTCUSDT Weekly Chart Analysis !BTCUSDT Weekly Chart – Full Analysis
Bitcoin is trading within a long-term rising channel, maintaining higher highs and higher lows over multiple years.
Recent Structure: After a powerful uptrend, BTC is currently retesting the midline of the channel as support, which aligns closely with historical breakout levels.
Chart Patterns: Two notable cup-and-handle formations are marked, suggesting strong accumulation phases followed by aggressive rallies. Both patterns played out bullishly with price surges.
Immediate support is in the $90,000–$95,000 region (lower channel line). If lost, deeper support lies around $71,000–$69,000.
BTC holds this channel and midline; the upside path targets $140,000–$160,000 based on the channel ceiling.
A breakdown would likely cause a deeper retrace, with potential demand return at lower horizontal supports.
Short-term volatility is likely, but as long as the major uptrend and channel structure remain intact, BTC is poised for higher targets into 2026.
BTC's weekly chart is still constructive, with a bullish long-term structure, but critical support is being tested. Holding this range could set up for a continuation to new all-time highs, while a breakdown would mean a deeper consolidation first.
DYOR | NFA
BTCUSD (1D) update !!BTCUSD (1D)
Bitcoin is testing the lower boundary of its long-term rising channel, currently near $95,000.
This major support line has held multiple times in the past year; holding here can set up a strong bullish reversal.
The projected path points to possible upside toward $140,000 if buyers defend this support and the uptrend resumes.
DYOR | NFA

BTCUSDT Chart Analysis.
BTC has bounced sharply off the green demand zone near $100,000, a historic level for bullish reversals.
Price action shows consolidation and then recovery, similar to previous cycle bottoms, with a projected move toward resistance at $123,000–$124,700 if momentum continues.
The current structure favors a bullish continuation, but strong confirmation above recent highs is needed for further upside.
DYOR | NFA

BTC/USDT 1DAY CHART ANALIYSIS. BTCUSDT chart analysis and a brief update.
BTC remains above the key daily demand zone (green box) of $100,000–$104,000. Previous visits to this level have generated strong bullish momentum.
Pattern: The chart setup indicates a rounded bottom, and if the support zone holds, BTC is likely to move higher.
Upside Target: If demand returns, a bullish reversal towards $123,000–$124,700 remains anticipated, following the 46% rally seen after a similar pattern previously.
DYOR | NFA

BTCUSDT Daily Chart Analysis. BTCUSDT Daily Chart Analysis.
Support Zone: BTC is testing the major green demand region ($100,000–$104,000), which has triggered strong rallies in previous months.
Pattern & Projection: Price is holding near support with a bullish reversal scenario outlined—if buyers step in here, the chart suggests a possible uptrend toward $123,000–$124,700, and a technical rally of 46% (mirroring past moves).
Caution: If BTC loses this region, downside risk opens up, but as long as the zone holds, upside potential is favorable.
DYOR | NFA

ETHUSDT 4-Hour Chart Analysis. ETHUSDT 4-Hour Chart Analysis.
ETH is forming a falling wedge, a typically bullish reversal pattern, with price just above strong support ($3,389, orange line).
RSI: The indicator is showing bullish divergence—price is making lower lows, but RSI lows are rising, hinting at possible reversal.
Expect further consolidation or small dips toward wedge support, followed by a breakout attempt.
On breakout, resistance is at $3,900–$4,100, then $4,830 as the next major target.
ETH is holding above support and showing bullish RSI divergence. Watch closely for wedge breakout—this could trigger a strong rally if confirmed.
DYOR | NFA

BTCUSDT 4-Hour Chart Analysis. BTCUSDT 4-Hour Chart Analysis.
Current Pattern: BTC is in a falling wedge, with price making lower highs and lower lows, yet approaching the wedge’s support alongside the green demand zone ($102,000–$104,000).
Downside risk remains until the green zone ($104,000 area) is tested; strong support is expected there.
Resistance is at the upper falling trendline; a confirmed breakout above this would be bullish, with an upside target near $114,000–$123,000.
The chart projection suggests some more downside or sideways action, then a strong reversal if the green support holds.
If BTC loses the green zone, expect further weakness, but if price rebounds, a significant rally could follow.
DYOR | NFA

ETHUSDT 4-Hour Chart Analysis !!ETHUSDT 4-Hour Chart Analysis
Trend: ETH has found support at the intersection of a long-term downtrend line and a horizontal demand zone ($3,850–$3,900 area). This area has held steady several times and is acting as a base for the price.
Structure: The price has recently pulled back after rallying to $4,220, but continues to make higher lows on this timeframe, indicating that the bullish structure remains intact as long as $3,900 remains stable.
Key Levels:
Support: $3,850–$3,900 (trend line and horizontal zone)
Resistance: $4,220 (recent swing high), $4,830 (key target—see green arrow projection)
Perspective: If ETH remains stable above $3,900 and bounces back from this support, the next targets will be $4,220 and then $4,830. A breakdown below $3,850 would weaken this bullish outlook.
ETH remains bullish above support, and an upward move towards $3,900 is highly likely. Watch for a break above and sustain above the $4,220 level for further momentum.
DYOR | NFA
