Is #HBAR Finally Ready to See a Massive Rebound or Not? Yello, Paradisers! Is this breakout from the falling wedge the beginning of a real trend reversal on #HBARUSDT, or not? Let’s break down #Hedera setup:
💎#HBAR is currently trading around $0.145, and after weeks of downtrend within a clearly defined falling wedge, we finally saw a breakout above descending resistance. This is the first bullish signal, but it’s not yet confirmed.
💎For real confirmation, we need to see the 50EMA hold as support in the coming candles. If that happens, the probability of a sustained bullish move increases dramatically.
💎On the upside, the immediate target is the Moderate Resistance at $0.177. A break above that zone, ideally on strong volume, would open the path for a larger move toward the Strong Resistance level at $0.209, and that’s where bulls will likely take significant profits.
💎However, if #HBARUSD fails to hold above the support zone near $0.134, and especially if price dips back into the wedge structure, we’ll likely revisit the Strong Demand Zone at $0.110. Below that, the entire bullish setup gets invalidated, and we’ll expect a retest of the recent lows, with increased downside pressure from short setups forming below.
Strive for consistency, wait for clear confirmations, and remember that discipline always beats chasing quick profits.
MyCryptoParadise
iFeel the success🌴
Cryptosignals

ETH/USDT | Ethereum Breaks 3000 and Momentum Still Points HigherCRYPTOCAP:ETH pushed all the way to 3000 and the bullish view is still fully intact. From the 2600 rebound to here the move has delivered more than 17 percent already and the structure still supports continuation. As long as ETH holds above the 2500 to 2700 demand zone the upside targets remain 3200, 3500, and 4000 in the next major leg. On the supply side the important zones sit at 3200 to 3300 and then 3500 to 3600 where price may slow down before the next breakout. For now momentum belongs to buyers.
Please support me with your likes and comments to motivate me to share more analysis with you and share your opinion about the possible trend of this chart with me !
Best Regards , Arman Shaban

Bitcoin is approaching an important support level (1D)Bitcoin has entered a strong bearish structure.
It is currently near an important origin zone that has broken significant highs (BOS). It is expected to make an upward reversal from this area.
It’s natural for this momentum to require some base-building, and since the movement is on the daily timeframe, the upward reversal may take some time.
The target range is 95K to 96K.
A daily candle closing below the invalidation level will invalidate this analysis
Do not enter the position without capital management and stop setting
Comment if you have any questions
thank you

ETHUSD | Short ideaLooking for the next move down on ETHUSD here.
ETHUSD has been trending up for the last few days but I don't think the downtrend is over for now.
Could be right or could be wrong, I would like to hear what you are thinking.
Stay safe out there and do your own due diligence, this is not investment advise!

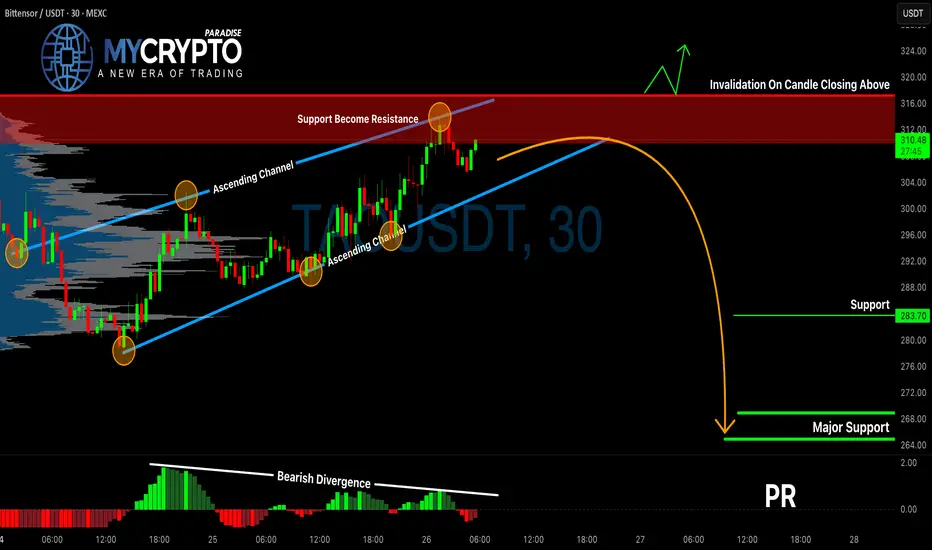
TAOUSDT Is Flashing a Dangerous SignalYello Paradisers, is this the calm before a major move down on TAOUSDT? The current setup is raising multiple red flags, and ignoring them could be a costly mistake.
💎TAOUSDT has formed an ascending channel, but what's critical to note is the bearish divergence on the MACD histogram, aligning perfectly with the previous support-turned-resistance zone. This combination of technical signals often precedes a breakdown, increasing the probability of a bearish move from current levels.
💎If the price pulls back slightly and prints a bearish candlestick pattern near this resistance zone, that would signal a high-probability short opportunity. The confluence of structure and momentum weakness offers a favorable risk-to-reward setup for traders who remain patient and disciplined.
💎However, if TAOUSDT breaks out and closes decisively above the invalidation level, the bearish outlook would no longer be valid. In that case, the best move is to step aside and wait for a stronger, more reliable setup to form before jumping back in.
🎖Strive for consistency, not quick profits. Treat the market as a businessman, not as a gambler. The market rewards patience, discipline, and strategy—never emotion.
MyCryptoParadise
iFeel the success🌴
BITCOIN:LIVE TRADEHello friends
considering the decline we had, the sellers made a bottom and the buyers came in. The sellers again broke the previous bottom with strength and made a bottom, and the buyers came in and raised the price and succeeded in hitting a higher ceiling.
And in the pullback, the open price is supported and here we can enter a buy transaction considering the support of buyers and hitting a higher ceiling, of course with risk and capital management and be careful not to make emotional decisions.
*Trade safely with us*

BITCOIN SIGNAL: BUY NOW!!!!!!!? (trap) Yello Paradisers! Enjoy the video!
And Paradisers! Keep in mind to trade only with a proper professional trading strategy. Wait for confirmations. Play with tactics. This is the only way you can be long-term profitable.
Remember, don’t trade without confirmations. Wait for them before creating a trade. Be disciplined, patient, and emotionally controlled. Only trade the highest probability setups with the greatest risk to reward ratio. This will ensure that you become a long-term profitable professional trader.
Don't be a gambler. Don't try to get rich quick. Make sure that your trading is professionally based on proper strategies and trade tactics.

ADA/USDT | Cardano Slides to 0.38 and Bears Keep Pushing!By analyzing the CRYPTOCAP:ADA chart on the 3 day timeframe, we can see that price finally dropped to 0.38, which confirms the bearish pressure we talked about earlier. ADA is now trading near 0.40 and the chart still looks weak. Buyers are not showing real strength and momentum is clearly on the sellers’ side.
If the drop continues, the next downside target I am watching is 0.36. Make sure you monitor price reaction at this level.
From my perspective, the 0.32 to 0.36 zone is a possible long term accumulation area for investors who use proper risk management and do their own research (DYOR).
For now the bias stays bearish until ADA reclaims strong levels with real demand.
Please support me with your likes and comments to motivate me to share more analysis with you and share your opinion about the possible trend of this chart with me !
Best Regards , Arman Shaban

TAO — Bearish Continuation Setup📉In my view, TAO continues to show signs of wanting to move lower. The market structure still looks bearish, and sellers remain in control.
🎯 Target 1: 274
🎯 Target 2: 268
❌ Idea cancel zone: 285
❓I also think we may see TAO at 260, but this level is still uncertain for me.
🔔So stay tuned — I’ll post an update once TAO gets closer to 268

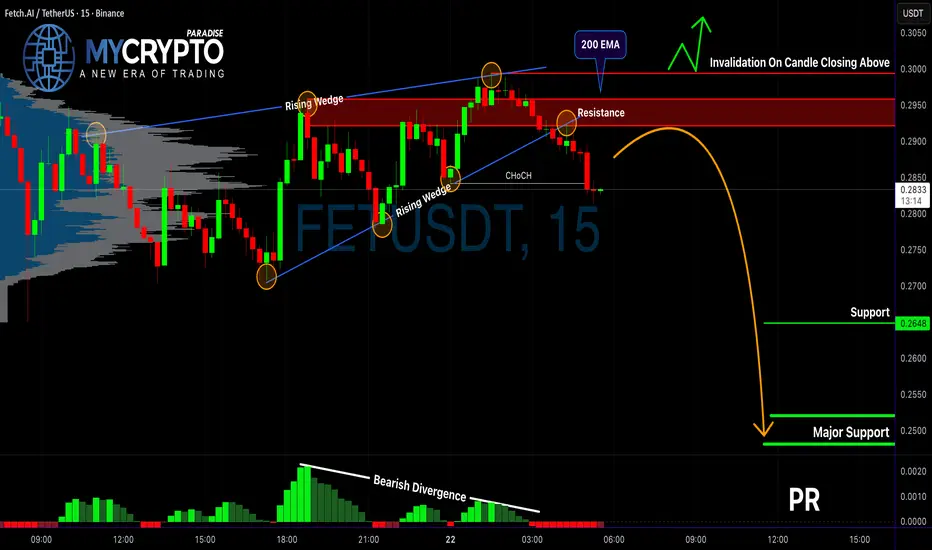
FET Breakdown: Is a Major Dump Just Getting Started?Yello, Paradisers! Have you seen what just happened on FET/USDT? The chart is flashing multiple warning signs, and if you’re not paying close attention, you could get caught on the wrong side of the next big move. Let’s break it down.
💎FETUSDT has officially broken out of a rising wedge pattern—a well-known bearish structure. This breakdown didn’t happen in isolation. It was accompanied by a clear bearish divergence, showing that while the price pushed higher, the underlying momentum was already fading. That’s a red flag for anyone still thinking bullish.
💎More importantly, price action has shown a bearish Change of Character (CHoCH), confirming a potential shift in the trend direction. On top of that, the recent rejection came precisely from the 200 EMA and a known resistance zone, both of which have historically acted as key turning points. When these factors align, they significantly increase the probability of a deeper move to the downside.
💎If the price pulls back from here, the smarter move is to wait for a bearish candlestick pattern to form right at the resistance zone. That would give a cleaner entry with stronger confirmation and a higher reward-to-risk ratio. While aggressive traders may be tempted to enter from current levels—where a 1:1 RR still exists—this is not a sustainable strategy over the long run. Discipline and patience are key if you want to stay consistently profitable.
💎However, if the price breaks out above our invalidation level and closes with conviction, the bearish setup becomes invalid. In that case, it’s best to step aside and wait for more favorable price action to form. There’s no need to rush; missing a trade is always better than forcing one with poor structure.
🎖Strive for consistency, not quick profits. Treat the market as a businessman, not as a gambler.
MyCryptoParadise
iFeel the success🌴
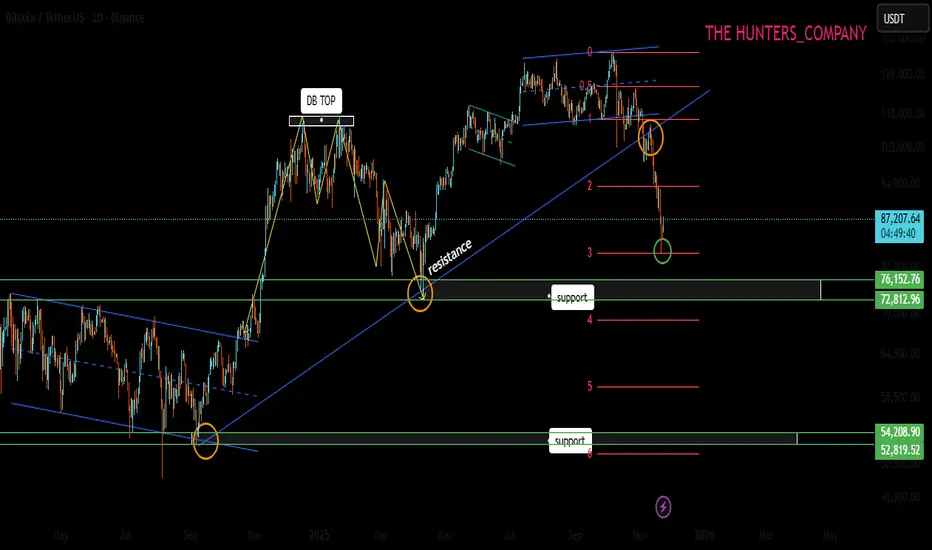
BITCOIN : Where is the price floor (full analysis)Hello friends
Well, the fall in Bitcoin has really scared the market these days, and that's why we had a sharp fall, as it turned out.
Well, if we examine the past price, you will see that there has always been an upward trend and sometimes we have had price corrections, and this is completely normal.
Before this drop, Bitcoin formed a double top pattern and the price corrected, and was again supported by the area indicated by buyers, and the price hit a higher ceiling.
But at the price ceiling, we witnessed weakness in buyers and, more importantly, a rounding of the price, which caused a heavy drop to 80,000. Now, after this sharp drop, the price is unlikely to go straight back up and make a new ceiling.
Now, after this strong spike by sellers, we can expect a descending range or channel.
What do we need to climb to?
Well, obviously the price needs to recover and buyers need to provide good support for the price, and first of all we see a range or channel, and then if they can break the channel or range, buyers can hope for a new ceiling. Otherwise, the price pivots we identified are the most important supports that the price can reach over time.
So, can we say that the rise is over?
No, nothing can be said with certainty. Maybe the price will bottom out at 70,000 to 80,000 and buyers will come in.
But in order to minimize the risk, we must move forward with the market and according to market behavior, not predict...
For this reason, it is not possible to say at this time that the price will go to a new ceiling from here because we do not see any buyers!!!
What is the solution?
Well, let's be logical: when the price goes down and Bitcoin becomes cheaper, better opportunities for buying are available to us, and we should take advantage of this situation and not enter the price ceiling emotionally and suffer losses.
Finally,
We need to see what the buyers' reaction is and if they want to support, then we can enter safely, not now that the Sharp price is falling.\
Be sure to observe risk capital management and do not get excited.
*Trade safely with us*
BITCOIN (BTCUSD): When to Buy?!
Bearish rally continues on Bitcoin.
The market already lost more than 34% from a current ATH.
Analyzing a historic price action, I see an important structure cluster to focus on.
65000 - 76000 is a significant support area.
That will be a good zone for buying Bitcoin, expecting a resumption
of a long-term bullish trend after its test.
❤️Please, support my work with like, thank you!❤️

1INCH Analysis (2H)The internal trendline has been broken and the structure is bearish. Below the current price, there is an important support level that has been tested multiple times, and lower highs have formed, indicating selling pressure.
The targets are marked on the chart.
A daily candle closing above the invalidation level will invalidate this analysis.
Do not enter the position without capital management and stop setting
Comment if you have any questions
thank you

LTCUSDT : Full analysisHello friends
well you see that the power is in the hands of the sellers and we must have sufficient approvals to buy.
So you see, we have two important support areas that we have identified for you with Fibonacci, and they can be good supports. We need to see how buyers react in these areas.
Well, the next point is that despite the sharp drop in Bitcoin, Litecoin did not fall much. It fell by almost half of Bitcoin. Considering the previous times I saw that when Bitcoin fell, other currencies fell several times as much, and this is a good sign (meaning that its holders have a positive view of the currency).
But to buy, we need to know where and when to buy, to find the best point to buy and to take our profits at the best point. For this reason, we expect that Litecoin will most likely bottom out again and buy in support areas with risk and capital management and in steps And to move with the specified goals.
*Trade safely with us*

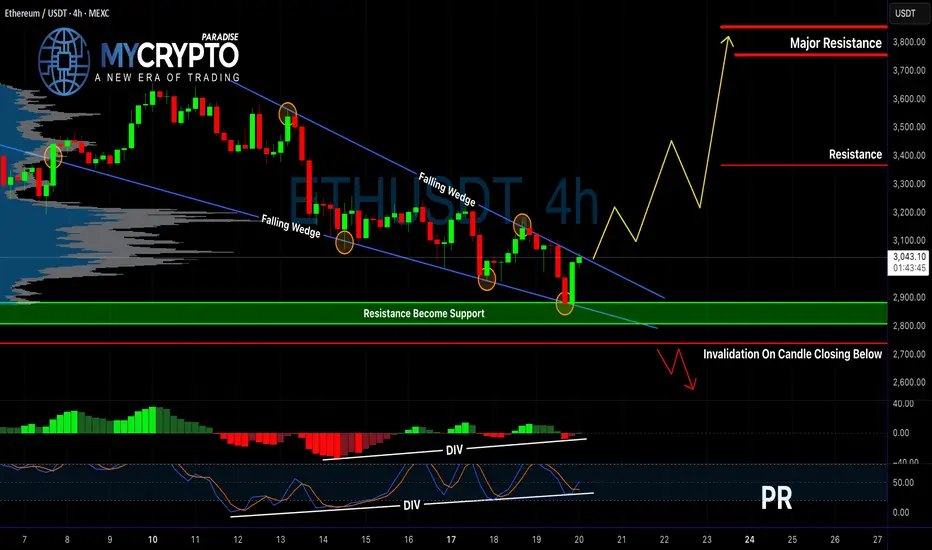
ETH About to Explode or Collapse?Yello Paradisers! Are you prepared for what’s coming next on ETHUSD? Because right now, Ethereum is sitting on the edge of a critical structure that could lead to a major breakout—or trap unsuspecting traders in another fake move. The setup is developing quickly, and what happens next will determine the short-term direction in a big way.
💎ETHUSD is currently forming a textbook falling wedge pattern, a structure often seen at the end of corrective phases and typically followed by strong bullish breakouts. What adds more weight to this scenario is the clear bullish divergence forming on both the MACD histogram and the Stochastic RSI. These indicators suggest that bearish momentum is weakening and bulls may be getting ready to take control.
💎For traders who prefer confirmation, the ideal move is to wait for a decisive breakout above the wedge. That would significantly increase the probability of a sustained bullish move and reduce the risk of being caught in a fakeout. However, for more aggressive traders, there may already be a reason to act. A bullish engulfing candle has formed directly at a key support level—an early signal that buyers are starting to step in with strength.
💎That said, we cannot ignore the invalidation scenario. If the price breaks down and closes candle below the defined invalidation level, the entire bullish outlook will be off the table. In that case, it will be crucial to stay patient and wait for a clearer price action setup to form before considering new positions.
Strive for consistency, not quick profits. Treat the market as a businessman, not as a gambler.
MyCryptoParadise
iFeel the success🌴
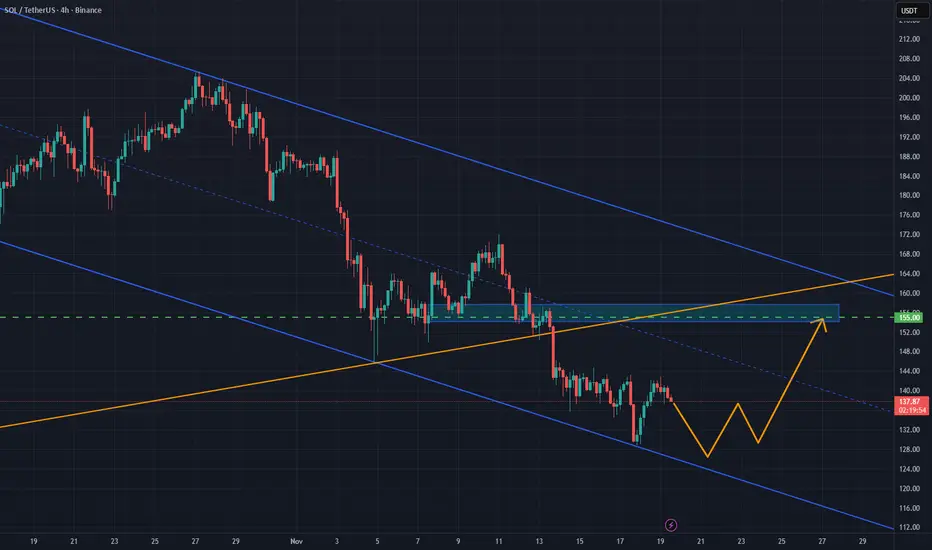
SOL/USDT: Relief Rally Builds After Rebound from Key SupportSOL/USDT bounced strongly from the 128–130 support zone, reacting off the lower boundary of its downward channel. While the broader trend remains bearish, this move signals early signs of accumulation. Holding above 130 could open a corrective rally toward 155, as oversold conditions unwind and short-term momentum favors a relief push.
❗️Risks:
– Losing 128–130 support reopens downside toward 120–115
– Volatility in BTC may cap gains
– Failure to reclaim the channel midpoint may stall the recovery
BITCOIN SIGNAL: NOBODY COUNTS ON THIS!!! (scary)Yello Paradisers! Enjoy the video!
And Paradisers! Keep in mind to trade only with a proper professional trading strategy. Wait for confirmations. Play with tactics. This is the only way you can be long-term profitable.
Remember, don’t trade without confirmations. Wait for them before creating a trade. Be disciplined, patient, and emotionally controlled. Only trade the highest probability setups with the greatest risk to reward ratio. This will ensure that you become a long-term profitable professional trader.
Don't be a gambler. Don't try to get rich quick. Make sure that your trading is professionally based on proper strategies and trade tactics.

FF Looks Bullish (2H)FFUSDT has been ranging within a zone for a while, taking out both buyers’ and sellers’ stop-losses. After creating a large liquidity pool at the bottom and sweeping that lower pool, it now appears ready to move toward the key level.
On this timeframe, we have a bullish outlook on the FFUSDT pair.
Do not enter the position without capital management and stop setting
Comment if you have any questions
thank you

ASTER/USDT | ASTER Smashes All Targets – Over 40% Profit SecuredBy analyzing the #ASTER chart on the 2-hour timeframe, we can see that after our last analysis, price dropped to $0.91, then entered the demand zone and bounced strongly. It successfully hit all three targets — $1.17, $1.21, and $1.24 — even extending up to $1.285, giving over 40% total return. Currently, ASTR is trading around $1.00, and as long as it holds above the $0.90–$0.97 zone, we can expect another bullish move. The next potential targets are $1.09, $1.15, and $1.29.
Please support me with your likes and comments to motivate me to share more analysis with you and share your opinion about the possible trend of this chart with me !
Best Regards , Arman Shaban

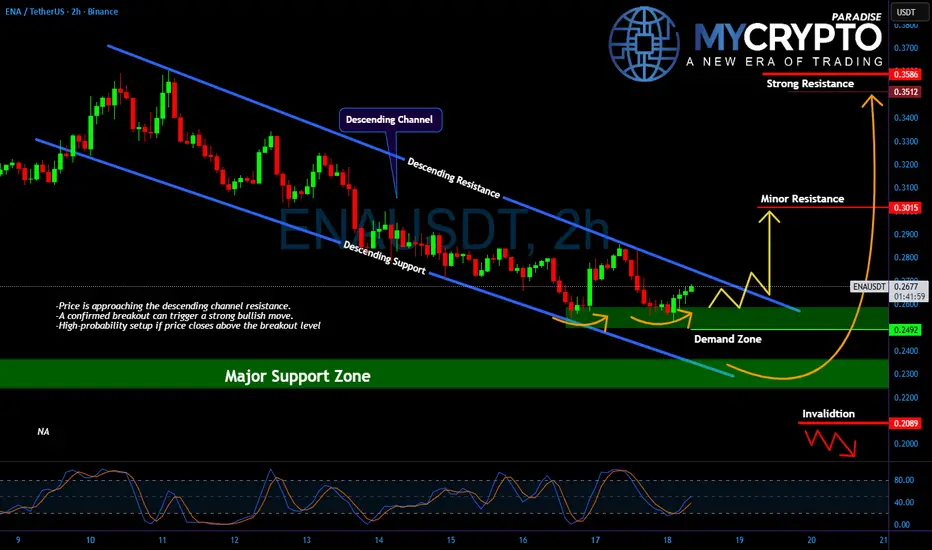
ENA About to Explode? Yello Paradisers, is ENA quietly building up pressure for a major breakout while everyone else is hypnotized by Bitcoin’s sideways snoozefest?
💎While the crypto herd remains laser-focused on BTCUSDT, #ENAUSDT is showing signs of life and potentially setting up a stealth move that could catch most traders completely off guard.
💎Price action has been respecting a clean descending channel, with repeated rejections at the upper resistance and strong bounces off the lower boundary. #ENA has now bounced from a well-defined demand zone between $0.2300 and $0.2492 for the third time. This double bottom structure is a powerful reversal signal, especially if a confirmed breakout follows it.
💎The descending channel resistance is being tested again. If #ENA closes a strong candle above $0.2700–$0.2750, this would confirm the breakout technically. Once that level is broken and successfully retested, a move toward $0.3015 is very likely.
💎The next serious resistance sits between $0.3512 and $0.3586, a target zone where we expect aggressive profit-taking. From current prices, this represents a potential 30%+ move that most traders still focused on #BTCUSDT will completely miss.
That said, if ENA fails to break above the resistance and drops below $0.2089, the bullish setup would be invalidated. Until that happens, the bullish thesis remains fully intact.
MyCryptoParadise
iFeel the success🌴
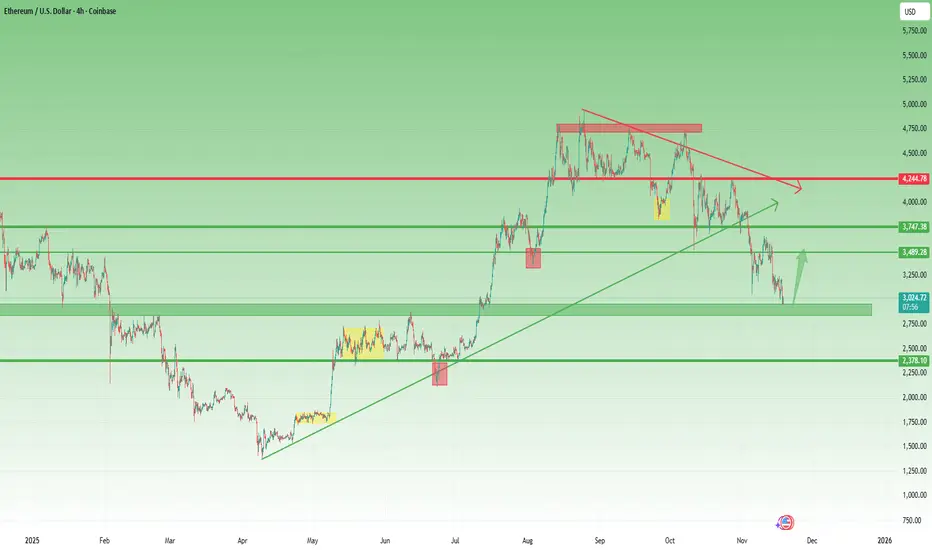
ETH Hits 3K Target – Rebound Likely, Correction Not Over Though1. What Happened Since the Last Update
In my previous ETH analysis, I warned that if Ethereum loses the 3700 support zone, the probability of a drop toward 3000 becomes very high.
That scenario played out perfectly — the 3700 level failed, and price has now reached the 3K zone in recent days.
2. The Key Question Now
Is this the end of the correction, or just the first leg?
From my perspective, the overall correction is probably not finished yet. However, the 3000 area is a major support level, both technically and psychologically, so a bullish rebound from here is very likely.
3. Technical Outlook
Even inside a larger corrective structure, ETH can easily rally $230–$350, or even more, from these levels before deciding the next direction.
Key levels to monitor:
-Support: 3000 → then 2900 (preferred buy zone)
- Upside target: 3300
- Invalidation: A clean daily close below 2800 would weaken the bullish rebound scenario
4. Trading Plan
For the short term, I will look to buy preferably below 2900, targeting 3300 on the bounce.
This is not a long-term trend reversal call — it is a tactical long setup inside a broader correction.
5. Conclusion
ETH has reached the downside target discussed weeks ago. A rebound is likely from here, but the larger correction may not be over yet.
Short-term, buying dips around 2900 makes sense for a bounce toward 3300
BTC/USDT: Bullish Divergence Forms at 92K Support ZoneBTC/USDT is testing the 92,000 key support, a level that previously triggered a major reaction. A bullish divergence is forming as price compresses at the bottom of a downward channel, hinting at a potential corrective rebound.
If buyers defend the zone, a move toward 100,500 resistance is likely. While overall momentum remains bearish, the divergence supports a short-term bullish swing before the broader trend resumes.
❗️ Risks:
– Break below 92,000 opens deeper downside.
– Macro trend continuation may invalidate divergence.
– Failure at mid-range resistance could cap the rally early.

SOL/USDT | Solana Finds Support – Short-Term Bounce Ahead?By analyzing the #Solana chart on the daily timeframe, we can see that after correcting down to $134, the price found demand and bounced to $141.
Since the current area is a key demand zone, if Solana holds above the $126–$137 range, we can expect a short-term bullish wave to follow
