Will #XRP Make a Bullish Move or Is this Another Bull Trap?Yello, Paradisers! Are we about to witness a major #XRPUSDT breakout, or is this just another fakeout? Let’s dive deep into the real setup on the #XRPUSD chart:
💎#XRP is currently trading around $2.65, consolidating right below a critical resistance trendline. What’s building here is a textbook ascending triangle, and the squeeze is tightening fast and moving toward an inevitable breakout.
💎A clean breakout above the resistance trendline, especially if backed by increased volume and 50EMA continuing to act as dynamic support, will significantly raise the odds of a sharp move up. The first bullish target lies at $3.10 (moderate resistance). If bulls dominate, a fast continuation toward the $3.55 strong resistance is very much on the table.
💎However, and this is key, any rejection near the resistance without solid momentum could trap breakout traders. If #Ripple drops below the ascending trendline and loses the Support Zone near $2.37, the move will likely extend into the Key Demand Zone at $2.19.
💎Below $2.19? That’s where the bullish setup gets invalidated. We would then expect a potential full breakdown, creating a cascade of stop-loss triggers and panic selling. That’s not a dip you want to buy blindly. Bulls still hold short-term momentum, but the next few candles will decide everything.
Strive for consistency, wait for clear confirmations, and remember that discipline always beats chasing quick profits.
MyCryptoParadise
iFeel the success🌴
Cryptosignals

HYPE/USDT: Rejection at 50.000 Keeps Sellers in Short-Term ContrHYPE/USDT is facing rejection near the 50.000 resistance zone, showing signs of weakening momentum after a strong rebound. Price remains within a downward structure, and the recent compression pattern points to buyer exhaustion.
If the pair fails to hold above 47.000, a drop toward the 42.000 support zone becomes more likely. Sellers remain in control as long as price stays below the 50.000 resistance level.

Ethereum $ETH still has weekly demand in control. Will it rally?Ethereum CRYPTOCAP:ETH still has weekly demand in control. Will it rally higher? Waiting for some more bullish price action or a pullback to the weekly demand lower at $2,600.

SOLANA (SOLUSD): High Chance for a Rise
There is a high probability that Solana will continue rising
after a confirmed breakout of a key daily resistance.
The next key structure is 208.8 level.
I think it will be reached soon.
❤️Please, support my work with like, thank you!❤️

BTC/USDT: Rebound Builds Momentum Toward Key Resistance ZoneBTC/USDT is staging a sharp rebound from support, lifting above the accumulation zone and signaling renewed bullish momentum. Price action is now forming an upward channel, guided by a dynamic trendline aligned with past impulse legs.
A sustained move above 113,000 would likely confirm a continuation toward the 119,650 resistance area. Broader momentum suggests buyers are regaining control, with Bitcoin strengthening inside consolidation and preparing for a potential breakout.

HBAR Analysis (4H)From the bottom, it seems the price is forming a corrective pattern, and we are now at the end of wave C. The price is expected to soon enter a correction for wave D or a new bearish wave.
The low-risk area for sell/short positions is the red zone.
Targets are marked on the chart.
A daily candle close below the invalidation level will invalidate this analysis.
For risk management, please don't forget stop loss and capital management
When we reach the first target, save some profit and then change the stop to entry
Comment if you have any questions
Thank You

Will #TRXUSDT Slide Down Further or Recover? Must Watch Yello Paradisers! Are you actually watching what’s developing on #TRXUSDT? Because if you’re not, you could be caught completely off guard by this sneaky bearish setup unfolding right now. Let’s break down #TRON Setup:
💎#TRX has been trading inside a textbook Ascending Channel, but that structure is breaking down fast. After losing the ascending support, the price is now retesting it as resistance — and it’s not looking good for the bulls. Adding to the pressure? The 50 EMA, which is now acting as dynamic resistance, reinforces the potential for further downside.
💎Current price of #TRXUSD is $0.30, and this level is absolutely critical. If this rejection holds and we get a clean fail from this zone, the bearish scenario becomes highly probable. Momentum is already leaning bearish, and this breakdown could trigger a deeper flush.
💎If the rejection confirms and sellers take control, we could see price cascade down toward the Support Zone at $0.26, and if that level gives way, a much more aggressive drop into the Strong Demand Zone around $0.18 becomes likely — where bigger buyers might finally show up.
💎However, this bearish structure gets invalidated if #TRX can reclaim and close above the $0.3696 resistance. A breakout above that level would trap late bears and flip the narrative bullish, with room to squeeze higher toward the $0.42 region.
Trade smart, Paradisers. This setup will reward only the disciplined.
MyCryptoParadise
iFeel the success🌴

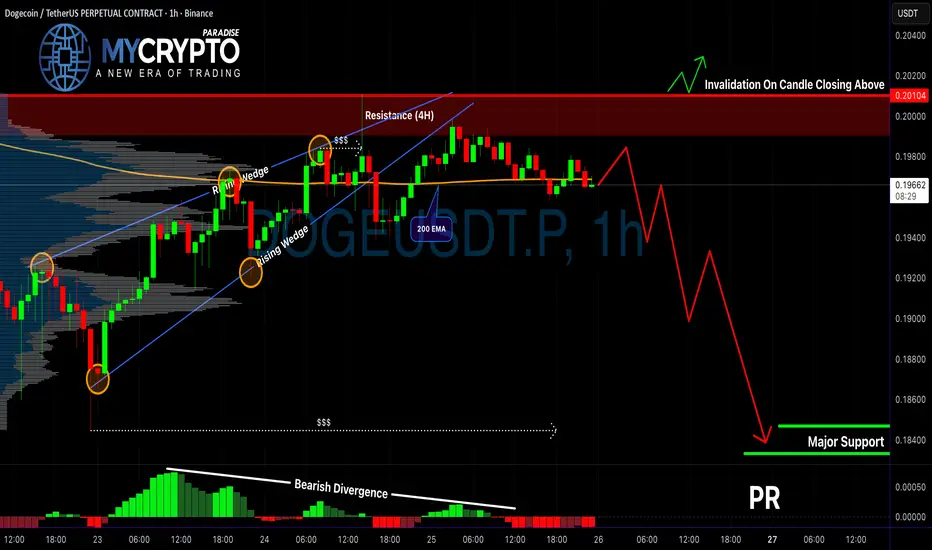
DOGE Is Setting Up for a Trap?Yello Paradisers, are you thinking of shorting DOGE right now? Be careful—this setup might look obvious, but it could also be the start of a classic trap. Let’s dig into what the charts are really telling us.
💎DOGEUSDT is currently reacting from a strong 4H resistance zone, which already gives us an early warning of potential rejection. Zooming into the 1H timeframe, price has broken down Rising wedge with bearish divergence. This isn’t just a random move; it's supported by confluence, especially with the 200 EMA acting as dynamic resistance on the 1H. That kind of layered rejection significantly increases the probability of a further bearish continuation.
💎For aggressive traders, there’s a potential to enter at the current price, but that comes with higher risk. For those who prefer a safer approach, the better play is to wait for a proper pullback and retest of the resistance zone. If the price returns to that level and forms a bearish candlestick pattern, it could provide a much cleaner and higher-probability short setup—along with a bigger reward-to-risk ratio.
💎However, if DOGE breaks out and closes a candle above the resistance zone, this would invalidate the entire bearish scenario. In that case, we’ll need to stay patient and wait for more reliable price action before making any decisions.
🎖Strive for consistency, not quick profits. Treat the market as a businessman, not as a gambler.
MyCryptoParadise
iFeel the success🌴
ZECUSDT Breakdown Incoming? Don’t Get Caught Long!Yello, Paradisers! Have you been paying attention to what’s happening on ZECUSDT lately? If not, now’s the time to look closely—because the signs of an incoming bearish move are stacking up fast, and getting caught on the wrong side could be costly.
💎Right now, ZECUSDT is reacting directly from a key 4H resistance zone, and the price structure is showing some serious warning signals. We’re seeing the formation of a clear Head & Shoulders pattern, which is one of the most reliable bearish reversal setups. On top of that, there’s bearish divergence showing up—indicating that upside momentum is fading, even as price attempts to push higher.
💎This kind of setup is what experienced traders wait for. For aggressive traders, there’s already a potential short opportunity from current levels. However, if you're more conservative (as you should be in this kind of uncertain environment), it's smarter to wait for a pullback and then look for a clear bearish candlestick formation. That confirmation will not only improve the probability of success but also provide a much more favorable risk-to-reward ratio.
💎But caution is key here. If price breaks and closes above the resistance zone, this whole bearish idea becomes invalid. In that case, the best move is to stay patient and wait for clearer price action before making any decisions. Jumping in early without confirmation is what wrecks most traders.
🎖Strive for consistency, not quick profits. Treat the market as a businessman, not as a gambler.
MyCryptoParadise
iFeel the success🌴

MAV/USDT; SAFE BUYHello friends
Given the decline that this currency has had, we have found support areas using Fibonacci and have created a double bottom in the specified area and are expecting it to break its trading range and move to the specified targets.
Observe capital and risk management.
*Trade safely with us*

BITCOIN (BTCUSD): Bullish Move From Support Confirmed?!
There is a high probability, that Bitcoin will bounce from
a key intraday horizontal support.
As a confirmation, I see a valid bullish CHoCH and a breakout
of a resistance line of a falling parallel channel.
I expect growth at least to 110.800 level.
❤️Please, support my work with like, thank you!❤️
I am part of Trade Nation's Influencer program and receive a monthly fee for using their TradingView charts in my analysis.

XLMUSDT - This Classic Bearish Setup Could Trap Late LongsYello, Paradisers! Are you prepared for what could be the next leg down in XLMUSDT? Many are still looking for long setups, but this clean bearish formation could catch them completely off guard.
💎XLMUSDT has officially broken below its key ascending support trendline, and price action has since retested this breakdown level—right where it meets a strong resistance zone. This area is further reinforced by the 200 EMA, which has historically acted as a powerful dynamic resistance in trending markets. What adds even more weight to the bearish case is the textbook Double Top-pattern that has formed right at this confluence.
💎To make matters worse for the bulls, we’re seeing clear bearish divergence across multiple indicators, including the MACD, RSI, and Stochastic RSI. When these divergences align with a structural breakdown and a resistance retest, the probability of a bearish continuation significantly increases. This is not the kind of setup smart traders ignore.
💎For those looking to enter this move, aggressive traders could consider a position from the current price area. However, a more disciplined approach would be to wait for a clean pullback into the resistance zone, followed by a clear bearish candlestick confirmation. This not only offers a better entry, but also significantly improves the risk-to-reward ratio by allowing tighter risk placement above the invalidation level.
💎That said, if the price breaks out and closes a full candle above the resistance zone, the current bearish outlook would be invalidated. In that scenario, it would be best to stand aside and wait for clearer price action to develop before making any further decisions. Chasing moves after invalidation is never worth it.
🎖This is how professional traders separate themselves from the crowd—by waiting for high-probability setups and protecting capital when the market proves them wrong. Discipline and timing will always outperform emotion and FOMO in the long run. Stay sharp, Paradisers, and remember: consistency, strategy, and patience are the only way you’ll make it far in this market.
MyCryptoParadise
iFeel the success🌴

It’s time to stop being a Cardano holder (1W)The large-degree correction of Cardano began from the point where we placed the red arrow on the chart.
For now, this correction appears to be an ABC pattern, where wave B formed an expanding triangle that has already completed.
It is expected that the price will remain bearish for several months until wave C of the larger degree develops.
A weekly candle close above the invalidation level would invalidate this analysis.
For risk management, please don't forget stop loss and capital management
When we reach the first target, save some profit and then change the stop to entry
Comment if you have any questions
Thank You

BNB/USDT | BNB Update – Correction After New ATH!By analyzing the #BNB chart on the weekly timeframe, we can see that after reaching a new all-time high at $1,376, BNB entered a healthy correction phase and is now trading around $1,100. Despite this pullback, the structure remains bullish as long as the price holds above $1,050, which currently acts as the key support zone.
If BNB manages to stay above this level, the uptrend could resume, with potential upside targets at $1,300, $1,400, and $1,550 — consistent with previous projections. However, a confirmed break below $1,050 could open the door for a deeper drop toward the $850 region.
For now, bulls still have control, but the next few days will be crucial to confirm whether this correction is just a pause or the start of a deeper retracement.
Please support me with your likes and comments to motivate me to share more analysis with you and share your opinion about the possible trend of this chart with me !
Best Regards , Arman Shaban

BTC/USDT: Bearish Channel Holds as Price Faces Key ResistanceBTC/USDT remains under bearish pressure, with the recent rebound from 102K facing resistance near the 114K–115K zone. Price action continues to respect the descending channel, reinforcing that sellers remain in control.
A rejection at the trendline could trigger another bearish leg toward 107.5K, with potential to revisit 102K if selling momentum intensifies. As lower highs continue to form below resistance, the broader bias favors further downside.

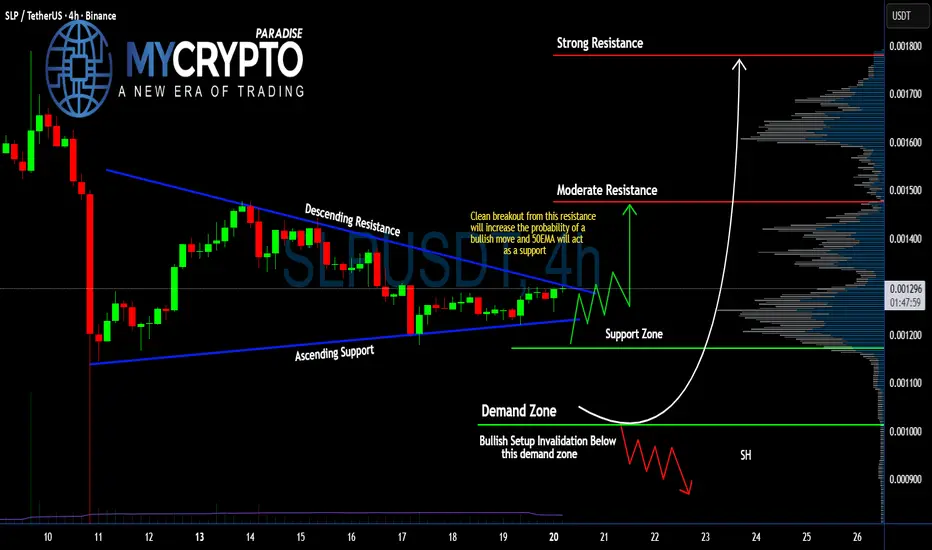
Is #SLP About to Explode Upwards or Another Trap is Set? Yello Paradisers! Are we staring at a breakout just hours away, or is #SLP setting up the perfect trap before the next rug pull? Let's break down what’s really happening with #SLPUSDT:
💎#SLPUSD is currently trading at $0.001296, and it’s stuck inside a narrowing symmetrical triangle with ascending support and descending resistance lines converging quickly. The squeeze is getting tighter, and the price is now right at the edge of a potential breakout.
💎A clean break above the descending resistance, combined with 50EMA acting as support, would significantly increase the chances of a bullish leg up. If that happens, the first target sits at moderate resistance near $0.0014, and we may see an explosive move toward the strong resistance at $0.0017 if volume supports it.
💎On the flip side, if #SmoothLovePotion gets rejected and drops below the ascending support and key demand zone around $0.0010, the bullish scenario will be invalidated. In that case, we expect a steep leg down, especially with low-volume support below. That would trap late buyers and trigger a cascade of liquidations.
💎The support zone between $0.001172–$0.001200 has already shown signs of buyer activity, and as long as we hold above it, bulls still have the upper hand in the short term. Keep an eye on how the price reacts here — it’s the true battleground.
Strive for consistency, wait for clear confirmations, and remember that discipline always beats chasing quick profits.
MyCryptoParadise
iFeel the success🌴
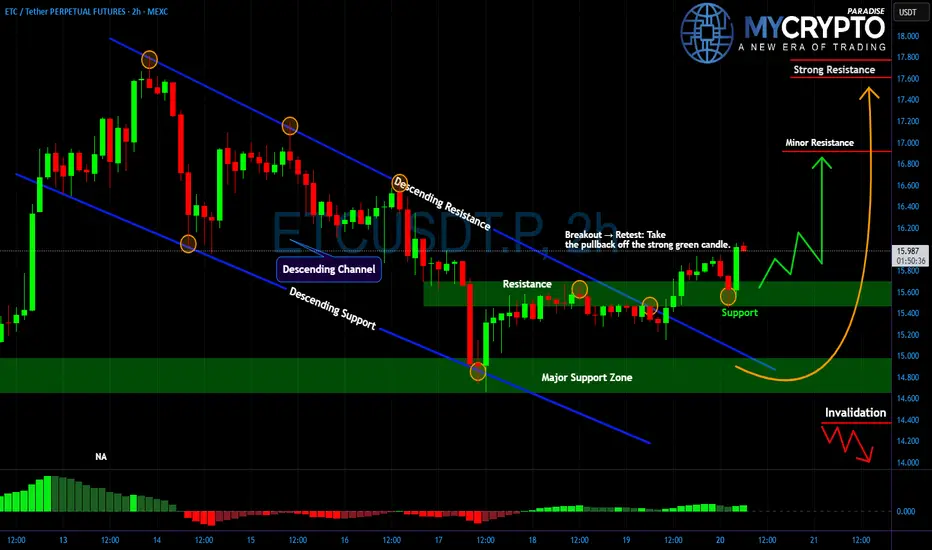
ETC Breakout Confirmed… But Will It Hold or Fake Out?Yello Paradisers, did you catch this clean breakout from the descending channel on ETCUSD just as we expected? If not, you might already be late to the first leg but the real move might still be ahead.
💎#ETCUSDT was trading inside a well-defined descending channel for days, respecting both trendline resistance and support beautifully. The market structure shifted when price broke above the upper boundary of this trend, followed by a textbook retest right at the $15.60 level turning former resistance into support.
💎This move was confirmed by a strong green bullish candle and an uptick in volume, hinting at momentum building up behind the bulls.
💎Currently, #ETC is holding above the key support zone $15.40–$15.80. If this zone holds firm, we expect the price to continue pushing toward the next resistance levels at $16.60 and $17.40. The $17.40 zone is especially important it marks a strong resistance that could either trigger a reversal or lead to an explosive breakout if flipped.
💎On the other hand, any clean breakdown below $15.40 followed by weakness would invalidate this bullish setup and likely drive price back to the $14.00 zone, so risk management is key.
Discipline, patience, robust strategies, and trading tactics are the only ways you can make it long-term in this market.
MyCryptoParadise
iFeel the success🌴
Your Token, My Analysis — Let’s Do This!Hey Traders!
Hope you're all enjoying an amazing weekend !
Want me to analyze your favorite token next?
Just drop your request below using this format
Request Format:
Project Name: Bitcoin
Token Symbol: BTC ( BINANCE:BTCUSDT )
Important Rules:
I’ll analyze only the first 10 requests.
One request per person — so choose wisely!
I’ll reply directly under your comment .
If this sounds good, smash that Like button , Share with your friends , and let’s find the next big move together !
Here’s to your success — health, wealth, and great trades!

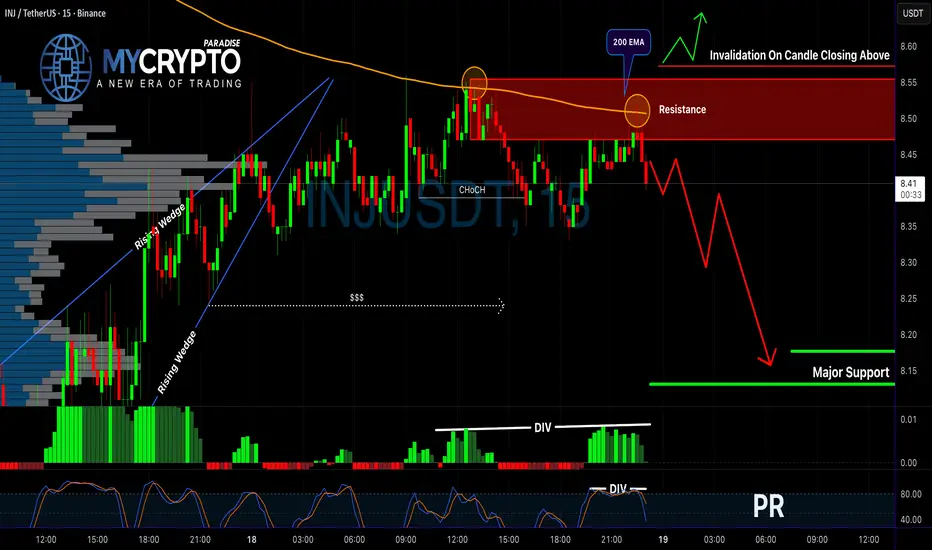
INJUSDT Just Flashed a Bearish Reversal SignalYello, Paradisers! Did you catch how INJUSDT reacted at the resistance zone? If not, you might be looking at the early signs of a deeper drop. Here's what you need to know before it's too late.
💎INJUSDT is currently flashing a clear bearish outlook as price reacts strongly from a major resistance zone. This area is further reinforced by the 200 EMA, adding technical confluence to the rejection. Most importantly, we've now seen a bearish CHoCH (Change of Character), which often marks a momentum shift from bullish to bearish. On top of that, both MACD and Stochastic RSI are showing bearish divergence—this alignment of multiple indicators significantly increases the probability of downside continuation.
💎Aggressive traders may look to enter short positions directly from current levels, aiming to capitalize on early momentum. However, for more conservative and risk-aware traders, a safer approach would be to wait for a minor pullback into the resistance area, followed by confirmation from bearish candlestick formations. This method not only improves the risk-to-reward ratio but also increases the overall probability of success by waiting for clearer market signals.
💎That said, we always account for invalidation. If the price manages to break and close decisively above the resistance zone, it would invalidate the current bearish structure. In such a scenario, standing aside and waiting for a new price structure to form would be the smarter move, rather than trying to force a trade against the new trend.
💎This is where patience and discipline truly set you apart from the herd. If you want to be consistently profitable, you must learn to wait for the highest probability opportunities—just like we do. Avoid rushing, and don’t let emotions lead your decisions.
🎖Strive for consistency, not quick profits. Treat the market as a professional business—not a gamble. That’s the only way to build long-term success in crypto. Be a PRO.
MyCryptoParadise
iFeel the success🌴
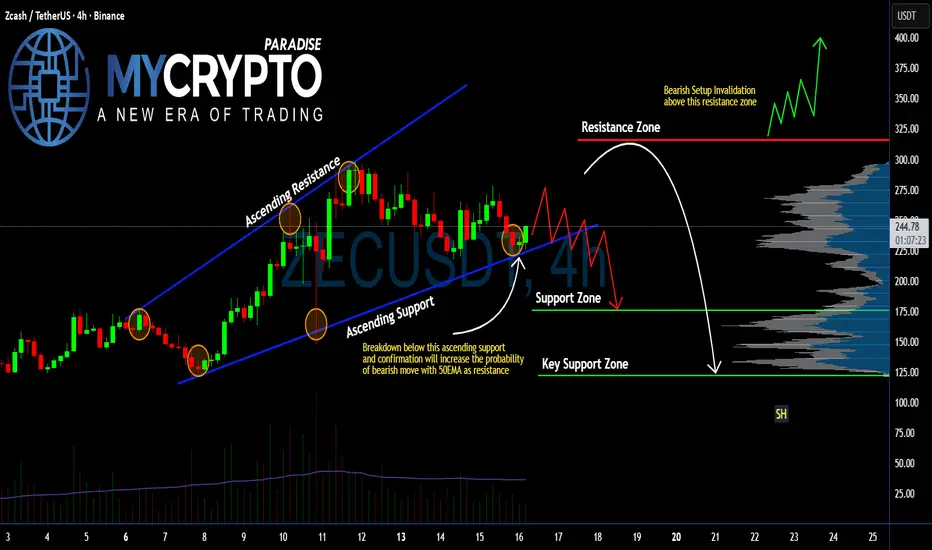
#ZEC Ready to Collapse? Breakdown Here Could Trigger Panic Sell Yello Paradisers! Are you really paying attention to what’s brewing on #ZECUSDT? Because if not, you might be blindsided by what could be a brutal move down. Let's get into the #ZEC setup:
💎#Zcash has been trading inside an Ascending channel, but the momentum is clearly fading. The last bounce off the ascending support was weak, and now we are testing that same ascending support again, but this time, with growing selling pressure.
💎Current price of #ZEC is around $242, and the situation is getting critical. A confirmed breakdown below this ascending support will flip the structure bearish and open up a clean setup toward significantly lower levels. The 50 EMA, which is now acting as dynamic support, will act as resistance. It will only accelerate the downside if this breaks.
💎If this breakdown plays out and is followed by a failed retest of the broken trendline, we could easily see price dump into the Support Zone around $175, and possibly even fall into the Key Support Zone near $121, where stronger buyers may finally step in.
💎On the flip side, the bearish setup is invalidated only if #ZECUSD breaks back above the Resistance Zone at $316. That would shift momentum in favor of the bulls and could spark a sharp rally.
Trade smart, Paradisers. This setup will reward only the disciplined.
MyCryptoParadise
iFeel the success🌴
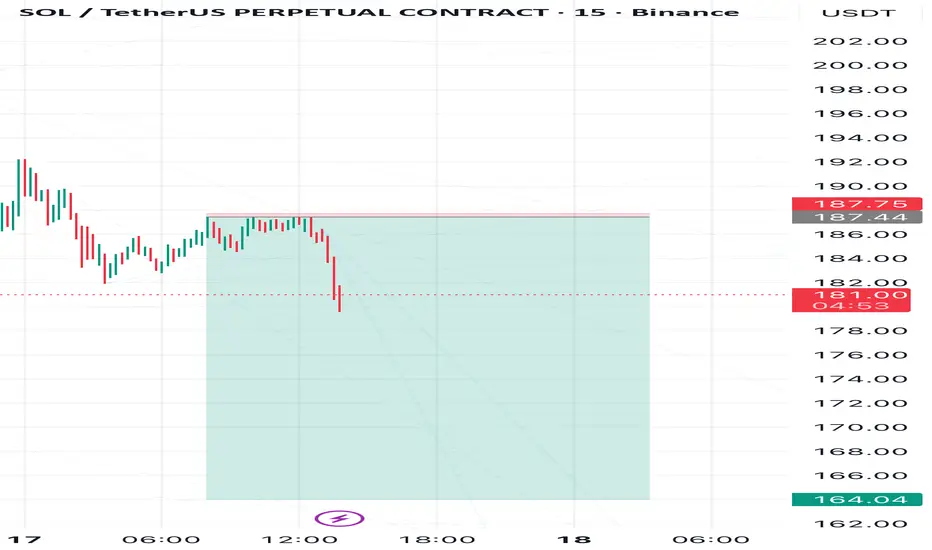
SOL Bears Still in Control — Eyes on 164Solana has repeatedly confirmed its plans to move lower toward the 164 level.
The 187.4 level is a particularly strong support, so a breakout above it would mean the plan is invalidated.
Follow me for consistent technical analysis on Solana
Doge- Support turned resistance. What's next?Friday’s crash took DOGE below two key support zones —
first, the ascending trendline around 0.23,
and then the horizontal support near 0.21.
After the drop, DOGE attempted a recovery that only brought it back to retest the broken 0.21 level, which has now turned into resistance. The price has since started to roll back down.
At this stage, if the negative sentiment across the crypto market continues, the probability of a deeper correction remains high — with the next significant target around 0.15.
Only a sustained move above 0.21 would neutralize this bearish scenario and open the path for a potential rebound.

KGEN Analysis (1H)It is currently fluctuating within a range, and the range node has not yet been engulfed | it has rejected the price.
We labeled the range node as Supply, marked in red.
A liquidity pool is also shown on the chart, and unless the price stabilizes above this liquidity pool level, we expect a drop toward the TP line
Use low volume and leverage, as this is a new coin with high volatility
For risk management, please don't forget stop loss and capital management
When we reach the first target, save some profit and then change the stop to entry
Comment if you have any questions
Thank You
