SOL to $4500?Internet Capital Markets
I believe Solana is going to take over the entire financial system.
Cupandhandlepattern

Silver forming a long-term “Cup and Handle” - as Gold didSilver seems to be repeating the same institutional “Cup and Handle” structure that we recently saw play out perfectly on Gold.
On Gold, the price completed the entire measured move — equal to the depth of the cup — before entering consolidation.
Now, Silver is building a very similar long-term formation, and this setup could define the market direction for the next several years.
🧠 Technical Context
On the higher timeframes (1W and 1M), Silver has formed a clear rounded base — the cup.
The current consolidation area represents the handle, and price is now approaching the upper boundary of that handle.
Once we see a decisive breakout above the handle resistance, institutions will likely defend that zone on the first retest.
This pattern is one of the most reliable continuation formations in long-term trends, especially when accompanied by rising volume near the breakout area.
There’s a very important condition: this pattern becomes active only after the handle breakout.
Before the breakout, it’s just an unconfirmed structure — the pattern is validated only once the handle level is broken.
🎯 Trade Plan
Breakout Level (Handle Resistance): around $50.0 – $51
Usually, the breakout happens on high volume, accompanied by several strong bullish candles
Retest Zone: $30 – $35.0
Target (long-term extension): $600.0+
Stop-Loss: according to your risk management strategy
📊 Summary
If Silver repeats the Gold scenario, we might see a clean breakout–retest–continuation structure with very limited pullbacks once the move begins.
This could mark the start of a multi-year bullish phase in silver.
I’ll be monitoring the breakout confirmation and volume profile closely before entering.
Once confirmed, the upside potential looks substantial compared to the risk.
This is not financial advice. For educational purposes only

Cup and Handle Breakout On Natural GasNatural Gas price formed a smooth rounded base, a classic cup pattern.
Then, the breakout came with a strong bullish candle, confirming momentum has shifted fully in favor of the bulls.
After this breakout, we can expect a brief pullback.
As long as price holds above the breakout zone, the structure remains bullish.
The next leg higher is anticipated to target the 4.100 area, completing the measured move of the pattern.
In short, buyers are in charge, and this breakout looks ready to extend further.

Bitcoin Update – November 1, 2025 - Revised 2026 target $46KBitcoin and Crypto Market Update – November 1, 2025
Bitcoin has completed its cup-and-handle pattern , hitting the technical target near $118,000 before rolling over into a fresh rising-wedge formation . The new structure is supported by declining volume , hinting at fading momentum and a potential pullback toward $46,000 .
Today’s move mirrors broader macro caution—the Fed’s pause on rate cuts and Trump–Xi trade tensions have triggered a wave of risk-off sentiment. Bitcoin is down 3.8% to $110,063 , Ethereum −3.6% ($3,853), and XRP −4.1% ($2.51).
Despite the dip, ETF inflows remain strong (BTC +$202 M, ETH +$246 M), showing institutions still buying the weakness. November historically delivers +42.5% average gains, but traders should stay alert as the rising wedge matures.
Technical summary:
* ✅ Cup & Handle target ≈ $118 K (completed)
* ⚠️ Rising Wedge forming → Target ≈ $46 K
* 📉 Volume decline = weakening trend strength
* 🟢 Institutional inflows = long-term support, volume declining over 5-10 year cycle
📊 Posted by Market Monkey — decoding the market’s next move.

FLNC 1D – The power comeback!On the daily chart, Fluence Energy (FLNC) shows a clean cup and handle formation followed by a golden cross (MA50 crossing above MA200) - a textbook bullish reversal setup.
Price broke out of the structure and is now pulling back into the buy zone ($14.57–$16.80) - a confluence of Fibonacci support and previous resistance.
✅ Golden cross confirms trend reversal
✅ Rising volume supports the move
✅ MAs below price - bulls are in control
The first target sits near $27.43, while the second projection extends to $40.28 if momentum continues.
Fundamentally, Fluence remains a leader in energy storage and grid technology - a hot spot for global investment as the renewable sector accelerates.
Let’s just say - this chart looks fully charged ⚡️

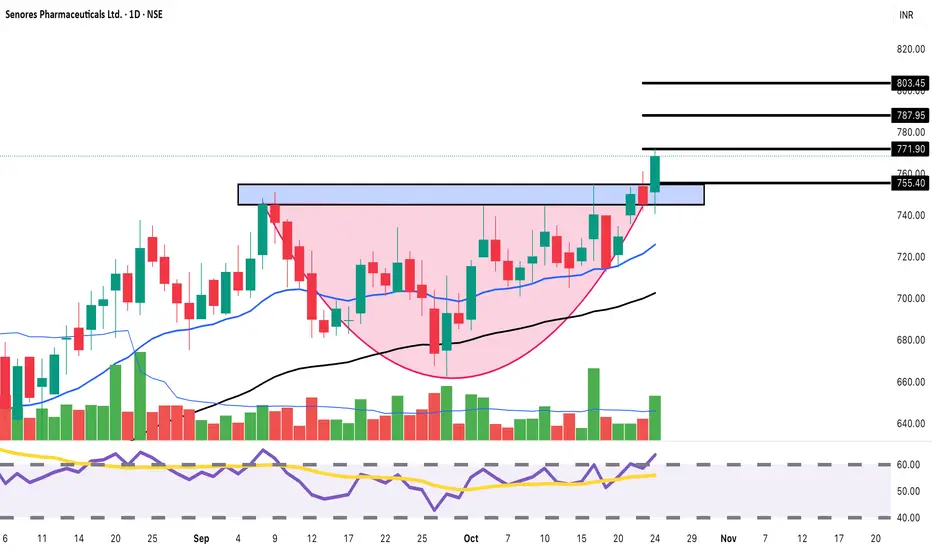
Senores Pharma: Cup & Handle Breakout! Target 803+BUY Setup 💊
Entry: ₹768-775 (Current Level)
Target 1: ₹787-795
Target 2: ₹803-810
Target 3: ₹830+ (Extended)
Stop Loss: ₹752
Technical Rationale:
Powerful breakout from rectangular consolidation (740-770)
Strong bullish momentum with +3.10% surge today
Breaking above resistance zone with conviction
Cup and Handle pattern visible - classic bullish continuation
Price breaking above descending trendline (pink shaded area)
Rising above both EMAs indicating trend reversal
High volume (378.97K) confirming breakout strength
RSI spiking above 60, showing momentum building
Clear support established at 755-760 level
Multiple resistance levels marked: 771, 787, 803
Ascending triangle formation breakout
Risk-Reward: Excellent 1:3+ ratio
Pattern: Cup & Handle + Ascending Triangle breakout - highly reliable bullish signals combined
Strategy: Short to medium-term swing - Book 30% at T1 (790), 35% at T2 (805), trail remaining with SL at 770 after T1
Key Levels:
Breakout Zone: 771 (now support)
Strong Resistance: 787, 803
Support: 755, 752, 740
Sector: Pharma sector showing strength amid market volatility
For educational purposes only. Not SEBI registered. Multiple bullish patterns converging - strong setup but manage risk. Conduct your own research before investing.Retry
Cup & Handle Heading into EarningsNASDAQ:MSFT is forming quite a large cup and handle within a larger symmetrical triangle after closing the week, bouncing off the 20-day EMA. NASDAQ:MSFT 's bollinger bands are squeezing as well as it heads into earnings this week, along with the rest of the Mag 7- Just some support levels and some RSI-based supply and demand zones to keep an eye on - Bullish Long

Can WTI’s 8% Rally Hold After Trump-Putin Summit Collapse?WTI just staged its biggest two-day rally since June, as hopes for a Trump-Putin summit were dashed, leading to new US sanctions on Russian oil exports.
Here’s what’s fuelling the move and what traders should watch next:
- US sanctions on Russia’s top oil producers after failed Budapest summit trigger supply fears and spike prices
- Trump escalates rhetoric to maintain leverage as Zelensky signs military deals with Sweden, raising geopolitical stakes
- WTI reclaims key $61 resistance, with daily RSI momentum signalling room to run and a possible cup & handle breakout toward $68
- Supply glitch fears (India, OPEC’s slow reaction) and technicals all support continued upside if the current environment holds
Watch for buy the dip signals, respect $61 support, and target the $65–68 channel top if current drivers persist.
Stay tuned!
This content is not directed to residents of the EU or UK. Any opinions, news, research, analyses, prices or other information contained on this website is provided as general market commentary and does not constitute investment advice. ThinkMarkets will not accept liability for any loss or damage including, without limitation, to any loss of profit which may arise directly or indirectly from use of or reliance on such information.

CHFJPY - Potential LONGCHFJPY is pressing up against its old ceiling around 191.0–191.2 and just made a small pause/flag before pushing higher. I’m interested in buys only if it can stay above that ceiling—ideally a clear close or a quick dip-and-bounce that shows the level turning into support. If I’m in, I’ll hide my stop near 190.60 and aim for 191.90 → 192.60, with a stretch goal near 193.20 if momentum kicks in. If price pops above 191 and immediately falls back under 190.9, I’ll skip the long—that would smell like a fake breakout and could pull back toward 190.20 or 189.50. Keep position size modest up here; let confirmation do the work.

Gold Setup You Can’t IgnoreHey everyone, Erik here !
Gold is quietly preparing for its next move. After a strong rally, price didn’t collapse as many expected. Instead, it’s been building a smooth accumulation structure — the classic Cup and Handle that often signals continuation in a healthy uptrend.
This setup tells a deeper story about market psychology. Sellers are running out of strength, while buyers keep absorbing every pullback with patience and confidence. Momentum is quietly shifting, and pressure beneath the surface is growing.
If a clean breakout confirms this formation, gold could enter its next bullish leg. A move toward 4500 looks not just possible, but reasonable based on the current market structure.
Until that confirmation comes, patience remains the key. Waiting for a clear breakout with strong volume helps filter out false signals and keeps you aligned with the dominant trend.

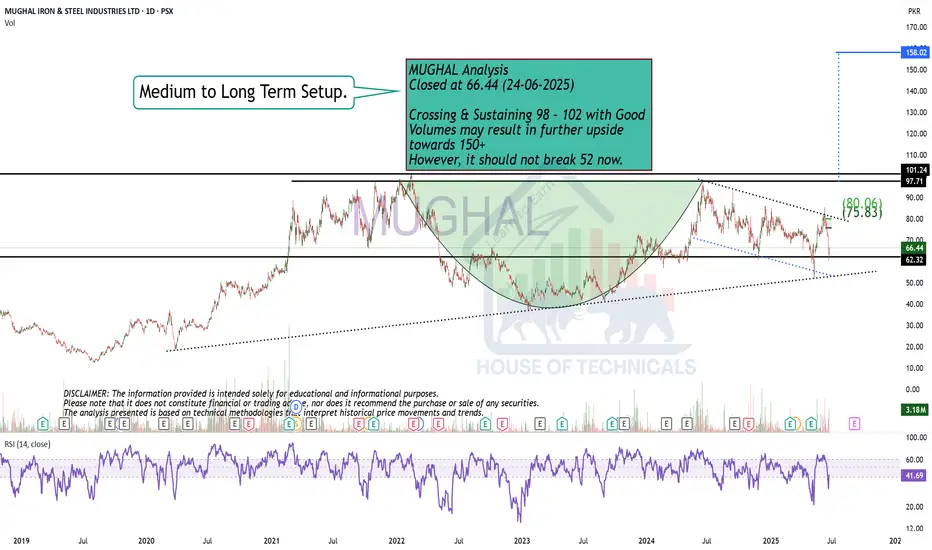
Cup & Handle FormationMUGHAL Analysis
Closed at 66.44 (24-06-2025)
Crossing & Sustaining 98 - 102 with Good
Volumes may result in further upside
towards 150+
However, it should not break 52 now.
Teacup Chart Pattern — Brewing Bullish MomentumSup, legends! Shall we tea it up? ☕
Today, we’re not just talking about your morning cuppa. We’re diving into something traders get excited about — the Teacup Chart Pattern. Just like a perfect brew, this pattern takes time to form, and knowing how to spot it can make your trading experience much smoother.
What Is the Teacup Chart Pattern?
The teacup chart pattern is a bullish continuation setup that resembles the shape of a tea cup when plotted on a price chart. It typically forms after an extended uptrend, signaling a consolidation phase before the asset resumes its upward trajectory.
Key characteristics of the tea cup pattern include:
A rounded bottom that reflects a gradual shift from selling pressure to buying support.
A slight pullback, known as the "handle," which represents a brief pause or shakeout before the next move.
A breakout above the resistance line at the cup’s rim, often accompanied by strong trading volume.
Anatomy of the Teacup and Handle Pattern
To apply teacup pattern trading effectively, traders must understand the structure:
The Cup – This is the rounded consolidation. It can take several weeks or months to form, depending on the timeframe. A smoother curve is generally considered stronger than a sharp V-shaped recovery.
The Handle – Following the cup’s formation, price action typically retraces slightly, creating a downward or sideways movement. This handle reflects short-term profit-taking and helps “reset” market sentiment.
The Breakout – Once the handle is complete, a breakout above the cup’s rim confirms the tea cup trading pattern and signals renewed bullish momentum.
Trading the Teacup Pattern
When approaching tea cup pattern trading, consider the following strategies:
Entry Point : A common entry is at the breakout above the rim of the cup, once volume confirms the move.
Stop Loss Placement : Traders usually place stops slightly below the handle’s low to minimize downside risk.
Target Projection : The potential price target can be estimated by measuring the depth of the cup and projecting it upward from the breakout point.
Why the Teacup Trading Pattern Works?
The teacup trading pattern embodies market psychology. The rounded cup reflects gradual accumulation, while the handle signals a controlled pullback that shakes out weak hands. When the breakout occurs, it often triggers a surge of buying pressure from both breakout traders and those re-entering the market.
For crypto traders, the tea cup chart pattern is particularly valuable because digital assets are prone to sharp moves. Recognizing this structure early can provide an edge in catching strong upside momentum.
Common Mistakes in Teacup Pattern Trading
Even experienced traders can misinterpret the teacup chart pattern. Some common pitfalls include:
Mistaking a sharp V-shaped rebound for a valid cup formation.
Entering too early, before the handle completes.
Ignoring volume confirmation, which often validates the breakout’s strength.
Patience and discipline are critical in successfully applying the tea cup pattern trading strategy.
Final Thoughts
The teacup and handle pattern is one of those OG bullish setups in crypto that just works when you read it right. Think of it as the market taking a chill before the next leg up. You spot the rounded cup, wait out that handle fake-out, and when volume kicks in — that’s your green light.
With crypto’s crazy volatility, the teacup trading pattern can be a solid way to catch continuation moves and ride some serious momentum. Just don’t ape in blind — always stack confirmations. Watch the volume, line it up with MAs or momentum tools, and filter out the noise. The pattern’s strong, but context is king if you don’t wanna get trapped in a fake breakout.

Bearish Divergence on Bigger tf
CMP 105228.47 (02-06-2025)
Bearish Divergence on Bigger tf (Cautious
approach should be taken).
However, if 109350 is Crossed, we may
witness 115000 & then 120000 - 121000.
and if 112000 is crossed & sustained, be ready
to get New Highs :-)
Lets be more cautious & dig out 3 Important
Support Levels.
S1 around 103000 - 102500
S2 around 97800
S3 around 93400 - 93500.

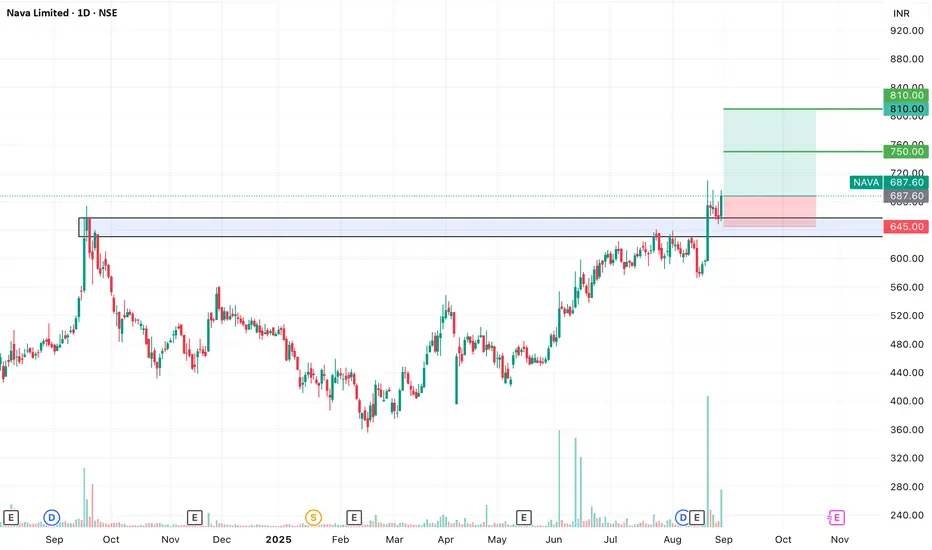
SWING IDEA - NAVA Nava Ltd , a diversified natural resources and energy company, is showing a promising swing opportunity with a breakout backed by strong technical signals.
Reasons are listed below :
Cup and Handle breakout, a strong bullish continuation pattern
Confirmed bullish price action post breakout
Bullish engulfing candle on the daily timeframe
Volume spike, confirming breakout strength
Trading near its 52-week high, showing momentum
Sustaining above 50 & 200 EMA on the daily chart
Target - 750 // 810
Stop loss - daily close below 645
DISCLAIMER -
Decisions to buy, sell, hold or trade in securities, commodities and other investments involve risk and are best made based on the advice of qualified financial professionals. Any trading in securities or other investments involves a risk of substantial losses. The practice of "Day Trading" involves particularly high risks and can cause you to lose substantial sums of money. Before undertaking any trading program, you should consult a qualified financial professional. Please consider carefully whether such trading is suitable for you in light of your financial condition and ability to bear financial risks. Under no circumstances shall we be liable for any loss or damage you or anyone else incurs as a result of any trading or investment activity that you or anyone else engages in based on any information or material you receive through TradingView or our services.
@visionary.growth.insights
Beautiful Cup & Handle on Bigger tf.BWHL Analysis
Closed at 192.54 (25-09-2025)
Beautiful Cup & Handle on Bigger tf.
Crossing & Sustaining 196 may lead
it towards 300 - 350.
97 should be last hope that should not break in any case.

$AMZN massive cup and handle formingIf we look at the chart of AMZN, we can see that $236 has become an important resistance level.
So far, it's been tested multiple times which means that resistance has weakened. I do think that next time we get up to that level, it'll likely break and we can see higher prices.
On top of the resistance being weakened, there's a massive cup and handle forming on the chart. If we end up breaking resistance, the measured target would be the $313 resistance.
I've marked off other important levels on the chart should price break that key resistance level.
Let's see how it plays out over the coming month. Will likely start accumulating calls on any dips.

BTC smashes 120K, ETH tests 4.5K! Is Altseason finally here?Bitcoin breaks through $120K while Ethereum retests critical $4500 resistance. Our analysis reveals why this "Uptober" rally could signal the start of the biggest altcoin surge since 2021.
🚀 Rally catalysts
US Government shutdown : Dollar weakness from political uncertainty and Fed policy paralysis
"Uptober Effect" : Bitcoin historically averages 20%+ gains in October (currently up 5-6% with 3 weeks remaining)
Institutional flows: $4B+ institutional buying, 850K ETH whale accumulation in past 2 weeks
Q4 seasonality: Crypto's strongest quarter with historical momentum into year-end
📊 Bitcoin Technical Analysis
Pattern : Bullish hidden divergence confirmed with swing high breakout above $118K resistance
Current structure : Potential 5-wave Elliott sequence suggesting final impulse leg
Key levels : Support at $117K (trendline), resistance cluster $122K-$124K
Momentum : RSI recovering, MACD bullish crossover confirms continuation
⚡ Ethereum technical breakdown
Weekly setup : Successful retest and hold above $4K support, pennant/triangle breakout in play
RSI divergence : Bullish divergence confirmed on multiple timeframes, RSI near 60 (room to 70+)
Elliott wave count : Either completing Wave 5 (correction ahead) or early Wave 3 (massive move higher)
Cup & Handle : Measured move target to $6,850 based on long-term pattern
🔥 Altseason indicators - Total3 analysis
Chart pattern : Cup & handle formation on Total3 (altcoins ex-BTC/ETH) approaching ALL-TIME HIGHS
Key level : $1.1T breakout threshold - confirmation needs 3 daily closes above ATH
BTC dominance: Break below 60% support signals potential altcoin rotation
Targets: $1.2T initial, $1.3T extension if breakout sustains
💹 Trading Strategy
ETHEREUM LONG Setup:
Entry: $4,300 on pullback (current: $4,500)
Stop Loss : Below $4,050 (1.618 Fib extension)
Take Profit 1 : $5,200 (2:1 R/R)
Take Profit 2 : $6,850 (measured move target)
Risk Management : Trail stops above breakeven after TP1
Key levels to watch:
Bitcoin : $117K support, $122-124K resistance zone
Ethereum : $4,126 critical support, $4,500 resistance, $6,850 long-term target
Total3 : $1.1T breakout level for altseason confirmation
🎯 Market outlook
October living up to "Uptober" reputation with favourable macro setup. Dollar weakness, institutional flows, and technical breakouts align for potential crypto supercycle. Watch Total3 breakout - if altcoins breach ATH, we could see 2021-style altseason explosion.
This content is not directed to residents of the EU or UK. Any opinions, news, research, analyses, prices or other information contained on this website is provided as general market commentary and does not constitute investment advice. ThinkMarkets will not accept liability for any loss or damage including, without limitation, to any loss of profit which may arise directly or indirectly from use of or reliance on such information.

$SOL for Long Monthly ChartThis target will complete in next 1000 Days. Long target for SOL.
Cup & Handle Pattern on Monthly.
Short term
target is 900$
Target 2 is 1200$
Let's go.

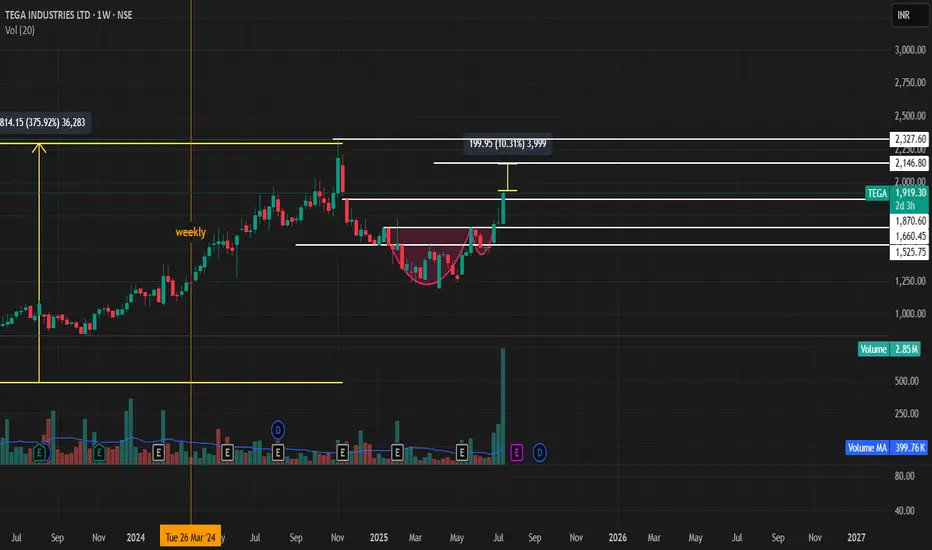
**Tega Industries – Breakout Setup (Cup with Handle Pattern)****Tega Industries – Breakout Setup (Cup with Handle Pattern)**
**Chart Pattern Identified**:
A **Cup with Handle** formation has been identified on the daily/weekly chart of **Tega Industries**, signaling a potential bullish breakout. This classic continuation pattern typically leads to strong upward moves once the handle breakout is confirmed.
---
### 🔍 **Breakout Levels and Price Targets**
1. **Primary Breakout Level – ₹1660**
* This marks the neckline of the **Cup with Handle** formation.
* A confirmed breakout and tgt ₹2,145 would validate the pattern.
(based on the measured move from the depth of the cup added to the breakout point)
2. **Secondary Breakout Level – ₹1,875**
* Acts as a **pre-breakout resistance** or consolidation level.
* A **daily or weekly close above ₹1,875** with strong volume would indicate early momentum and buyer interest.
* **Target after this level is breached**: ₹2,145 (primary breakout zone), and if sustained, an extended target of **₹2,530**.
---
### 📌 **Technical Outlook**
| Level | Significance | Action |
| ------ | ------------------------ | --------------------------------------------------- |
| ₹1,875 | Secondary breakout level | Watch for strong close with volume; bullish trigger |
| ₹1660 | Cup with handle breakout | Key confirmation zone; breakout of pattern |
| ₹2,530 | Extended target | Projected move after full breakout confirmation |
---
### 📈 **Trade Strategy**
* **Entry Option 1**: Anticipatory buy near ₹1,875.
* **Entry Option 2**: Breakout confirmation buy above ₹1875 with higher risk-reward toward ₹2,530.
* **Volume Confirmation**: Essential at both ₹1660 and ₹1875 levels.
* **Stop-loss**: Dynamic trailing stop-loss below handle lows or breakout support zones depending on entry.
---
### ⚠️ **Risk Management & Considerations**
* Ensure confirmation via **volume expansion** and **daily/weekly close** above key breakout zones.
* Be cautious of false breakouts, especially if moves happen on low volume or during broader market weakness.
* Monitor sectoral momentum (capital goods, engineering, or mining equipment) as it may influence breakout strength.
---
Would you like me to generate a chart snapshot or help you set up price alerts or trading logic based on this setup?
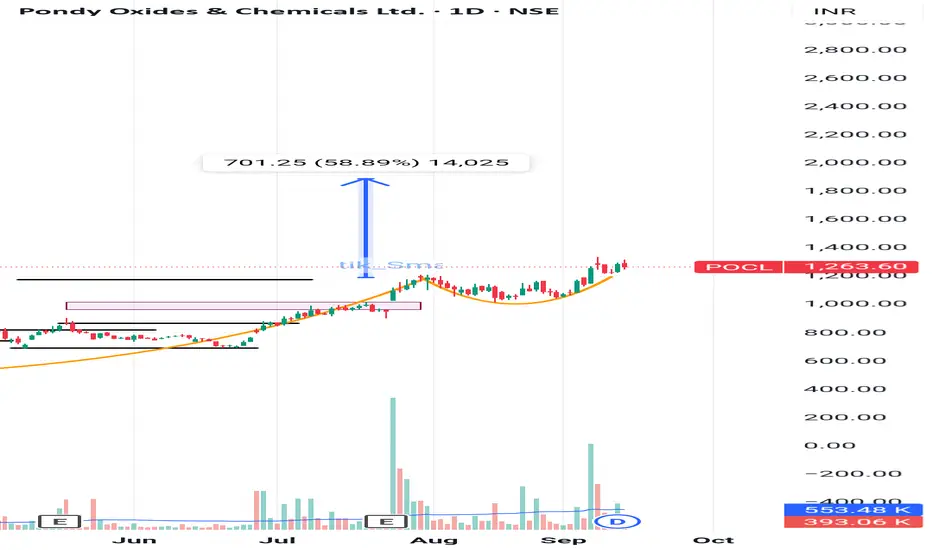
POCL : Cup & Handle PatternPOCL : At Cup & Handle Breakout levels
CMP 1263
Pattern Target 1900
View negated below 1150
Please check the chart for details.
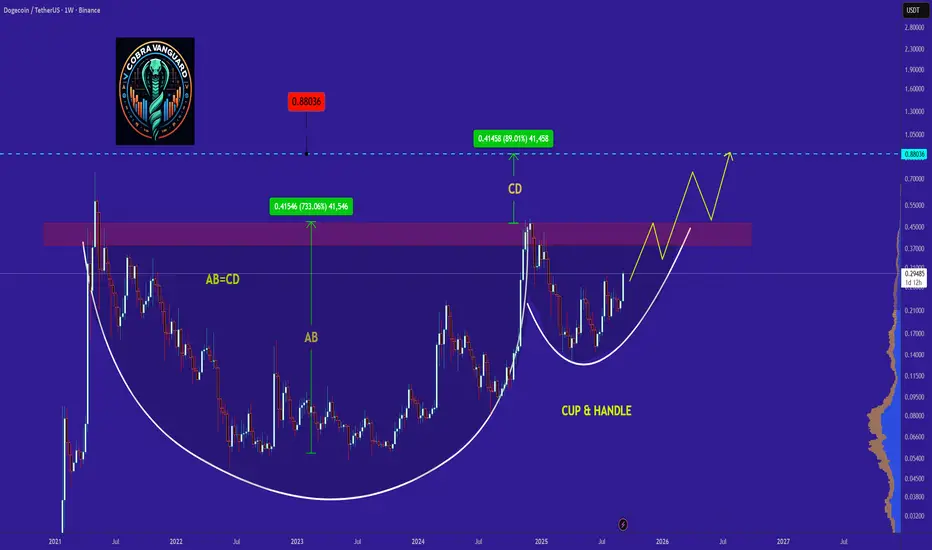
DOGE's Situation, A Comprehensive Analysis !!!It appears that the price is forming a cup and handle pattern, and if this occurs, it could push the price above $0.50.
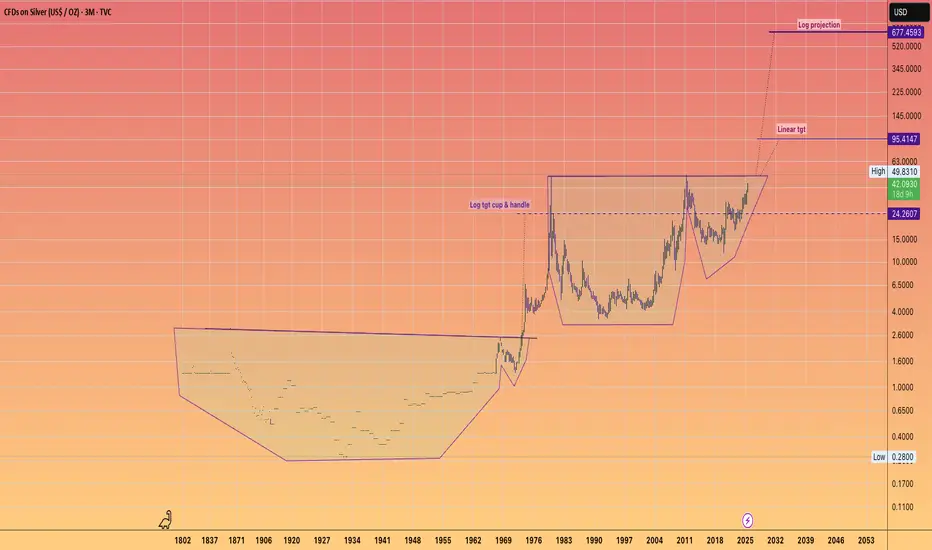
SILVER Accelerating to $95This is the full history of Silver.
With it's two GIANT Cup & Handle Patterns.
Big Patterns = Big Moves !!!
I find myself uncertain about the kind of world we would inhabit if Silver were to achieve the LOG projections in a chaotic disorderly manner.
We are undoubtedly stepping into a period of significant transformation across various sectors for global society in the coming decade or two.
Finance. Governance, Technology—let's seize the moment and take full advantage of the incredible opportunities available to us.
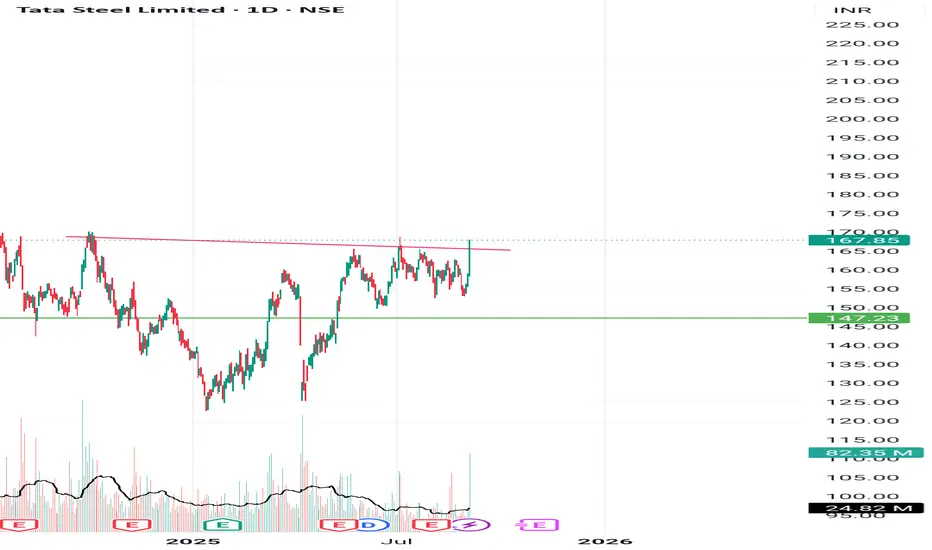
Clear breakout with good volume Breaked a clear trendline cum cup and handle pattern with decent volume indicates to go up. Do your own analysis and take up your trade
***Educational purposes only***