BTC Update — 92K Zone as Bull Run Trigger (100K+ Scenario)Bitcoin is approaching a critical decision zone around 92K, which is acting as a major pivot for the next macro move. Price action shows consolidation and higher acceptance just below resistance, suggesting strength is building rather than distribution.
Why 92K Matters
📍 Key reclaim zone: 92K has historically acted as a strong resistance/support flip.
📈 Structure shift: Sustained trading above this level would confirm a higher high on the intraday structure.
🔊 Volume context: Current compression indicates that once volume expands, the move could be fast and directional.
Bullish Scenario
A confirmed breakout and hold above 92K can be the start of a broader bull phase.
From this zone, BTC has a high probability to accelerate toward 100K+, with momentum-driven extensions possible once psychological resistance is cleared.
Pullbacks above 92K would likely be seen as retests, not reversals.
Invalidation / Risk
Failure to hold 92K after a breakout would delay the move and keep BTC range-bound.
As long as price holds above the current base, downside risk remains controlled.
Summary
This 92K zone is the ignition level.
If BTC accepts above it with volume, the market structure opens the door for a strong bullish continuation toward 100K and beyond.
📌 Patience here is key — confirmation turns this zone into the launchpad.
Cycle

FJET - Cycles Don’t Lie - Structure Is Repeating Again!Markets don’t move randomly.
They move in cycles , and AMEX:FJET just completed another one.
📊 Technical Analysis
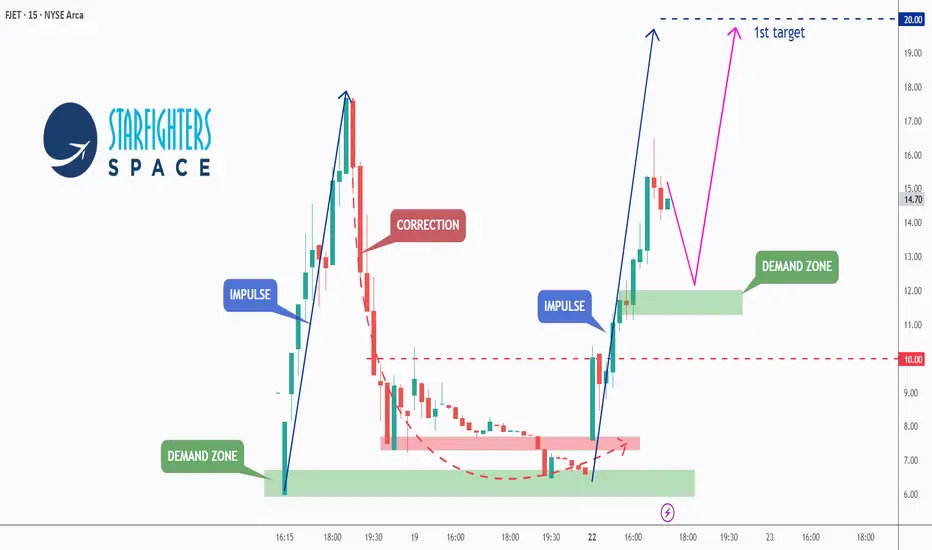
FJET has now officially broken above the falling red channel, confirming the end of the corrective phase and the start of the next impulse leg.📈
This is important, because the structure has been repeating with precision:
• An impulse move
• Followed by a curved correction
• A retest of demand
• Then a break in structure that launches the next expansion
In the previous completed cycle, FJET rallied from around $6.4 to nearly $31 , delivering a ~400% surge before entering correction.
🏹This time, price once again respected the $10- $11 demand zone , formed a rounded base, and has now flipped momentum bullish by reclaiming and breaking above the descending channel marked in red.
With structure already broken to the upside, the bias shifts from anticipation to trend-following.
⚔️As long as price holds above the former channel and demand remains intact, the path of least resistance points toward continuation and a potential push toward new all-time highs.
💡 Bigger Picture (Fundamentals)
Starfighters Space is already operational, running the world’s only commercial fleet of Mach 2-capable F-104 aircraft, not a prototype, not a concept.
🛰️ The company has secured strategic validation from NASA, Lockheed Martin, GE Aerospace, and the U.S. Air Force , a level of credibility rarely seen at this stage.
Following its public listing, FJET now has fresh capital to support expansion, R&D, and continued development of its STARLAUNCH platform.
🎯 Its focus sits at the intersection of small-satellite deployment and hypersonic testing, two of the fastest-growing segments in aerospace and defense.
The business model is built around a supersonic air-launch approach, designed to reduce both launch costs and timelines compared to traditional methods.
📈 Finally, post-IPO market interest remains strong, suggesting attention is shifting from hype to structure, exactly where durable trends tend to form.
📘 Bottom line
FJET has completed another corrective phase, respected demand, and broken structure to the upside, just as it has done before major expansions.
With fundamentals supporting real operations, real contracts, and real demand, this is no longer a story built on speculation.
From here, the focus shifts to trend-following, structure management, and risk control, letting the cycle play out, not forcing it.
📌 Always do your own research and speak with your financial advisor before investing.
📚 Stick to your trading plan, entry, risk management, and execution.
All Strategies Are Good, If Managed Properly!
~ Richard Nasr
Disclaimer: I have been paid $800 by CDMG, funded by Starfighters Space, to disseminate this message.

Alts to make a move in Q1 2006The Altcoin market is still holding strong above the trendline.
Are we entering a supercycle? Your Thoughts?

Bull Market 2023–2025: Final Results (27.12.25)Public history, responsibility, and the environment without which you don’t belong in the market
First of all, I want to thank @TradingView
In 2025, I received the WIZARD badge.
This is not just a label — it is recognition of my contribution as an active member of the TradingView Community.
For me, this matters not because of status, but because of responsibility.
This badge means I have the ability to propose changes and improvements to the platform, and some of these proposals have already been implemented.
I’m genuinely glad to be one of those community members who helps make TradingView better for everyone.
Why TradingView is about responsibility, not social media
I have been an active member of the TradingView Community for a long time, and I strongly believe this platform is fundamentally different from any other financial media space.
First — the chart as the core tool of analytical thinking.
Second — publications and the Play button, which lock ideas in time.
Third — and most important — the impossibility of deleting published ideas.
Fourth - indicators
You cannot rewrite history here.
You cannot erase mistakes.
You cannot hide behind “the context has changed.”
That is why I approach every single publication on TradingView with full responsibility.
Why there is no noise or random content here
I do not use TradingView the way many people use Twitter or Telegram.
There are no:
emotional reactions
random thoughts
posts made for reach or hype
As of December 2025, my audience consists of 132,000 followers, and I fully understand the responsibility that comes with that.
Yes, every publication is not financial advice.
But for myself, I set a clear internal rule:
every idea must be logical, verifiable, and honest.
Why the timeline starts in 2023
I intentionally start this review from 2023 because that is when the bottom of the previous cycle was forming.
At the time, it was not obvious to the majority of the market:
- fear was at its peak
- trust was minimal
- negative narratives dominated
I’ve been in the market for a long time and have lived through multiple full cycles.
This Bitcoin cycle was my third, and I consider it the most professionally executed one so far.
Each cycle is different:
- different narratives
- different audiences
- different speed
But market logic and crowd psychology repeat.
Publications that cannot be adjusted after the fact
Back in late 2022, an idea was published:
Bitcoin cycles + logistic curve = New bull run 2023–2025.
This was done before the move, not after.
Every marker you see on this chart represents a public idea published in real time on TradingView.
It’s important to highlight:
- all key ideas were LONG
- there were no public SHORT ideas during the bull phase
Why?
Because in a true bull market, speculating against the trend makes no sense.
The upside potential always outweighs the logic of catching small pullbacks.
Timing and the end of the cycle
If you open each publication, you’ll see:
- market phases
- time-based expectations
- structural projections
On most higher-timeframe ideas, the end of the bull market was publicly marked in red.
My key time reference was stated in advance — September 2025.
September 2025: when most still believed in continuation
Starting in September 2025, while market euphoria was still present,
I began publishing ideas stating that:
- the bull market was over
- positions were closed
- Bitcoin was forming a reversal
- the market was entering a bull trap phase
- you were warned in advance
These ideas were based not on emotions, but on market structure, cycles, and psychology.
Experience, no FOMO, and a mature position
After years in the market, I have zero FOMO.
I don’t worry about:
- missing a coin
- missing a narrative
- not participating in every move
The market is:
- fast
- volatile
- heavily manipulated
You cannot be everywhere.
The core task of the market is simple:
buy low — sell high.
That’s exactly what I’ve been doing for over 12 years, with more than 10,000 hours spent in the market.
The reality of the modern market
Today’s market consists of:
- funds
- corporations
- algorithms
- quantitative strategies
On lower timeframes and chaotic moves, retail traders are simply outmatched.
The gap between emotional decision-makers
and those who operate with structure, data, and discipline
will only continue to widen.
If you are in the market — you must be in the environment
Here I’ll be as direct as possible.
If you are in financial markets,
if you plan to continue trading,
if you want to survive and adapt —
you must be part of a strong community.
A lone trader in today’s market is easy prey.
Over the years, a community of like-minded traders has formed around me — people who:
approach the market systematically
- discuss scenarios
- analyze entries and exits
- stay connected during difficult periods
I share my public ideas for free, and that remains a core principle.
But if you truly intend to stay in this market,
you need an environment, feedback, and shared logic.
What you do next is your decision.
Trading is a marathon
Trading is not a sprint.
It’s a marathon.
Sometimes the best position is no position.
Sometimes the best trade is the one you didn’t take.
Patience, waiting, and discipline are skills —
without them, you don’t belong in this market.
The current moment and what’s ahead
At the moment, crypto is in a phase where I take very few trades.
Some positions are already open — at predefined levels, within a structured risk framework.
I’m not leaving financial markets:
- crypto
- Forex
- equities
- tokenized assets
- gold
- oil
Instruments change. Principles don’t.
In conclusion
If this chart receives 300 likes,
I will publish a separate post outlining:
- goals
- scenarios
- positioning
for 2026.
Wishing everyone clarity, discipline, and a cold mind.
May 2026 be better than 2025.
And may there be peace on our planet.
Yours, EXCAVO

Bitcoin Cycle Forecast 2024–2028 Based on the Previous CyclesHi all. In my small research study, I've identified certain patterns from the previous three BTC cycles. Based on these patterns, I've created a forecast for BTC peaks and bottoms for the current cycle. I tried to build my model only on elements that have already appeared in previous cycles.
1) Summary.
Each new cycle begins with a confident breakout and subsequent consolidation above the high of the previous cycle. Each cycle lasts approximately 1250-1400 days. Each cycle consists of two peaks, two lows, and then transitions into the next cycle.
Using a Fibonacci grid, the cycle end is 1 and the beginning is 0 . Previous cycle peaks have always ranged between 0.69 and 1 . When price drops below 0 on the fibo at the lowest points, we mark these with a negative sign .
The table shows the values of key points for each cycle: 2 lows, 2 highs, the cycle start (0) and end (1) . The table also calculates price movement in Fibonacci points how much the chart moved between adjacent key points. I then calculated the Total downward movement (2 moves) and Total upward movement (3 moves) for each cycle.
2) Forecasting the base scenario for bottom and peak points in the new cycle.
The previous 3 cycles always started with a strong first peak ( 1, 1, or 0.91 ). This cycle has played out differently. We're seeing price fall after a modest rise. This is the main difference between the current cycle and previous ones. This is what people point to when they claim that cycles supposedly no longer work.
However, there are two key facts:
a) In the 2021-2024 cycle: 0.91 was the first peak, 1 was the second. So the first peak can be lower than the second.
b) The smallest peak across all studied cycles occurred in the 2017-2021 cycle at 0.69 , followed by the smallest move to a low - 0.55 fibo points. This is highlighted in the table.
Since we only know the beginning (0) of the new cycle, for the base scenario Base 1 , I'm using the second peak and the price movement to the second low from the 2017-2021 cycle. I'm applying this data to our new cycle as the first peak and first low to build the forecast.
With this setup, the second peak (1 on fibo) comes out at around 151k USD. It's disappointing that it's so low. I'd be happy to be proven wrong.
For the second low of the current cycle, I'm trying 0.1 , taken from the same 2017-2021 cycle, specifically from its first bottom low. This Base 1 variant is essentially a copy of the 2017-2021 cycle, just with peak1-low1 and peak2-low2 swapped.
Since we already touched 0.14 on fibo (November 17, $80,200) after the supposed first peak, there's reason to believe the first low has already occurred.
If we use a more "optimistic" number for bottom low2, say 0.2 , we'd exceed the average movement of our cycles. So in this scenario, 0.1 is already the upper boundary (with the first low at 0.14 ).
Total downward movement and Total upward movement .
There's a strong similarity between the 2013-2017 and 2021-2024 cycles in this metric. Meanwhile, the 2017-2021 cycle differs from the other two. For all forecasts of the 2024-2028 cycle, we'll stay within the price movement values of previous cycles—between 1.45 and 1.76 for total downward movement.
3) Addition to the base scenario
What if the 1st low turns out lower than expected?
If we're using the average movement of the 2017-2021 cycle, this situation still fits within the model.
Low 1 ∈
Low 2 ∈
Low 2 = 0.24 - Low1
Base 2/3/4 outline scenarios that still align with the 2017-2021 cycle model.
Base 1 2 3 4 - price movement parameters match 2017-2021
Base 5-6 - intermediate version between 2017-2021 and 2013-2017/2021-2024
Base 7 - price movement parameters match 2013-2017 and 2021-2024
Since we only have 3 cycles to study, we can't know for certain what the current cycle's price movement will be or accurately forecast both low positions right away. Since the similarity with the 2017-2021 cycle seems more significant, I'm using that cycle's price movement as the base scenario.
4) Alternative scenarios
Could the second peak be higher than 150k?
This variant is presented as ALT 8, 9, 10 with a second peak at 180k. But in this scenario, the first peak would be at 0.5 on fibo, which is a significant departure from the previous 3 cycles (since the minimum peak was 0.69 ).
ALT 8 - price movement parameters match 2017-2021
ALT 9 - middle ground between them
ALT 10 - price movement parameters closer to 2013-2017 and 2021-2024
Thanks for reading. I welcome your comments. I did this for myself originally but decided to share it with everyone. I'd appreciate if you point out any issues you find or share thoughts that could help develop the model further.

FJET - From Private Skies to Public Markets!!Most retail investors never had access to the biggest space winners.🌌
SpaceX went from a private valuation near $46B to over $800B without ever giving the public a chance to participate.
This time, the door is open❗️
Starfighters Space, Inc. AMEX:FJET has officially entered the public markets, giving everyday investors exposure to a real aerospace company… Not a concept, not a slide deck; but one already flying missions out of NASA’s Kennedy Space Center.
📊 Technical Analysis
Following its public debut, FJET delivered a strong impulsive move 📈, confirming aggressive buyer interest.
After a healthy correction into demand, buyers stepped in again, keeping the structure intact.
Price has now broken and held above the $10 area , confirming bullish continuation and validating the higher-timeframe structure.
🔁 From here, the expectation is a shallow pullback / consolidation , followed by continuation in line with the scenario marked in purple.
🏹 The $20 zone represents the first target , and upon reaching it, I will be watching for further upside , at which point I’ll post an updated outlook.
💡 Bigger Picture
This isn’t a speculative space idea, it’s an operating aerospace company 💼with rare credentials:
- World’s only commercial Mach 2-capable fleet of Lockheed F-104 Starfighters.
- Operating directly out of NASA’s Kennedy Space Center.
- Strategic validation from NASA, Lockheed Martin, GE, and the U.S. Air Force.🛩
- Pioneering a hypersonic air-launch platform designed to dramatically reduce the cost and timeline of microsatellite deployment.
- Successfully completed a $40M Regulation A+ raise , transitioning from private capital into the public markets.
Recent history shows that real aerospace IPOs tend to move early:
Voyager, Firefly, Karman, and AIRO all saw sharp post-listing expansions.
In this sector, the first phase after going public often matters the most.
📘 Bottom line
FJET offers something rare:
💎Early exposure to a credible aerospace company right after it entered the public markets, before full institutional positioning and before the story became widely crowded.
📡Whether you approach it as a technical setup, a newly public aerospace play, or a longer-term space infrastructure narrative, this is a name worth keeping on the radar.
⚠️ Always do your own research and speak with your financial advisor before investing.
📚 Stick to your trading plan, entry, risk management, and execution.
All strategies are good; if managed properly.
~ Richard Nasr
Disclaimer: I have been paid $800 by CDMG, funded by Starfighters Space, to disseminate this message.
ETH - Same Pattern. Same Timeline. Same Outcome?Ethereum is showing something extremely interesting… and extremely familiar.
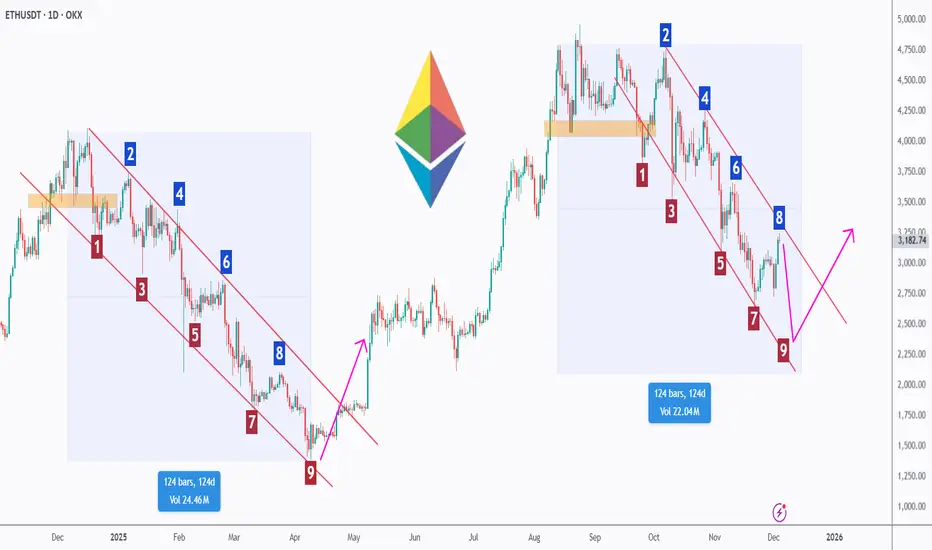
When we compare the previous corrective cycle to the current one, both have unfolded almost identically, not just in structure, but also in duration, each measuring around 124 days.
🌊Both cycles followed a clean 1-to-9 wave sequence inside a falling channel before ETH broke out aggressively. And right now, ETH is completing the same exact structure, approaching wave 9 once again.
🔄If history rhymes, and it often does in crypto, ETH may be preparing for a major impulsive phase, similar to what happened after the previous 124-day correction.
From the lower bound of the channel, we will be looking for trend-following longs, anticipating a potential bullish reversal that mirrors the last breakout.
Cycles don’t repeat perfectly…
But they rhyme more often than people think. 📈✨
⚠️ For now, the trend remains bearish, however, ETH would invalidate the entire bearish structure if the upper trendline breaks upward aggressively, signaling that bulls have fully taken over.
Do you believe ETH is about to repeat its previous breakout? Share your view below! 👇🔥
⚠️ Disclaimer: This is not financial advice. Always do your own research and manage risk properly.
📚 Stick to your trading plan regarding entries, risk, and management.
Good luck! 🍀
All Strategies Are Good; If Managed Properly!
~Richard Nasr
The Hidden Rhythm Behind Bitcoin’s Four-Year CycleSince 2015, Bitcoin has been moving like a heart beat that refuses to tick randomly. If you zoom out far enough, the timeline paints a pattern that repeats with crazy precision — a rhythm of 365 and 1,065 days, echoing across bull and bear cycles.
Here’s the sequence:
• 2017 All-Time High → 2018 All-Time Low:
365 days
• 2018 All-Time Low → 2021 All-Time High:
1,065 days
• 2021 All-Time High → 2022 All-Time Low:
365 days
• 2022 All-Time Low → 2025 All-Time High:
1,065 days
A perfect alternation, almost like Bitcoin inhales for a year… and exhales for three.
This pattern aligns beautifully with the idea of a four-year cycle, but what’s fascinating is its precision. It’s not vague. It’s not approximate. It’s day-count accurate, which makes you wonder:
Is this just market psychology repeating itself?
Or is Bitcoin following a deeper structural rhythm embedded in its halving mechanism?
But here’s where it gets interesting…
This cycle might not stay “perfect” forever.
We’re entering a new era where:
• Countries are adding strategic Bitcoin reserves
• Institutional funds, big company's are stepping in ( Microstrategy, Tesla, etc. )
• ETFs and sovereign buyers are absorbing supply that miners can’t replenish
This pushes Bitcoin closer to becoming a macroeconomic asset, not just a speculative one.
And when the character of an asset changes, its cycles can stretch, twist, or break.
So maybe — just maybe —
even though the 365/1065 rhythm held from 2015 to 2025 like clockwork…
this time the real bull run might arrive later than expected.
A delayed ignition.
A late bloom.
A cycle that still respects the past — but evolves with the future.
Because for the first time in Bitcoin’s history, the buyers are not just retail dreamers or early believers.
They’re nations.
They’re institutions.
They’re multi-decade players.
And assets behave differently when the hands holding them change.

Sentiment cycle. Two sentiments and FUD.Based on Livermores "opposite day trading", Qullamaggies 10/20/50.
Livermores emotion cycle doesn't fully explain price dynamic. In practice markets or crowd have a clear sentiment of "safety" and trust. and "danger" and distrust.
You can have a strong market... that breaks and starts crashing --> You know the sentiment wont be the same. You see some risk taking fomo.. but it doesnt end nowhere. Because the core of every strong market is strong momentum technicals or setup. Odds in your favor etc.
It's very clear where the SENTIMENT (cycle) shifts to crashing and "it wont be the same anymore". towards risk on (setup).
Categorizing all market on RISK-ON, RISK-OFF (at near term) wouldnt explain the dynamic either... because like most of the time (maybe 80%) market is on a FUD mode.
Livermore was good at explaining crowd temperature.
Something could be bullish, but still on FUD mode -> and you get these tiny sell offs, losing due to SL or selling on fear.
clear "RISK ON" is where, based on Qullamaggie, there are strong upsloping quick MAs (10/20/50). --> best explanation would be that people trust in the market. It's hard to lose, when everyone throws money at market.
eventually it leads to FUD channels etc. or corrections.
Even today --> there do always be some chance, that market just crashes. No guarantees. Strong technicals but FUD sentiment.
//April, May, June were all FUD.. fear uncertainty doubt.
Livermore said there was only two emotions, Fear and Greed.

2025 Bitcoin cycle over, prepare for 2029. Phase A — “Early Downtrend”
Nov 2025 → Apr 2026
Bitcoin drifts down from $100K–$95K
Enters $80Ks
Weekly momentum failing
Phase B — “Cycle Breakdown → Panic Flush”
Jun 2026 → Nov 2026
Macro liquidity tight
Miner stress increases
ETF inflows slow or briefly reverse
Price cascades into $60Ks and $50Ks
Monthly oscillators bottom out
You BUYS HERE: ($68–$55K)
This is your PRIME accumulation zone.
Rinse, repeat. This is how true Bitcoiners do it.
UP FOREVER: Bitcoin Doesn't Care About Your Opinion
@upforevermovie

Bitcoin - The Calm Before the Next Wave?📉Bitcoin has entered yet another correction phase within its long-term rising channel, following the same rhythm we’ve seen in previous cycles.
Each major correction (highlighted in red) has historically been followed by a strong bullish impulsive move from the lower blue trendline, and this time, price is once again testing that key structural support.
🔁If history repeats itself, this could be the final retest before a major rally toward the upper boundary of the channel, potentially aligning with the next cycle’s exponential phase.
Will Bitcoin bounce from this level one more time, or is a deeper correction still on the table? 👀
⚠️ Disclaimer: This is not financial advice. Always do your own research and manage risk properly.
📊All Strategies Are Good; If Managed Properly!
~Richard Nasr

Bitcoin: Liquidity CycleTypical liquidity cycle is 5-6 years long (65m). Buy bitcoin before an upswing (or end of QT) and sell when liquidity tightens. Macro is the best way to analyze markets?
Adjust your stakes based on position of the cycle.
Markets can have risk-on, risk-off episodes. Where Bitcoin is a risk-on asset.
Use 10Y-02Y for guidance.

Gold. About the time for 5400 pips. 12/Nov/25Xauusd is timing boom for 5400 not just 5300 pips drop as previous ideas..

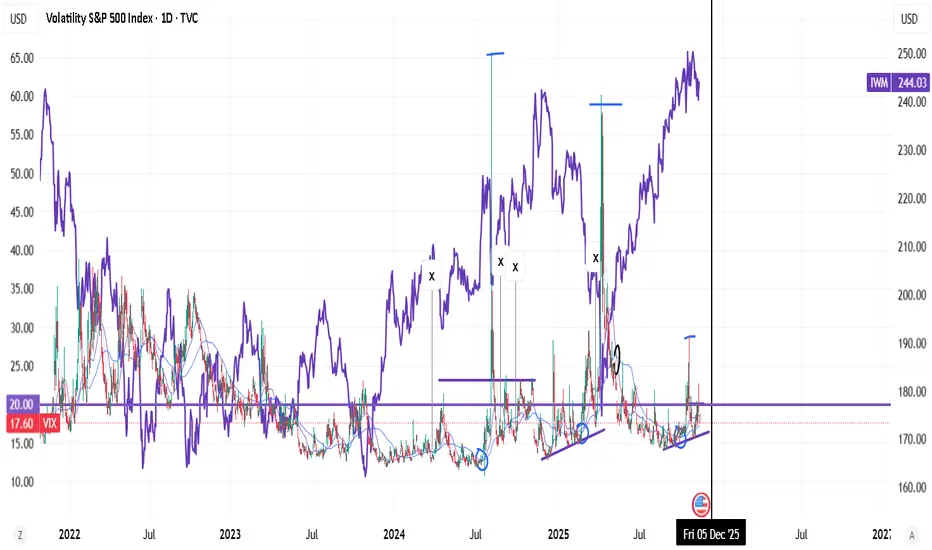
Upswingy VIX in patterns is bad for Small cap returns.Where VIX gets 10/20/50 upswings, goes in patterns (structure). it seems it's a bad period for small caps.
Also, rising $TNX. which is the case now .
x- stands for bullish weekly macds.
Bitcoin - Mid halving Cycle Correction in 2026Bitcoin - Mid halving Cycle Correction possibility like 2021.
Bitcoin performed a mid cycle correction in 2021, of about 50% in only a few weeks just to print a new ATH weeks later. This scenario is very likely to play out when the range around $94k/ CRYPTOCAP:BTC breaks without a Bidding and is invalid when the prive returns above $104k after $94k

Bitcoin - Will History Repeat Itself Again?📈Bitcoin continues to follow a remarkably similar path to its previous market cycles. Each major bullish impulse has been followed by a controlled correction, a fakeout towards the lower trendline, and then a strong rebound toward new highs.
Looking closely at the current structure, BTC seems to be retesting the lower bound of its long-term rising channel, a pattern that played out multiple times before every major leg up.
⚔️If history repeats itself, this fakeout could mark the final shakeout before the next macro rally, with a potential reversal forming between late November and early January.
🏹From there, the next impulsive wave could push price toward the upper boundary of the channel, around the $150,000–$160,000 zone, aligning perfectly with Bitcoin’s long-term cyclical rhythm.
The big question remains: will history rhyme once again, or is this time different?
⚠️ Disclaimer: This is not financial advice. Always do your own research and manage risk properly.
📊All Strategies Are Good; If Managed Properly!
~Richard Nasr

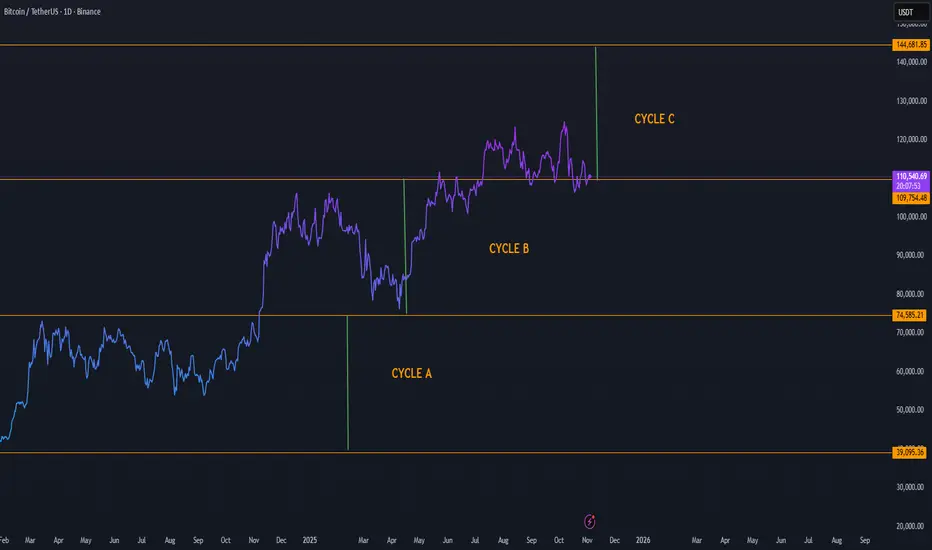
Bitcoin Cycle Analysis Entering Cycle C with Target Toward $144KBitcoin’s long-term market structure continues to evolve in well-defined phases, as visible through Cycle A, Cycle B, and the current Cycle C formation. Each previous cycle has followed a similar pattern: accumulation, expansion, correction, and new leg upward — and Cycle C appears to be following this same rhythm.
Here’s what the structure shows:
Cycle A: Represented the deep accumulation zone and base formation, bottoming near $39K–$75K.
Cycle B: Brought a strong recovery and expansion phase, establishing a stable mid-level support around $110K.
Cycle C (Current): Price is consolidating around the $110K area, likely preparing for the next expansion wave.
If Bitcoin maintains this cyclical rhythm, the next major target lies near $144K, aligning with the top boundary of Cycle C. This zone represents the next major resistance level and potential completion point of the current macro cycle.
Key observations:
Holding above $109K keeps Cycle C active and healthy.
Increasing volume during the next upward move could confirm a breakout continuation.
A successful push beyond $120K would strengthen momentum toward the $144K region.
WIF/USDT – Accumulation Phase Before Potential RecoveryWIF continues to consolidate after an extended downtrend, currently trading around $0.53 within a well-defined range between $0.45 (support) and $0.85 (resistance).
The structure shows signs of base formation, with steady accumulation and reduced volatility — a setup that often precedes directional movement.
Support zone: $0.45 remains the key demand area where buyers are consistently stepping in.
Resistance zone: The main resistance to watch is near $0.85 — a breakout above could confirm trend reversal.
Volume behavior: Gradually increasing volume hints at potential momentum build-up for an upward move.
If market sentiment improves, WIF could attempt a return toward the $0.75–$0.85 zone, marking a mid-term recovery phase. For now, holding above $0.50 keeps the structure constructive for a bullish continuation.

Bitcoin 2025-2029 CycleLikely bitcoin price movement for the rest of 2025 to the bear market bottom of 2026/27 and finally to the next bull peak of 2029
Check in early 2027 for accuracy

Bitcoin Weekend Volume Could Exceed 116K as Smart Money Accumula📊 Market Update
Bitcoin has been building strength since the 106K–107K level, showing signs of a new uptrend. Both the lower time frames and the main trend are currently positive. There’s a strong possibility that BTC will target 112K as the first level, with 116K+ also possible depending on the weekend trading volume.
🔹 Market Structure
The market structure is gradually building, suggesting smart money inflows into BTC over the last 10 hours. We’ll continue tracking this development closely further

BTC GOLDEN CYCLE CAN START ANY MOMENT WITH BREAKOUT 112K AFTER..BTC Breakdown Completed — Potential Rebound Toward $112K 🔁
Bitcoin has successfully tested the 106K zone, completing the expected breakdown move.
Price action now shows early signs of stabilization, suggesting that a recovery toward $112K–$113K could follow in the short term.
📊 Market Outlook:
Support was confirmed near $106K, halting further downside pressure.
Short-term resistance sits around $111.6K–$113.5K, the next likely retracement target.
Momentum remains weak but improving — volume shows early buyer re-entry.
📈 Scenario:
If BTC maintains support above $107K, a technical bounce toward the mid-range near $112K becomes likely before facing renewed resistance.
However, failure to sustain current levels could risk a retest of $106K.
💬 Summary:
BTC completed its breakdown to the 106K area and is now forming a possible relief rebound setup targeting $112K–$113K range.
With the same data, we did expect before the breakdown from 115K to 106K zone

SPX - The Road to 6900 Begins “History never repeats itself. Man always does.”
A deep look into SPX History exposes the path of a market cycle and tells us the truth on where markets are headed.
Percentages don't lie.
See you guys at 6900!

Deeper Correction + Opportunities in DEC/JAN. based on VIXNot sure if VIX FUT can be a lead indicator. The pattern narrows end of year or new year (historical correlation w/ corrections).
//VIX FUT trending above 20 means high probability corrections.
