Crypto Dhadaam!Bitcoin from Last month and all time high of 121245 has now showing weakness.
As per my analysis bitcoin Should find its Support @ 80000 and from here it should rally till
107000 which is my target.
Buy @ 80000
SL @ 75000
Target 107000
Trade of 1:5
Ting Tong Ting...
Cyptocurrency

1INCH Analysis (2H)The internal trendline has been broken and the structure is bearish. Below the current price, there is an important support level that has been tested multiple times, and lower highs have formed, indicating selling pressure.
The targets are marked on the chart.
A daily candle closing above the invalidation level will invalidate this analysis.
Do not enter the position without capital management and stop setting
Comment if you have any questions
thank you

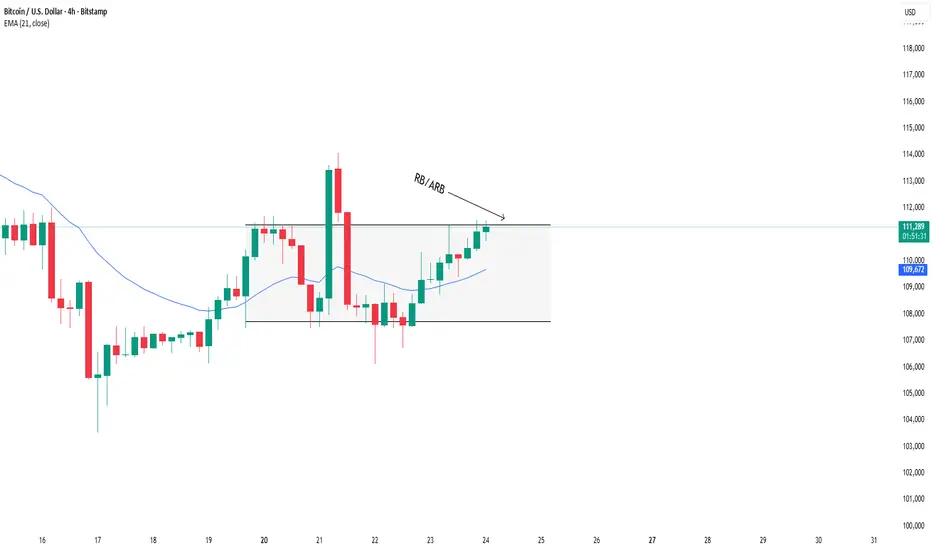
BTCUSD: Waiting for breakout confirmation near the range highBTCUSD – Analysis for October 24, 2025
Yesterday, we had two trading setups for BITSTAMP:BTCUSD .
The IRB setup played out as planned when the price rebounded from the EMA, formed a consolidation zone within the range, and then broke out strongly, pushing up toward the upper boundary of the range.
This move shows that bullish momentum is still present, although the resistance near the range high remains a key area where short-term profit-taking may occur.
Today’s Trading Plan
Wait for the price to compress and form a tight consolidation zone near the upper boundary of the range.
Confirmation condition: No candle closes below the EMA, which would confirm that buying pressure remains in control.
Once a RB or ARB setup appears, that will be our signal to enter long positions.
Bullish Scenario (primary bias):
Entry: On confirmed RB/ARB setup near the upper edge of the range
Stop Loss: Below the nearest EMA
Take Profit: Targeting extended resistance levels above the range
Alternative Scenario:
If the price closes below the EMA and breaks the compression structure, we’ll stay out of the market and wait for a new setup once the structure stabilizes.
Summary
BTC continues to show strength, but the upper range boundary remains a key test.
Today’s plan: Wait – Confirm – Execute. Avoid FOMO until a clear confirmation appears.
Daniel Miller @ ZuperView
BTCUSD: Short still in play, eyes on 117K support📊 BITSTAMP:BTCUSD Analysis – October 9, 2025
🔁 Review of Yesterday’s Plan
As projected in yesterday’s plan (Oct 8), after BITSTAMP:BTCUSD broke above the EMA and moved toward the upper resistance zone, our Sell entry at 123,449 was triggered.
Price then dropped sharply, following the expected scenario perfectly.
🎯 Objective for Today
The focus for today is trade management on the current open position.
The active trade is now approaching a profit range of 2R – 3R.
We expect BITSTAMP:BTCUSD to continue declining toward 117,000 – 116,000,
→ which is also the key support area to look for potential Buy setups,
according to the Daily plan mentioned in yesterday’s analysis.
✅ Trading Plan for Today
Maintain the current Sell position, monitoring price action near 117,000 – 116,000.
Once price reaches this zone, watch for confirmation signals (DD/FB or strong volume reaction) to prepare for a Buy setup aligned with the main trend.
Avoid new entries between current levels — focus on managing the running trade and waiting for key zone reactions.
🎯 Summary:
The Sell setup worked precisely as planned, now yielding solid profits.
Next focus: monitor 117,000 – 116,000 for a potential Buy opportunity aligned with the higher timeframe structure.
You can refer to my previous analysis here:
Please like and comment below to support our traders. Your reactions motivate us to do more analysis in the future 🙏✨
Daniel Miller @ ZuperView

Bitcoin, is the swing low in? BTCUSD / 1D
Hello Traders, welcome back to another market breakdown.
BTCUSD is trading inside a trading uptrend for now with a bullish structure. I'll be looking for a long pull-back lower to add to my long position.
If the pullback holds and buy mode confirms, the next leg higher could target the mid of the previous range and eventually the last swing high.
Stay disciplined, wait for the market to come to you, and trade with confidence!
Trade safely,
Trader Leo.

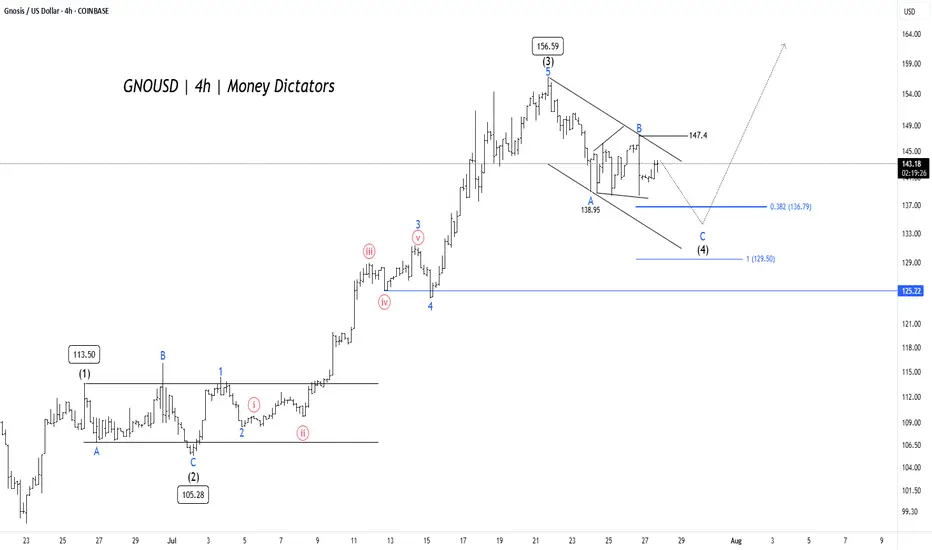
GNO/USD Price Action Aligns for Final Wave 5 PushGNO/USD pair is unfolding a clean Elliott Wave impulse pattern on the 4-hour chart. The rally began with Wave (1) reaching 113.50, followed by a corrective Wave (2) that bottomed near 105.28. This set the stage for a powerful Wave (3) that surged to 156.59, aligning well with Elliott Wave theory where Wave 3 is typically the strongest and steepest leg in the sequence.
Wave (4) is now in progress, taking the form of an A-B-C correction inside a descending channel. Interim support was found at 138.95 during Wave A, and Wave C could extend toward the 0.382 Fibonacci retracement level at 136.79 or the deeper support zone near 129.5. These levels are crucial, as they often mark the end of a corrective phase and the beginning of the next impulse. A confirmed breakout above 147.4 would signal the start of Wave (5) and the return of bullish momentum.
Short-term targets have the potential to reach 135 – 128 , while 125.22 remains the invalidation level for this bullish setup. After the completion of Wave (4), traders can look for long opportunities targeting 147 – 154 – 172 . As long as the structure holds and price respects key supports, the outlook remains favorable for a fresh push higher in Wave (5).
If BTC pullsback to 80K, DO NOT PANIC -Here is why
Very simply, Bitcoin recently broke over the line of resistance ( dashed line) that has kept it down since the ATH at the beginning of the year.
As you can see, it has not yet returned to that line on a larger time scale chart, to retest it as support. It did do that on a 4 hour chart but maybe we are about to see that on a daily to, just to check how strong it is.
After all, things are very uncertain right now in many ways.
The Federal Reserve of the Usa has a speech day tomorrow and so this may act as a catalyst, one way or another.
Bitcoin Weekly MACD is in a position of strength now
And we have seen a positive reaction of PA already, if a little subdued while we wait for the Macro environment to calm down
The Histogram is looking Bullish though this can change quickly but over all, we are in a very good place right now.....
So, Worry not if PA drops some in the next 24 hours.
If we loose 78K, then get a little uncertain.
The next level of support below that is the 2.272 fib extension at 76900 - we do not want to loose that one for too long but I doubt we will get there, providing Macro stays steady
So, Chill out and let see what happens tomorrow with the FED speech.

BNB is on weekly supportBNB now is staying above the strong weekly support with big shadow, and will raise to $1400 IMO

XIONUSDTanalysis using SNR ORIGINAL Chart Pattern, trade at ur own risk, 132% profit, worth to try with less than 30% cutloss..

THE TRUMP RETURN GAME.. DAY TRADE POSSIBLITYTHE TRUMP GAME.. DAY TRADE POSSIBILITY
We did add yesterday a trump update and closed with an increased range.
This new price change TRUMP/USDT seems interesting for a live follow and for this reason, we will focus on the return of the coin and maybe there is more than just a return. new volume can bring interesting things with it.

btcusdt bearishBitcoin broke the bear wedge it had done before. With this breakout, it created an inverted flag formation. After the breakout of this channel, the first target will be the 85k region.

SOL/BTC CUP&HANDLEThere is a huge cup&handle pattern at SOL/BTC chart. I am waiting for the break of it to upside to long SOL.

DOGECOIN: THERE WERE SIGNS! COINBASE:DOGEUSD
DOGECOIN: THERE WERE SIGNS!
The signs:
1.) High Five Setup (Macd/ RSI/ Trend/ Volume profile/ chart pattern)
2.) Symmetrical triangle breakout on the weekly with a retest
3.) Bitcoin's tide is lifting all ships.
Measured Move Hit.
I was not in this name; I just wanted to use it as a tutorial.
NFA

NEIROUSDT.P LONGNEIROUSDT.P LONG
Entry .0008004
TP .0013320
SL 10-20%
Use low lev only!
TYOR
DYOR
NOT A FINANCIAL ADVICE
Happy trading!!!

Alikze »» PYTH | Penetration below the resistance zone🔰 The PYTH Network is the largest and fastest-growing first-party oracle network. Pyth delivers real-time market data to financial dApps across 40+ blockchains and provides 380+ low-latency price feeds across cryptocurrencies, equities, ETFs, FX pairs, and commodities.
🔰 The currency of the PYTH network has faced supply in the 4H and 8H time after an upward trend in the resistance range, which currently, due to the fact that it has penetrated below the resistance, it can face any higher supply and up to the green box area of this correction.
🔰 to continue But if the resistance zone and the dynamic trigger break, it can continue to grow until the next supply zone.
»»»«««»»»«««»»»«««
Please support this idea with a LIKE and COMMENT if you find it useful and Click "Follow" on our profile if you'd like these trade ideas delivered straight to your email in the future.
Thanks for your continued support.
Sincerely.❤️
»»»«««»»»«««»»»«««

Bitcoin / U.S. Dollar Is it forming Cup and handle formation?It just in my imagination. BTC just BOS on TFW, and then pull back. Cup and handle formation could be forming cause there is a FVG to be closed and Bullish Breaker Block to be mitigated. My play book is DCA on dip. BTC is very bullish and by far it hardly mitigated the previous B-OB.
Very time when is pull back its always have buying power to push the price back. Lower than $50000 I am Out.

Black Rock push Bitcoin price to new highs, But Bitcoin is aboutAs the United States continues to approve Bitcoin spot ETFs, more and more funds are entering the market. Undoubtedly, these institutions have made a lot of profits.
However, the bull market for Bitcoin cannot last forever:
The overall economic performance in the United States is struggling, and the issue of inflation has not been fundamentally resolved. The Federal Reserve is likely to postpone interest rate cuts. Continued interest rate hikes could lead to a sharp decline in Bitcoin prices.
The current attitude of the United States towards Bitcoin remains delicate, and approving a few ETFs is not a particularly significant positive. Nevertheless, it remains a key factor driving the rise in Bitcoin prices, and I believe the market's imagination is overly optimistic. For any country, it is not yet time to compete for the pricing power of Bitcoin. Therefore, when the delicate attitude shifts, the market may panic, causing a decline in Bitcoin prices.
The news of Bitcoin's halving has fueled a continuous rise in its price. However, the problem is that this information has been known for a long time and has already driven the market higher. It should not be a reason to continue pushing prices. When Bitcoin's halving actually occurs, the price of Bitcoin may decline.
I believe the current market is overly irrational, with a significant influx of funds leading to a continuous rise in Bitcoin prices. However, I think we are not far from a sharp decline in prices. The current market risks are substantial, and there are ample reasons for a downturn.

Bitcoin Market Cycle This chart tried to reflect the uncanny similarities between Bitcoin's previous cycles and will try to use that information to "predict" next market cycle top in terms of price and time.
The price is derived using Log FIB extension 1.618 and is the minimum Bitcoin has to hit.
Although Bitcoin has gone way above this extension in the past, I am going to keep things a little conservative.
The chart is aimed to not use any indicators to keep it clean but you can apply Pi cycle top indicator (which has been super accurate to make it more precise)
The chart shows how bottom of the previous bear market to the next one takes about 206 Weeks or so and how bear market lasts about 52-55 weeks while Bull market (from the bottom and not halving) is about 155 Weeks ish.
While the drawdowns are becoming less and severe by some percentage, I chose about 75% drawdown for next bottom in 2026 with price of about mid 40K.
Like someone said " All models are wrong but some are useful" this can clear some noise and provide us some timeframe when we can start taking some profits based on time and price.
Over time, I will provide update to this model if I think I can make it more accurate.
LFG!!

BTC SELLAccording to the previous analysis, it is expected that the price will decrease from this range and we will see a decrease in the price of Bitcoin

$Bitcoin - Its all in the charts.As can be seen, BTC is moving in a curve. This curve seems to have found bottom around 16k for this cycle and is right now hugging the bottom trend line.
-Given this curve, will we see 16k again?
-Looking at the historicals, most likely not. But IF the price action breaks the bottom trendline then that will be a first and after that anything can happen.
If everything goes according to plan, and by plan I mean according to history, we should see a cycle top around next year second half, latest by start of 2025 but we may not need that much time.
-What will be the catalyst for a new cycle top?
-No idea. I make my decisions only looking at the chart and not news.
-Can I be wrong?
-Maybe, maybe not.
Only thing we as investors can do, is to DCA our position and wait.

Bitcoin analysisHello friends
In the major period and in the weekly time frame, if we accept that at the price of $69,000, the 5-wave bullish Bitcoin has ended, we can imagine that we are still taking corrective steps.
Also, by hitting the supply area of 30-33 thousand dollars, we saw the breaking of the Rising Wedge pattern, which makes the above analysis more likely to be correct.
If the price level of 24800 dollars is broken, the final confirmation will be issued to continue the decline.
Based on this, my overall view on Bitcoin is bearish

#FTM Wait for the pullback to the broken structureIf you enter according to the previous analysis, keep it.
For a new entry, you should wait for the 0.4883 range to be 3 cycles lower on the way up the wave
Short-term targets: 0.5859 - 0.6348 - 0.6836

