BTC OUTLOOKThe moves up to the 107K region are still just corrections in my view.
During previous tests of the rising channel support, we had clear hidden bullish divergences on RSI, MACD, and Stochastics which resulted in strong and fast recoveries. However, in the current test, when we also take USDT.D dominance into account, the picture looks more cautious.
USDT dominance has broken above its long-term descending trendline and is now holding above it. This indicates increasing demand for stablecoins and a risk-off tone in the market something we should not ignore.
As long as BTC holds above $90,500, the market remains safe within the broader structure. But a daily close below $90,500 could open the door for a deeper correction toward the major horizontal support in the $69K–$70K zone.
This is my current BTC outlook stay cautious and manage risk accordingly. 📉📈
This is not financal advice.
Cyrpto

Gold Selloff EOYGold has reached a critical resistance structure around $3,880-$3,895. As in recent post the target for Goldman Sachs was $3,700 with an exhaust level of $3,880. Even with government shutdown, I believe cryptos and coming crypto ETF’s (XRP) will become dominant in “safe haven” assets. The price of gold is extremely overbought and the greed is at an all time high.
My targets will sound outrageous. But we will possibly see gold get reckoned in the next two months into the next 2 years. The stable price of gold is below $2,100 and is sitting at a support area of $1,742. With an actual price liquidation zone at $1,572. This is simple physics and realism. Everything that goes up has to come down. This gold price not only reflects fear, but extreme greed. Actuality will set in soon.
-Goodluck, This is NFA
R2C

HARD SHORTMy former analysis successfully landed to target zone. And now market wants a pull back.
1-Above there is low liqudation
2-Next week we will probably see a rate cut. thats why I am a little nervous abot open short
3-Till that day I think whales will chase cheap asset that is where my courage come from
4-Market wants to see a pull back
be careful about short you may just want to open long at the below
Always manage your own risks this is not a investment advise I am not responsible neither your loss nor profit.

ETH ready for bullish momentum.ETH accumulated enough short liquidation for bullish momentum. With the expectation of rate cuts in september we will see a bullish momentum towards these levels #ETH

EIGEN SHORT TERM be careful for trigger if it not triggered do not enter cause here is a bit critical under that line we may see a bearis movement Above white support eigen still chance to rise but my main target feels like a bit far so you may want to close some at tp 1
Always manage your own risks this is not a investment advise I am not responsible neither your loss nor profit.

COIN 3Hour Time frame📊 COIN 3-Hour Snapshot
Current Price: $318.78
Change: +5.49% from the previous close
Intraday Range: Not specified
Market Cap: Approximately $83.3 billion
P/E Ratio: Not specified
Beta: 2.89
🔎 Key Levels
Resistance:
R1: $318.78 (recent high)
R2: $330.00 (next resistance zone)
Support:
S1: $310.00 (immediate support)
S2: $300.00 (next support level)
📈 Technical Indicators
RSI (14): Not specified
MACD: Not specified
Moving Averages:
5-period SMA: Not specified
50-period SMA: Not specified
200-period SMA: Not specified
📌 Market Sentiment
Catalysts: Positive momentum following recent gains and analyst upgrades.
Sector Performance: Cryptocurrency market showing strength, with Coinbase leading gains among peers.
Options Activity: Significant trading in call options at $318.78 strike price, indicating bullish sentiment.
📅 Outlook
Bullish Scenario: A breakout above $318.78 could lead to a push toward $330.00 and higher.
Bearish Scenario: A drop below $310.00 may test support around $300.00.
Overall Bias: Moderately bullish, with positive momentum but facing near-term resistance.

ADANIENT 3Hour Time frame📊 ADANIENT 3-Hour Snapshot
Current Price: ₹2,334.60
Change: +0.99% from the previous close
Intraday Range: ₹2,287.55 – ₹2,358.00
Market Cap: ₹2.67 trillion
P/E Ratio: 41.65
EPS (TTM): ₹55.45
Beta: 1.04 (moderate volatility relative to the market)
🔎 Key Levels
Resistance:
R1: ₹2,358.00 (recent high)
R2: ₹2,380.00 (next resistance zone)
Support:
S1: ₹2,287.55 (immediate support)
S2: ₹2,260.00 (next support level)
📈 Technical Indicators
RSI (14): 62.46 — Neutral to slightly bullish
MACD: 12.04 — Positive momentum
Moving Averages:
5-period SMA: ₹2,272.45 — Buy signal
10-period SMA: ₹2,302.60 — Sell signal
20-period SMA: ₹2,297.07 — Sell signal
50-period SMA: ₹2,458.13 — Sell signal
Stochastic Oscillator: 25.53 — Neutral
Williams %R: -71.18 — Buy signal
📌 Market Sentiment
Catalysts: Positive momentum following recent gains and analyst upgrades.
Sector Performance: Infrastructure and energy sectors showing strength, with Adani Enterprises leading gains among peers.
Options Activity: Significant trading in call options at ₹2,350 strike price, indicating bullish sentiment.
📅 Outlook
Bullish Scenario: A breakout above ₹2,358.00 could lead to a push toward ₹2,380.00 and higher.
Bearish Scenario: A drop below ₹2,287.55 may test support around ₹2,260.00.
Overall Bias: Moderately bullish, with positive momentum but facing near-term resistance.

HCLTECH 3Hour Time frameHCL Technologies (HCLTECH) 3-Hour Snapshot
Current Price: ₹1,470.00
Change: +1.72% from the previous close
Intraday Range: ₹1,432.10 – ₹1,471.90
Volume: 2,495,658 shares traded
Market Cap: ₹3.97 trillion
P/E Ratio: 23.39
Beta: 1.04 (indicating moderate volatility relative to the market)
🔎 Key Levels
Resistance:
R1: ₹1,471.90 (recent high)
R2: ₹1,490.00 (next resistance zone)
Support:
S1: ₹1,432.10 (immediate support)
S2: ₹1,400.00 (next support level)
📈 Technical Indicators
RSI (14): 62.15 — Neutral to slightly bullish
MACD: Positive, indicating upward momentum
Moving Averages:
5-period SMA: ₹1,455.00 — Buy signal
50-period SMA: ₹1,440.00 — Buy signal
200-period SMA: ₹1,400.00 — Buy signal
📌 Market Sentiment
Catalysts: Positive momentum following recent gains and analyst upgrades.
Sector Performance: IT sector showing strength, with HCL Technologies leading gains among peers.
Options Activity: Significant trading in call options at ₹1,470 strike price, indicating bullish sentiment.
📅 Outlook
Bullish Scenario: A breakout above ₹1,471.90 could lead to a push toward ₹1,490.00 and higher.
Bearish Scenario: A drop below ₹1,432.10 may test support around ₹1,400.00.
Overall Bias: Moderately bullish, with positive momentum but facing near-term resistance.

BROAD PICTURE OF EIGENHı guys how are u? I assume that you are good after the last rally analysis of EIGEN.
I made this chart not for direction but for possibilities. Green support line is a only assurance of me, under that line it is very hard to take risk for bull season. I believe green direction arrows will work and we will see a huge movements after red resistance zone. for now take care.
I shared this post not because it is a well staged setup but motivation for myself.
So always manage your own risks, My charts are not investment advise

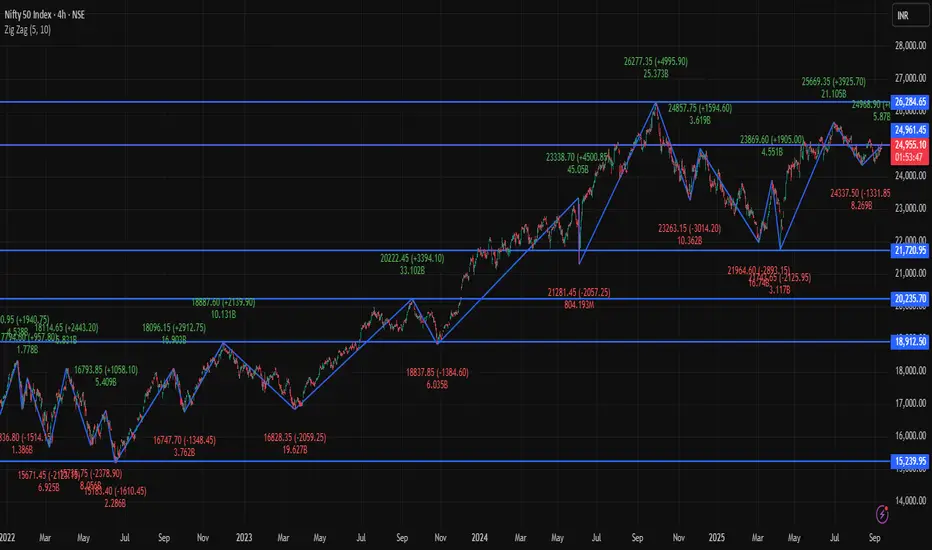
NIFTY 4Hour Time frameNifty Snapshot (10 Sept 2025 – 4-Hour Chart)
Current Level: Around 24,990 – 25,000
Intraday Change: Up about +120 to +130 points (~+0.5%)
Trend: Bullish, with price sustaining near highs
Key Pivot Levels (Daily basis, useful for 4-Hour chart)
Pivot Point: 24,858
Resistance Levels:
R1: 24,902
R2: 24,936
R3: 24,980
Support Levels:
S1: 24,824
S2: 24,780
S3: 24,747
Technical View (4-Hour Frame)
Momentum: Nifty is trading above R3 (24,980), showing strong bullish momentum.
Indicators: RSI is in bullish territory (~65–70), MACD remains positive, and moving averages favor upside.
Bias:
Sustaining above 25,000 can lead to further upside, possibly extending gains.
If Nifty slips back below 24,980, it may retest R2 (24,936) or R1 (24,902).
✅ Conclusion: On the 4-hour timeframe, Nifty remains bullish, currently holding above its resistance zone. This suggests strong intraday and short-term strength, though some consolidation is possible around the 25,000 mark.
Possible Second Entry For Those Who TP Or MissI hope you didnt miss the %16 profit, I warned you.ıf this entry fail I will wait my main support which is labelled as green.White line at the below is a strong support if eigen stay below it, rally is cancelled.
Always manage your own risks this is not a investment advise I am not responsible neither your loss nor profit.

BTC - 150k? BUY?!📊 BTC/USD – Multi-Timeframe Outlook
🔎 Monthly (1M)
Bitcoin has broken out of a bullish wedge pattern and is now consolidating above previous breakout levels.
Long-term structure still favors upside continuation with a target towards 150K if momentum resumes.
Key structural support sits near 76K – 80K (prior breakout zone).
🕰 Weekly (1W)
Clear Elliott Wave count: Wave (3) peaked ~135K, now correcting into Wave (4).
Price retracing into a major support/demand zone around 105K – 110K.
The liquidity trendline from earlier cycles still holds, making this a critical inflection point.
Next move higher (Wave (5)) projects towards 135K – 150K.
⏱ Daily (1D)
Market is testing major support aligned with 0.618 retracement + demand/FVG zone.
Bullish reaction here could ignite the start of Wave (5).
If broken, deeper retracement into the psychological 100K handle may occur before continuation.
⏳ 8H
Short-term bearish momentum pushing into demand.
Liquidity building below, stops resting around 105K – 107K.
A bullish reaction from this zone would confirm Wave (4) completion and set up the impulse higher into Wave (5).
🎯 Trade Plan
Bias: Bullish from demand (Wave 4 → Wave 5)
Entry Zone: 105K – 110K demand region
Targets: 135K short-term, 150K long-term
Invalidation: Clean break & weekly close below 100K

COIN - Are we aligned with BTC/ETH? READY, SET, GO?🕰 Monthly View
Large bullish expansion from demand, with swing structure respected.
Pullback currently rejecting around the 0.618 retracement level.
As long as price holds above the strong support zone near 260–275, bias remains bullish for continuation.
Longer-term targets sit around 400+, with potential re-test of the all-time swing highs later.
📆 Weekly View
Weekly structure shows BOS (break of structure) after expansion.
Price has pulled back into weekly demand (≈275).
Liquidity above 360–380 remains uncollected, suggesting upside targets.
Re-test of supply/liquidity resistance trend likely before continuation higher.
📅 Daily View
Current price hovering around 304 key psychological level (POI).
Retesting breakout zone after liquidity sweep.
Demand alignment (280–300 zone) is crucial: bullish confirmation here opens room for targets at 386–400.
Invalidation if we close below 200 demand zone.
⏱ 4H View
Lower timeframe shows consolidation just above daily demand.
A range return setup is forming, with liquidity built for a possible expansion.
If bulls step in here, expect a sharp impulse move back toward 340–360 short-term.
🎯 Bias & Trade Plan
Bias: Bullish continuation (after retest)
Entry Zone: 280–305 (Daily/Weekly Demand)
Targets:
Short-term → 340–360
Mid-term → 386–400
Invalidation: Break and close below 200
⚠️ Risk Note
COIN tends to move with crypto sentiment (BTC/ETH correlation). Strong volatility expected around psychological levels – wait for rejection/confirmation before entry.

XAUUSD - Daily | More Consolidation??Gold is back in the upper range of this consolidation zone. You can see the high of the range is 3430, and the low is 3240 roughly.
Bulls:
Gold is pulling back into an Inverted FVG. If the price is bullish, then we should clear the gap with ease. Gold has just eliminated 4 days' worth of choppy bearish price action. Look for gold to give clear signs to enter a buy.
**A new daily candle should appear, creating a new FVG showing buyers are winning
Bears:
So with that said... If Gold fails to remain bullish after Friday's (Aug 1st) 700-pip jump, then the iFVG may have the price react bearishly. Watch for gold to give a clear sign of rejection before entering a sell
**Price may drop to cover Friday's gap. Doesn't mean it's bearish

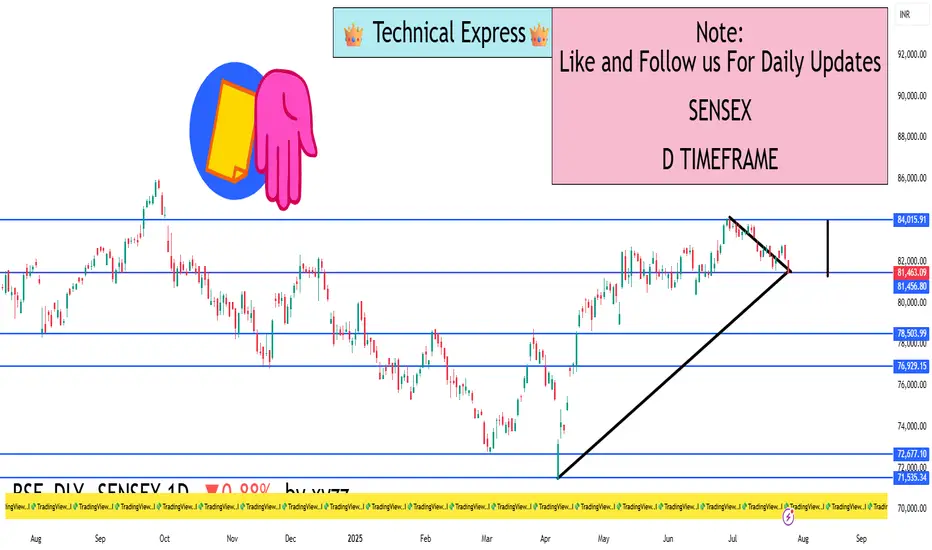
SENSEX 1D Timeframe📉 SENSEX Daily Overview (as of July 25, 2025)
Current Price: Around 81,460
Daily Change: Down by approximately 720 points (–0.9%)
Day’s High: About 82,070
Day’s Low: About 81,400
Previous Close: Around 82,184
📊 1-Day Candlestick Analysis
The candle for today is bearish, indicating strong selling pressure.
The price opened near previous levels but faced resistance at around 82,000.
Sellers dominated most of the day, pushing the index toward the 81,400 support zone.
🔍 Key Support and Resistance Levels
Level Type Price Range
Resistance 82,000 – 82,200
Support 81,400 – 81,000
If Sensex breaks below 81,400, the next target could be around 80,500 or 79,900.
If it holds above support and bounces, it could retest 82,200.
🧠 Technical Trend Analysis
Short-Term Trend: Bearish
Medium-Term Trend: Neutral to mildly bullish (as long as above 80,000)
Market Structure: Lower highs forming, suggesting pressure building on bulls
Indicators (assumed):
RSI may be approaching oversold
MACD likely showing bearish crossover
Volume increasing on red candles—indicating strong sell interest
📌 Sentiment & Market Context
Financial stocks (like banking, NBFCs) are under pressure.
Global cues (such as interest rate uncertainty and geopolitical concerns) are impacting investor confidence.
FII outflows and weak earnings in key sectors are adding to bearish momentum.
The broader trend remains range-bound, but with short-term downside bias.
✅ Strategy Suggestions (For Traders & Investors)
Swing Traders: Wait for a reversal candle (like a bullish engulfing or hammer) before considering long positions.
Breakout Traders: Watch for breakdown below 81,000 for continuation of the fall.
Positional Traders: Can wait to enter near 80,000–79,500 if the market holds that key level.
🔄 Summary
SENSEX is under pressure with a drop of 720+ points.
Technical structure suggests caution, especially if 81,000 breaks.
Support: 81,000 – 80,500
Resistance: 82,000 – 82,200
Locked in – 4H vs 30min Timeframes
When trading high leverage, I need a sharp overview of the market to manage risk and take profits.
Having a parallel view of the 4H and 30min timeframes helps a lot with that.
Right now, on the 30min chart, we’ve had two clean retests of key high timeframe levels :
– the 0.5 Fib
– the weekly 200MA
These retests may justify scaling into a long position , with a stop-loss placed just below the 0.5 Fib or the weekly 200MA.
The structure (MLR > SMA > BB center) supports a long entry, but PSAR hasn’t flipped bullish ye t, so this setup requires caution—especially if price starts closing below these levels. If that happens, it’s better to wait before scaling in .
On the 4H timeframe, selling volume spiked on the last candle , but keep in mind:
→ 3D volume bars have been decreasing , suggesting selling pressure might be weakening overall.
I’ll do my best to keep consistent updates on this parallel timeframe view—it’s proving to be very helpful.
Always take profits and manage risk.
Interaction is welcome.

Raoul Pal's Big Banana. $100 Trillion dollars Crypto market.And how on earth do we reach that point?
Is Raoul's thesis regarding the exponential age accurate, suggesting we have until 2030 to invest and reap the benefits; so "don't F@ck this up!"
As a charting enthusiast, I am eager to see if there exists a technical foundation that could allow us to teleport to those levels and estimate how many years it might take.
Let's examine the entire crypto market, which includes everything from stable coins to tangible real world assets like Gold.
We can distinctly identify three significant consolidation patterns.
Rising wedge #1
a sideways pennant
rising pennant #2
Now, considering this is a logarithmic chart.
It provides us with logarithmic amplitudes and projections.
An amplitude is a calculated move based on the boundaries of the consolidation pattern.
Essentially, it involves taking the top and bottom width and applying it to the breakout point for a rising pattern.
In a #HVF, we utilise the midline of the funnel to forecast targets.
The projections illustrated on this chart pertain to the sideways pennant, employing the flagpole to establish our target.
It is this sideways pennant pole projection that leads us to 100 trillion dollars and beyond. Test it out for yourself if you find it hard to believe these figures could become a reality :)
So there we have it; yes, 100 trillion dollars may appear excessively optimistic and fantastical, especially since we are currently at 3.28 trillion dollars.
However, the charts indicate that Crypto could indeed be the sector where the majority of financial transactions take place in the forthcoming exponential future.

Bitwise Bitcoin ETF | BITB | Long at $46.25It definitely should get everyone's attention when a US Senator (David McCormick) is willing to dish out up to $600,000 in a Bitcoin ETF ( AMEX:BITB ):
Feb. 27: Bought $50,000 to $100,000
Feb. 28: Bought $15,000 to $50,000
March 3: Bought $50,000 to $100,000
March 5: Bought $15,000 to $50,000
March 10: Bought $50,000 to $100,000
March 11: Bought $15,000 to $50,000
March 13: Bought $15,000 to $50,000
March 20: Bought $50,000 to $100,000
Something may be brewing this year with the "U.S. crypto reserve" and I'll throw down a couple grand at $46.25 with a self-proclaimed wild prediction into 2026: Bitcoin to $120,000.
Bitwise ETF Targets:
$50.00
$55.00
$60.00
$65.00

Ethereum 200 Weekly SMAEthereum interestingly is supported fairly well by the 200 Weekly SMA
You could say any good investment if it goes below that type of line is a deal for sure. The farther away it is above the line its more over priced. Things can be a good distance away and still be a good deal but the fact that Ethereum is literally touching it in last two weeks means we need to pay attention. We might not see the same percentage gain as before away from that line later in year 2025 but it was a high raise between 500 to 800 percent above that line in 2021. Which is between 12k and 19k right now.

Ethereum on the Rise, Poised for a Bullish BreakoutBINANCE:ETHUSDT has been showing strong recovery patterns recently, and the technical indicators align with a potential bullish move in the coming months. On the weekly chart, COINBASE:ETHUSD has reached the bottom of an ascending channel, which historically has acted as a strong support zone. This $2K region is not only a psychological barrier but also a key support level that was previously a resistance. As ETH continues to hold above this zone, a rise toward its all-time high (ATH) becomes increasingly probable.
Recent data suggests that 2024 could witness a broader crypto bull run, driven by Ethereum and other major assets. Analysts are optimistic about increased adoption cycles following 2023’s groundwork. Ethereum could benefit from market-wide positive sentiment as key events like Bitcoin’s upcoming halving and ETF inflows are expected to drive demand for cryptocurrencies.
With the technical alignment and favorable market conditions, ETH is well-positioned to see significant growth, potentially targeting levels near EUROTLX:4K as it continues its rise within the ascending channel. This rally could be bolstered by investor confidence in the broader cryptocurrency market as new financial products and solutions drive further participation.

#KOALA AI #KOKO artificial intelligence KOALA AII think it's worth packing a little surprise bag for myself for 2025. Horizontal yellow shaded levels are buy zones. Invalidations are multiple daily closing candles below the horizontal blue box. Targets are the red price tags above. tp: 1.2.3. It is not investment advice, it is everyone's own decision.

ZIL (Zilliqa) Extreme Bullish, Huge move soon🚀 Monster upward move by ZIL!🚀
On Fib Retracement ZIL is halfway until reaching the key level of 23.60% ($0.069) by breaking above the resistance line.
The pattern of the support and the resistance lines suggests that ZIL may make moon moves and test its peak at $0.259!
Key levels to break out during the run:
0.036 0.052 0.067 0.131
There are new updates, bridges, sponsorships and marketing incoming in the next two months!
🚀 🚀 🚀 🚀 🚀 🚀 🚀 🚀 🚀 🚀 🚀

Upcoming Economic Events: A Weekly OverviewUpcoming Economic Events: A Weekly Overview
The coming week promises to be packed with significant economic events and data releases, likely to influence global markets and investor sentiment. Here's a detailed day-by-day preview of the most critical events.
---
**Sunday**
- **Australia**: Judo Bank Manufacturing PMI Final for November.
The week kicks off with insights into Australia's manufacturing sector, potentially setting the tone for global economic trends.
---
**Monday**
- **Japan**: Jibun Bank Manufacturing PMI Final for November.
- **China**: Caixin Manufacturing PMI for November.
- **Eurozone**: HCOB Manufacturing PMI Final for November and Unemployment Rate for October.
- **USA**: ISM Manufacturing PMI and ISM Manufacturing Employment for November.
A day focused on manufacturing data from key global economies. The ISM Manufacturing PMI from the US will be particularly crucial for dollar strength and equity market reactions.
---
**Tuesday**
- **USA**: JOLTs Job Openings for October.
- **Australia**: Judo Bank Services PMI Final for November.
US job openings will be a focal point, providing further insights into the labor market's robustness and potential implications for Fed policy.
---
**Wednesday**
- **Australia**: GDP Growth Rate (QoQ) for Q3.
- **Eurozone**: HCOB Services PMI Final for November.
- **USA**: ADP Employment Change for November, ISM Services PMI, Factory Orders (MoM) for October, and Fed Chair Jerome Powell’s Speech.
One of the week's busiest days. Markets will closely watch US employment and services data, along with Powell's speech, which could offer clues about the Fed's policy direction.
---
**Thursday**
- **Australia**: Balance of Trade for October.
- **Japan**: BOJ Nakamura Speech.
- **Germany**: Factory Orders (MoM) for October.
- **UK**: S&P Global Construction PMI for November.
- **Eurozone**: Retail Sales (MoM) for October.
- **Canada**: Balance of Trade for October, Ivey PMI (s.a) for November.
- **USA**: Balance of Trade for October, Initial Jobless Claims (Nov 30).
A day dominated by trade data and insights into economic activity in major economies.
---
**Friday**
- **Germany**: Industrial Production (MoM) for October.
- **UK**: Halifax House Price Index (YoY) for November.
- **Eurozone**: GDP Growth Rate (3rd estimate) for Q3.
- **Canada**: Unemployment Rate for November.
- **USA**: Non-Farm Payrolls, Unemployment Rate for November, and Preliminary Michigan Consumer Sentiment for December.
The US Non-Farm Payrolls release is a highlight of the week and a key indicator for Fed policy decisions. Combined with unemployment data, it will shape expectations for monetary policy going forward.
---
Summary
The upcoming week is rich in macroeconomic data, spanning sectors from manufacturing to services and labor markets. Key focus areas include US ISM and NFP data, Fed Chair Powell’s speech, and GDP and trade data from major economies. This is a crucial time to stay vigilant in markets and adjust investment strategies based on emerging trends and market reactions.
