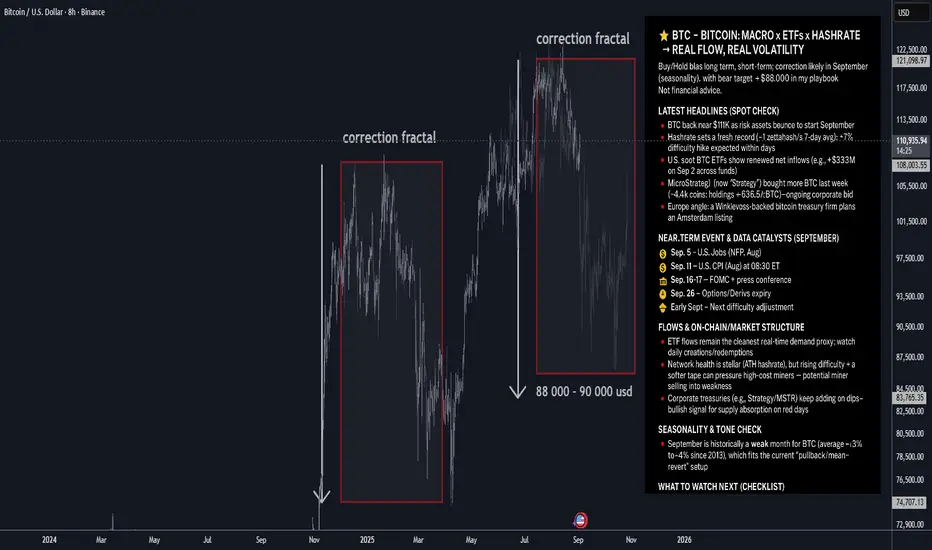
BTC — Bitcoin: Macro x ETFs x Hashrate → Real Flow, Real Volatil⭐️ BTC — Bitcoin: Macro x ETFs x Hashrate → Real Flow, Real Volatility
Buy/Hold bias long term; short-term: correction likely in September (seasonality), with bear target ≈ $88,000 in my playbook.
🔥 Latest headlines (spot check)
🔸BTC back near $111K as risk assets bounce to start September.
🔸Hashrate sets a fresh record (~1 zettahash/s 7-day avg); a >7% difficulty hike is expected within days. Network is the strongest ever, but miner margins tighten.
🔸U.S. spot BTC ETFs show renewed net inflows (e.g., +$333M on Sep 2 across funds). Flows remain a key daily demand gauge.
🔸MicroStrategy (now “Strategy”) bought more BTC last week (~4,4k coins; holdings ≈ 636.5k BTC)—ongoing corporate bid.
🔸Europe angle: a Winklevoss-backed bitcoin treasury firm plans an Amsterdam listing, signaling appetite for listed BTC exposure in the EU.
🗓 Near-term event & data catalysts (September)
🔸Fri, Sep 5 — U.S. Jobs (NFP, Aug) at 08:30 ET. Labor softness would bolster rate-cut odds and risk appetite; a beat could do the opposite.
🔸Wed, Sep 11 — U.S. CPI (Aug) at 08:30 ET. Inflation surprise drives real-rate expectations → BTC beta.
🔸Tue–Wed, Sep 16–17 — FOMC + press conference. Policy path & dot plot = macro volatility for BTC.
Fri, Sep 26 — Options/Derivs expiry:
• Deribit monthly BTC options expire 08:00 UTC (last Friday rule).
• CME Bitcoin monthly options settle Sep 26 as well.
These expiries often amplify gamma flows and spot-vol.
Early Sept — Next difficulty adjustment likely >7% up (tightens miner economics short-term).
Medium-dated overhang
Mt. Gox creditor deadline: Oct 31, 2025. Any schedule/details update could swing “supply overhang” narratives.
📈 Flows & on-chain/market structure
🔸ETF flows remain the cleanest real-time demand proxy; watch daily creations/redemptions. 🔸Sustained positives tend to align with spot strength; outsized outflows can weigh on price.
🔸Network health is stellar (ATH hashrate), but rising difficulty + a softer tape can pressure high-cost miners → potential miner selling into weakness.
🔸Corporate treasuries (e.g., Strategy/MSTR) keep adding on dips—bullish signal for supply absorption on red days.
🧠 Seasonality & tone check
September is historically a weak month for BTC (average ~−3% to −4% since 2013), which fits the current “pullback/mean-revert” setup.
📣 Social/flow buzz (signals, not noise)
🔸ETF flow posts (Farside, Bloomberg desks) are getting traction again—watch after U.S. close for prints.
🔸Saylor/Strategy buying headlines keep the “corporate bid” narrative front-and-center.
🧭 Levels & plan (author’s framework)
🔸Bias: Long-term constructive; near-term: correction mode likely extends through September (seasonality + event risk).
🔸Bear target: $88,000 (where I’d expect volatility to attract responsive buyers).
🔸Invalidation for bears (tactical): A strong reclaim/close above ~$113K–$115K with improving 🔸ETF inflows would weaken the pullback thesis.
🔸Sizing: Respect macro data days (NFP/CPI/Fed) and options expiry week—expect higher realized vol.
🗺 What to watch next (checklist)
🔸Daily U.S. spot BTC ETF flows (post-close updates). Momentum if creations persist; caution on redemptions clusters.
🔸Sep 5 — NFP (Aug) 08:30 ET. Risk-on if soft; risk-off if hot.
🔸Sep 11 — CPI (Aug) 08:30 ET. Headline/core surprises steer the FOMC tone.
🔸Sep 16–17 — FOMC + presser. Watch guidance on cuts, balance sheet, and growth.
🔸Sep 26 — Deribit & CME monthly expiries. Positioning/“max pain” dynamics into that Friday.
Difficulty adjustment (early Sept). If >7% up as projected, monitor miner behavior/sell pressure.
D-ETH
Bearish continuation?Ethereum (ETH/USD) is rising towards the pivot which has been identified as a pullback resistance and could reverse to the 1st support.
Pivot: 4,410.37
1st Support: 4,212.04
1st Resistance: 4,502.93
Risk Warning:
Trading Forex and CFDs carries a high level of risk to your capital and you should only trade with money you can afford to lose. Trading Forex and CFDs may not be suitable for all investors, so please ensure that you fully understand the risks involved and seek independent advice if necessary.
Disclaimer:
The above opinions given constitute general market commentary, and do not constitute the opinion or advice of IC Markets or any form of personal or investment advice.
Any opinions, news, research, analyses, prices, other information, or links to third-party sites contained on this website are provided on an "as-is" basis, are intended only to be informative, is not an advice nor a recommendation, nor research, or a record of our trading prices, or an offer of, or solicitation for a transaction in any financial instrument and thus should not be treated as such. The information provided does not involve any specific investment objectives, financial situation and needs of any specific person who may receive it. Please be aware, that past performance is not a reliable indicator of future performance and/or results. Past Performance or Forward-looking scenarios based upon the reasonable beliefs of the third-party provider are not a guarantee of future performance. Actual results may differ materially from those anticipated in forward-looking or past performance statements. IC Markets makes no representation or warranty and assumes no liability as to the accuracy or completeness of the information provided, nor any loss arising from any investment based on a recommendation, forecast or any information supplied by any third-party.

ETH - Can it break 4300?The probable moves as shown here is something to be taken care off, just breaks red, makes the pattern no longer work

ethereum bullishThose who say Ethereum is dead with every drop will witness the demise of bears with every rise.

ETHUSDTI think moved trend by break 4485$ resistance and 4250$ support in BINANCE:ETHUSDT .
Support: 4250 - 3900 - 3510
Resistance: 4485 - 4720 - 5000
Please control risk management.

ethereum move missed Ethereum is showing signs of exhaustion after a sharp rally to $4,300. This setup highlights a potential retracement zone between $4,150–$3,980, backed by bearish divergence on RSI and weakening volume. If price breaks below the rising trendline, we could see a short-term correction before the next leg up. Watching for confirmation around key support levels. Trade with caution—volatility is high."
🔍 Tips to make it pop on TradingView:
- Include bias (bullish/bearish/neutral)
- Mention entry, exit, and invalidation zones
- Use at least two confluences (e.g., RSI + trendline)
- Keep it clear, concise, and jargon-free
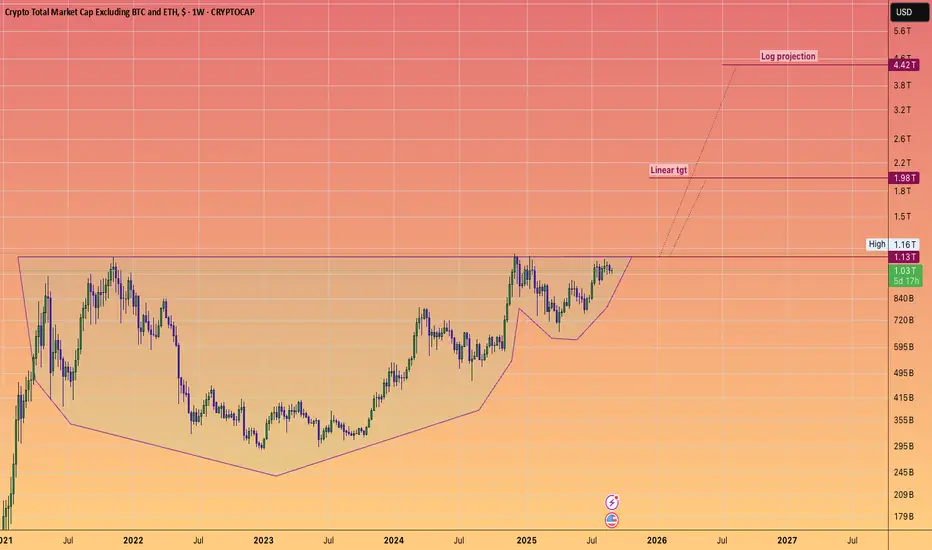
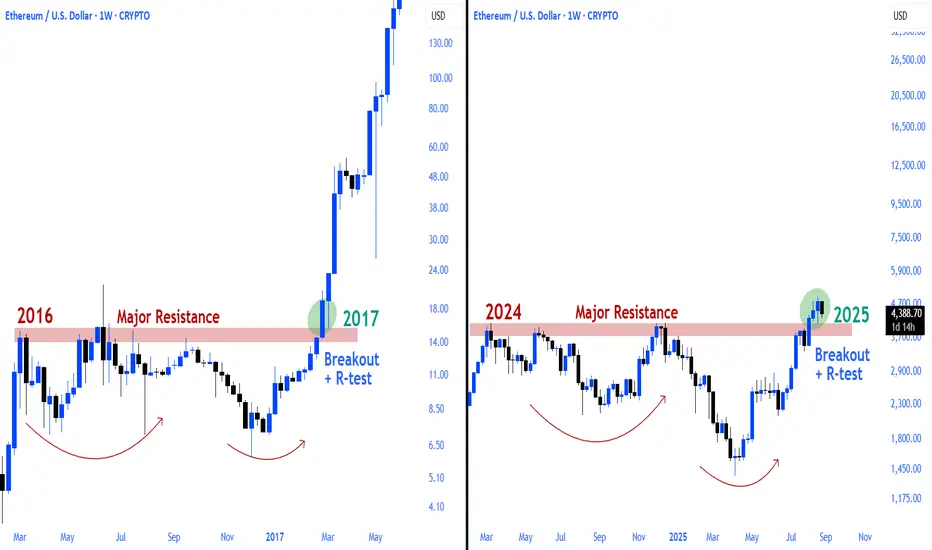
***REMINDER*** of the TOTAL 3 Targets.We are on the cusp of price discovery in many key assets that will contribute to the upcoming alt season.
The Russell 2000 #RTY is close to all time highs..
#GOLD is charging ahead which often pulls up ~BTC
#ETHEREUM hit a new all time already and retraced ... so the next break above will likely see price discovery and vacuum price action to fib extension around $7.5k
#BTCd dominance has topped.
This cup and handle for Total 3 has been a long time in the making which suggests a powerful move is likely to occur.
AMD (2025+) Catalysts & Risks: 300 USD PT Bulls🟥 AMD (2025+) Catalysts & Risks: Analyst Views
________________________________________
🔑 Key Catalysts Driving AMD’s Stock Growth (2025+)
🌌 Quantum-Centric Supercomputing with IBM
AMD’s collaboration with IBM to merge CPUs/GPUs with quantum computing promises a whole new class of hybrid architectures. If successful, this could unlock brand-new compute markets in research, defense, and enterprise.
Impact Score: 9.5/10
🏗️ Hyperscaler Traction & Data-Center GPU Gains
AMD’s MI355 and upcoming MI400 accelerators are gaining traction with big cloud players. Even a modest 10% market share in AI GPUs would be transformative for AMD’s revenue mix.
Impact Score: 9/10
📈 Analyst Upgrades & Bullish Price Targets
Wall Street has turned bullish—multiple PT hikes point to 20–40% upside. Analyst enthusiasm often accelerates institutional inflows, reinforcing AMD’s momentum.
Impact Score: 7.5/10
🌍 Global AI Accelerator Growth & Middle East Expansion
AMD is securing multi-billion sovereign AI infrastructure deals in the Gulf (Saudi, UAE). These large-scale contracts validate AMD’s credibility as a true Nvidia alternative.
Impact Score: 8.5/10
💰 Strong Financial Performance & Executive Optimism
Q1 results crushed expectations with revenue and profit growth across data center and AI. Sustained beats strengthen AMD’s credibility and support multiple expansion.
Impact Score: 8/10
🔗 Broad Ecosystem & Strategic Acquisitions
Acquisitions like Xilinx and Silo AI give AMD a richer portfolio spanning FPGAs, AI software, and custom servers (Helios). This positions AMD as more than just a chipmaker—an AI infrastructure player.
Impact Score: 7/10
________________________________________
⚠️ Key Negative Drivers & Risks
🇨🇳 China Export Restrictions
AMD is losing access to a massive end market due to US export rules. This already shaved off ~$1B in projected sales and could worsen with future policy shifts.
Risk Severity: 9/10
📉 Under-whelming AI GPU Sell-In
Past misses on data-center GPU sales remind investors that adoption is not guaranteed. If hyperscalers hesitate, AMD’s AI growth story could stall.
Risk Severity: 7.5/10
💸 Valuation & Excess Rally Risks
Shares are up massively YTD—if results don’t keep pace, profit-taking could spark sharp pullbacks.
Risk Severity: 7/10
⚡ Short-Term Volatility & Earnings Reaction
Even with growth, near-term misses or cautious guidance could swing the stock hard.
Risk Severity: 6.5/10
🥊 Competitive Pressure
Nvidia’s CUDA ecosystem remains deeply entrenched, while custom silicon from hyperscalers (Google TPUs, AWS Trainium) eats into the TAM. AMD is fighting uphill.
Risk Severity: 8/10
________________________________________
📝 Summary Outlook (Sept 2025)
AMD is no longer the underdog—it’s becoming a legitimate AI infrastructure contender. The IBM quantum partnership and hyperscaler adoption of MI400 GPUs could be game-changers. Sovereign AI deals in the Middle East and ecosystem-expanding acquisitions amplify the story.
But execution risk is high—China export bans, entrenched Nvidia dominance, and valuation stretch leave little room for error. Success hinges on AMD proving it can scale its AI GPUs and secure recurring demand.
Rank Catalyst 🚀 Score (0–10)
1⃣ 🌌 Quantum-Centric Supercomputing with IBM 9.5
2⃣ 🏗️ Hyperscaler GPU Adoption (MI355/MI400) 9
3⃣ 🌍 Middle East AI Mega Deals 8.5
4⃣ 💰 Strong Financial Growth 8
5⃣ 📈 Analyst Upgrades & PT Revisions 7.5
6⃣ 🔗 Ecosystem & Acquisitions (Xilinx, Silo AI, Helios) 7

ETH 1H Analysis – Key Triggers Ahead | Day 9💀 Hey , how's it going ? Come over here — Satoshi got something for you !
⏰ We’re analyzing ETH on the 1-hour timeframe timeframe .
🔭 On the 1-hour timeframe of Ethereum, we can see that after being rejected from the \$4500 alert zone, Ethereum moved downward and formed short-term support at the \$4371 area. If this level is broken, Ethereum could experience a deeper correction in the multi-timeframe view.
⛏ The key RSI levels are at 58 and 39. Once the oscillator crosses these levels, Ethereum can start its move.
💰 The size and number of Ethereum’s red candles are significantly greater than the green ones, and if this support is lost, Ethereum could move further downward into selling pressure.
🪙 On the 1-hour ETHBTC timeframe, we can see that after activating the short alert zone and receiving confirmation for a sell trade, Ethereum is moving downward. It has support at the 0.03996 level, which coincides with the 30 RSI zone or the OverSell boundary.
🔔 The alert zones considered for Ethereum are the \$4371 area and the \$4500 area. Based on price action in these zones, we can find the best trade opportunities. With further decline of ETH against Bitcoin, reduced volatility, and price leaning toward selling, we may see a deeper correction.
❤️ Disclaimer : This analysis is purely based on my personal opinion and I only trade if the stated triggers are activated .

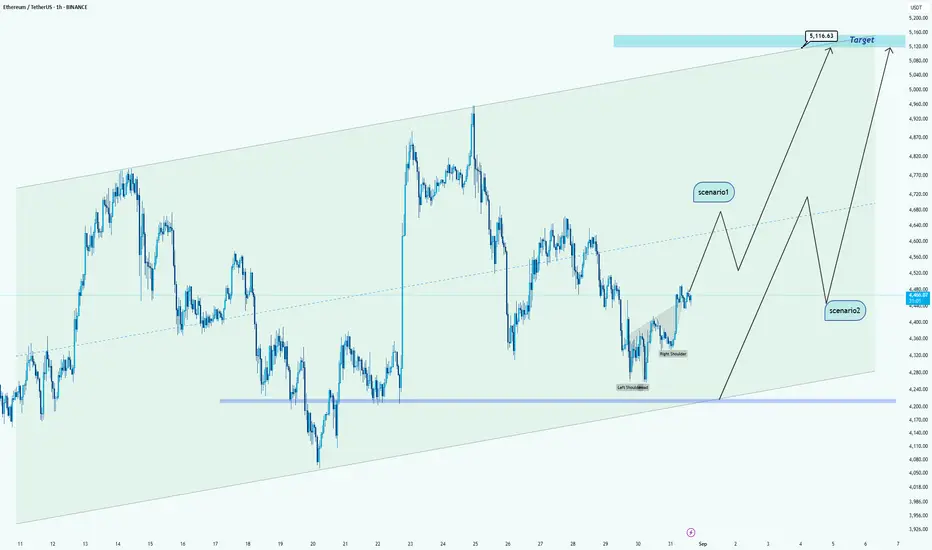
ETH/USDT Analysis -> towards upper levelsHello guys!
Currently, Ethereum is trading inside a clear ascending channel and has just formed a potential inverse head & shoulders pattern near the channel’s support. This setup gives us two possible scenarios:
🔹 Scenario 1:
If ETH continues its bullish momentum and breaks above the mid-line of the channel, we could see a strong push toward $5,116, which is also aligned with the channel’s upper boundary.
🔹 Scenario 2:
If ETH fails to hold above the current levels, we may first see a retracement back toward the $4,200 – $4,250 support zone (channel bottom). From there, the price can gather momentum and still aim for the $5,116 target in the bigger picture.
Conclusion:
Both scenarios point toward a bullish bias in the mid-term. The difference lies in whether we get a direct rally (Scenario 1) or a deeper correction before continuation (Scenario 2).
1:2 RR SELL Trade on Ethereum NOW📉 Ethereum (ETH/USD) – 1:2 RR Sell Trade Setup
You're executing a sharp short trade on Ethereum with a clean 1:2 risk-to-reward ratio. Here's a crisp TradingView idea description:
🔻 Trade Snapshot
- Bias: Bearish momentum
- Entry: Near recent resistance or breakdown level
- Stop Loss: Above key structure or wick rejection
- Target: 2x the risk, aligned with next support zone or Fibonacci level
- Confirmation: Bearish engulfing, RSI divergence, or MACD crossover
💬 "ETH showing signs of exhaustion—perfect setup for a disciplined 1:2 RR short. Tight stop, clear target, and momentum on our side."

ETH/USDT (4H) 1. Trend
• The price is in the downward channel (designated orange lines).
• The last candle tests the lower restriction of the channel → Possible reflections or breaking down.
2. Horizers of support and resistance
• resistance (green lines):
• 4,440 USDT
• 4,382 USDT
• Support (red lines):
• 4,268 USDT (currently tested)
• 4,247 USDT
• 4,176 USDT
• 4 090 USDT (stronger support)
If 4,268 is pierced and maintained below, a further exit can be around 4 176–4 090.
3. RSI (Relative Strength Index)
• Currently RSI oscillates below 50 → Bear advantage.
• There is still a strong sale signal (<30), so theoretically there is still a space to decline.
4. Chop (Choppiness Index)
• The indicator shows a fairly "jagged" market → no strong trend, but from the current context of more bear pressure.
⸻
📊 Scenarios:
• Bull (reflection): If the price stays above 4 268 and reflects from the bottom line of the channel → possible traffic towards 4 382 and 4 440.
• Bear (continuation of declines): closing the candle 4h below 4,268 → a signal for further drop to 4 176 and even 4 090.

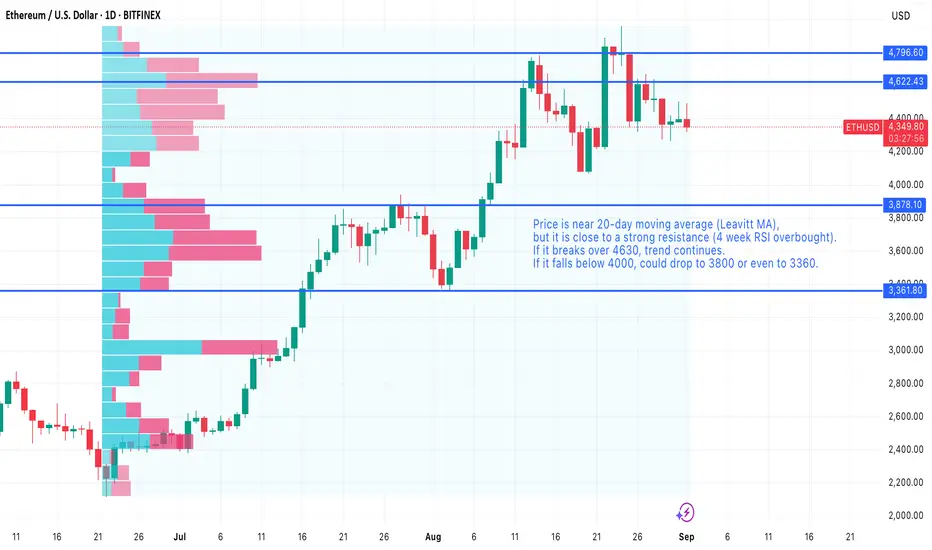
Break or Bust — ETH betwen Support vs. Overbought 4‑WeekETH sitting at the 20‑day Leavitt MA while hitting strong resistance — overbought of 4‑week RSI.
If price breaks and closes above $4,630, trend continuation is likely.
If price breaks below $4,000, expect a drop toward $3,800 and possibly $3,360.
Technical notes:
Use the 20‑day Leavitt MA as your short‑term trend anchor.
Watch for a confirmed daily close above $4,630 to signal continuation (entry on retest or momentum breakout).
A daily close below $4,000 invalidates the bullish case; targets: $3,800 then $3,360 (scale stops and size accordingly).
Manage risk with stops outside breakout levels and position sizing for potential volatility.
ETH Market Update📊 ETH Market Update
ETH has formed a trading pattern and is now testing the blue support zone 🔵
👉 This is a critical level — a breakout is coming soon, but the question is: up or down?
⚠️ If CRYPTOCAP:ETH breaks below the blue support, sellers could take control and push price lower.
⚡ If CRYPTOCAP:ETH holds support and buyers step in, we could see a bounce and bullish continuation.
👉 Key takeaway: Wait for clear confirmation before entering — the next breakout will define the trend direction.

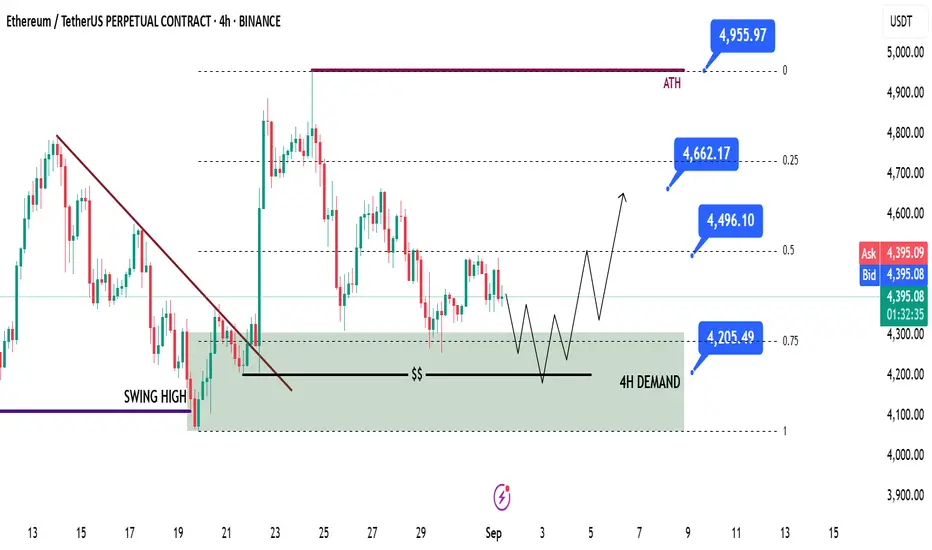
ETH Swing Long IdeaETH Swing Long Idea
📊 Market Sentiment
Overall sentiment remains bullish, supported by expectations of a 0.25% rate cut in the upcoming FOMC meeting. A weakening USD and improving global risk appetite are creating favorable conditions for further upside in crypto assets.
📈 Technical Analysis
Price tapped into the prior swing high and rejected from that level.
This move created a 4H Demand Zone, which I expect to hold.
Additionally, price reacted from the 0.75 range maximum discount zone and is currently bouncing.
📌 Game Plan
I will be looking for price to run liquidity at $4205 before a potential expansion higher.
This level also aligns with the maximum range discount zone.
🎯 Setup Trigger
I will wait for a 4H Break of Structure (BOS) before entering a trade, with LTF confirmation for precision.
📋 Trade Management
Stoploss: 4H swing low confirming the BOS
Targets:
• TP1: $4500
• TP2: $4650
• TP3: $5000 (All-Time Highs)
💬 Like, follow, and comment if you find this setup valuable!
⚠️ Disclaimer: This content is for informational and educational purposes only and does not constitute financial, investment, or trading advice. Always do your own research before making any financial decisions.
ETH Warrning !!!BINANCE:ETHUSDT The Ethereum is forming an expanding triangle + stochastic divergance.
Best wishes to you all
Markets Titan

ETH's Situation, A Comprehensive Analysis !!!As discussed in the previous analysis, the price has finally broken the wedge, and now, with a slight pullback, it could reach above $5k.
PREVIOUS ANALYSIS

01/09/25 Weekly OutlookLast weeks high: $113,692.97
Last weeks low: $107,357.75
Midpoint: $110,525.36
Despite continuing the short term bearish trend, BTC saw a net inflow of $441m via ETFs last week and $1.08B for Ethereum ETFs. Continuing high demand has capped this drawdown for now at weekly low (~$107,500) with three separate drives into the level and a bounce each time there is a clear line in the sand to monitor this week, for now it is advantage bulls.
In terms of data releases there isn't much big news on the way apart from Unemployment data later in the week. I don't expect this data to influence the decision to cut interest rates later this month, as it stands a cut is going to happen. We've just started a new month and so as always bigger players who de-risked for month end can begin deploying capital once again during a period that will be pricing in a rate cut. These factors look good for the bulls after a 14% drawdown from ATHs, could the local low be in?
For me I'm still mindful of the previous poor performances each year around September, the difference being this time a rate cut is on the way which changes the dynamics slightly. IF Bitcoin were to retest the $100k mark the R:R on a long there would be huge, a -20% move down, quite normal in bull market situations.
IF the 0.25 line (~$109,000) hold/reclaim a LTF change in structure would be bullish with an invalidation below weekly low. The target from there would be weekly high for the bulls.

ETH/USDTSimilar to BTC, September isn’t historically the strongest month. For further upside, we’d like to see liquidity taken in the 4000–3355 zone.
Long setups only after clear confirmation.

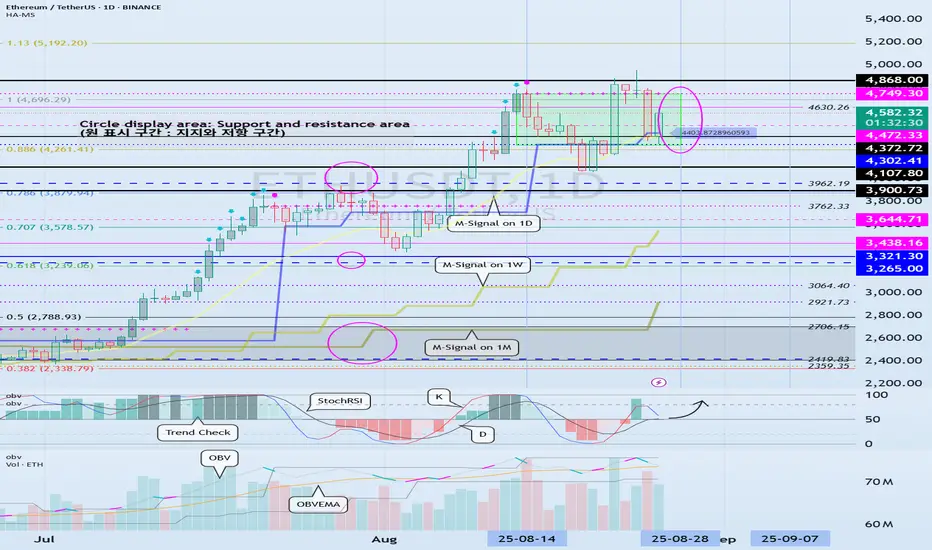
Volatility Period: Around August 28 (August 27-29)
Hello, fellow traders!
Follow us to get the latest information quickly.
Have a great day!
-------------------------------------
(ETHUSDT 1D chart)
It's rising, with support near 4372.72.
However, since the TC (Trend Check) indicator is at 0, it's unclear where the price will bounce.
Therefore, we need to determine whether support is found around 4630.26 or whether the price falls below 4472.33.
This period of volatility is expected to last from August 27th to 29th.
-
To initiate a cascading upward trend, support must be found around 4749.30.
-
Thank you for reading to the end.
I wish you successful trading.
--------------------------------------------------
- This is an explanation of the big picture.
(3-year bull market, 1-year bear market pattern)
I will explain in more detail when the bear market begins.
------------------------------------------------------
Bearish Reversal?Ethereum (ETH/USD) is rising towards the pivot and could drop to the 1st support that aligns with the 161.8% Fibonacci extension.
Pivot: 4,862.36
1st Support: 3,853.80
1st Resistance: 5,225.73
Risk Warning:
Trading Forex and CFDs carries a high level of risk to your capital and you should only trade with money you can afford to lose. Trading Forex and CFDs may not be suitable for all investors, so please ensure that you fully understand the risks involved and seek independent advice if necessary.
Disclaimer:
The above opinions given constitute general market commentary, and do not constitute the opinion or advice of IC Markets or any form of personal or investment advice.
Any opinions, news, research, analyses, prices, other information, or links to third-party sites contained on this website are provided on an "as-is" basis, are intended only to be informative, is not an advice nor a recommendation, nor research, or a record of our trading prices, or an offer of, or solicitation for a transaction in any financial instrument and thus should not be treated as such. The information provided does not involve any specific investment objectives, financial situation and needs of any specific person who may receive it. Please be aware, that past performance is not a reliable indicator of future performance and/or results. Past Performance or Forward-looking scenarios based upon the reasonable beliefs of the third-party provider are not a guarantee of future performance. Actual results may differ materially from those anticipated in forward-looking or past performance statements. IC Markets makes no representation or warranty and assumes no liability as to the accuracy or completeness of the information provided, nor any loss arising from any investment based on a recommendation, forecast or any information supplied by any third-party.

XRP | Looking for All-Time HighsXRP | Looking for All-Time Highs
📊 Market Sentiment
Overall sentiment remains bullish, supported by expectations of a 0.25% rate cut in the upcoming FOMC meeting. A weakening USD and increasing global risk appetite are creating favorable conditions for further upside in crypto assets.
📈 Technical Analysis
Price ran liquidity at $2.81 and closed above with a strong reaction.
A 4H demand zone formed after the break of structure, and price found support there.
Currently, price is moving towards the bearish trendline.
If price breaks and closes above this bearish trendline, I will be looking for long entries targeting new highs.
📌 Game Plan
I will wait for price to break and close above the bearish trendline.
Then, I will look for a retest and bounce slightly below or at the trendline before entering.
🎯 Setup Trigger
A 1H market structure shift will be my confirmation for entry.
📋 Trade Management
Stoploss: 1H swing low confirming the BOS
Targets: TP1: $3.14 | TP2: $3.38
💬 Like, follow, and comment if you find this setup valuable!
⚠️ Disclaimer: This content is for informational and educational purposes only and does not constitute financial, investment, or trading advice. Always do your own research before making any financial decisions.
