XRP | Looking for All-Time HighsXRP | Looking for All-Time Highs
📊 Market Sentiment
Overall sentiment remains bullish, supported by expectations of a 0.25% rate cut in the upcoming FOMC meeting. A weakening USD and increasing global risk appetite are creating favorable conditions for further upside in crypto assets.
📈 Technical Analysis
Price ran liquidity at $2.81 and closed above with a strong reaction.
A 4H demand zone formed after the break of structure, and price found support there.
Currently, price is moving towards the bearish trendline.
If price breaks and closes above this bearish trendline, I will be looking for long entries targeting new highs.
📌 Game Plan
I will wait for price to break and close above the bearish trendline.
Then, I will look for a retest and bounce slightly below or at the trendline before entering.
🎯 Setup Trigger
A 1H market structure shift will be my confirmation for entry.
📋 Trade Management
Stoploss: 1H swing low confirming the BOS
Targets: TP1: $3.14 | TP2: $3.38
💬 Like, follow, and comment if you find this setup valuable!
⚠️ Disclaimer: This content is for informational and educational purposes only and does not constitute financial, investment, or trading advice. Always do your own research before making any financial decisions.
D-ETH

BRIEFING Week #35 : Monthly forecast for Q4Here's your weekly update ! Brought to you each weekend with years of track-record history..
Don't forget to hit the like/follow button if you feel like this post deserves it ;)
That's the best way to support me and help pushing this content to other users.
Kindly,
Phil

ETH 1H Analysis – Key Triggers Ahead | Day 8💀 Hey , how's it going ? Come over here — Satoshi got something for you !
⏰ We’re analyzing ETH on the 4-hour timeframe timeframe .
🔭 On the 1-hour timeframe of Ethereum, we can see that after a correction, Ethereum was supported at the $4263 area and moved upward. It had a resistance at the $4341 level which, after breaking and completing a pullback, pushed towards its next higher resistance. Currently, it is in a 1-hour or 15-minute multi-timeframe range, and with a breakout from this pattern, it can give us a trade opportunity.
⛏ Key RSI levels are at 70 and 55. If the fluctuation limit crosses these numbers, Ethereum can have significant volatility and start a new trend.
💰 The volume and number of green candles have increased, and their size also looks bigger. This can be a sign of Ethereum’s bias, showing that buyers are more willing to spend money compared to sellers. The volume and number of red candles have decreased, and they don’t create much selling pressure, although the market is currently in a holiday period.
🪙🪙 On the 1-hour ETHBTC timeframe, after breaking out of its box, Ethereum moved upward and also had a pullback to this box. Now there is resistance at the 0.04145 area, and with a breakout of this level, Ethereum can continue moving upward.
🔔 The alert zones considered for Ethereum are $4433, which is at the bottom of this range as the short alert zone, and $4490, which is at the top of this range as the long alert zone. With a breakout and confirmation above these levels, Ethereum can start its move in the new week. Note that this pattern has strong price action significance, and Ethereum’s monthly candle will also close tonight.
❤️ Disclaimer : This analysis is purely based on my personal opinion and I only trade if the stated triggers are activated .
Ethereum Analysis (4H)It seems the price is not yet ready for a strong rejection to the downside, and buyers still hold strength. It is expected that, with the interaction or liquidity hunt that previously triggered a strong upward move, we may see another bullish wave. This move would both reinforce a bullish sentiment in the market and allow major players’ orders to be filled.
For a rejection to occur, it will either happen from the premium zone of the previous wave, or a new all-time high might form.
Let’s see how the market reacts to the highlighted red zone.
For risk management, please don't forget stop loss and capital management
When we reach the first target, save some profit and then change the stop to entry
Comment if you have any questions
Thank You

Ethereum’s Epic Climb: $10,000+ by Year-End 2025!New data and discoveries have come in, so my prediction for ETH has changed.
Back in March 2025, I saw this ETH pattern forming:
So far, everything is playing out as expected, but I believe the timeline has shifted to sometime at the end of December 2025.
We have one major liquidation event to play out before this happens in September, and I would not be surprised if we get a pullback to $3,500 before liftoff.
Bitcoin will most likely go down to $92,000 to close the CME gap:
You can check that out above, and when that happens, ETH should bottom out somewhere around $3,500.
The next major time Fibonacci will be on October 10th, 2025; this is most likely when we get the breakout. Until then, a massive trap is forming.
Ascending triangles are the name of the game in a bull market, especially with ETH:
As long as we keep putting in lower highs into ascending triangles, we are good to go higher; anything else is noise.
Invalidation for this thesis is simple: we close a weekly candle under the orange support, and chances are very high that we are done.
All I think is happening here is preparation for a massive bear trap, flushing out all the late leverage, as they always do. This is just a rite of passage before a major rally ensues.

Eth - Support and resistance & take profit targetsSupport and resistance & take profit targets.
May the trends be with you.

ETHUSDTI wait for come to 4200$ price that to me give best the position long.
EN: 4100 to 1200
SL: 3990
TP: 4400 - 4500 - 4700

Ether Still Bullish · We Are Going Up!Good morning my fellow trader, I hope you are having a wonderful Saturday.
Consider this Ether chart again; price action is still happening within the "still bullish" price zone. This is a range that I mapped on the chart as a "pause," a price range for a small break before more rising prices... Come on! We've seen this before.
May-July! The sideways period was even longer than this one and we had not conquered $4,000 nor a new ATH, yet, you remained strong. It is the same all over again.
When we initially extracted the numbers for this bull market, long ago, $4,000 nor $5,000 was ever the goal. We were aiming at a minimum of $6,000, $7,000 or even beyond. If we do good $8,513 it was said. If the bull market is extraordinary, you can see Ether trading at more than 10K.
All these possibilities remain open, all these scenarios but one; it is not the end. Ethereum will not stop growing in 2025 after hitting just under $5K. It will go much higher, we are still bullish; the best is yet to come. Patience is key.
The market is loading up but at the same time we have so much proof that the current chart is an easy hold. Actually, you can buy and go LONG at this point. Why? Because Ether is trading at support. Sell at resistance, buy at support.
We are going up.
Namaste.

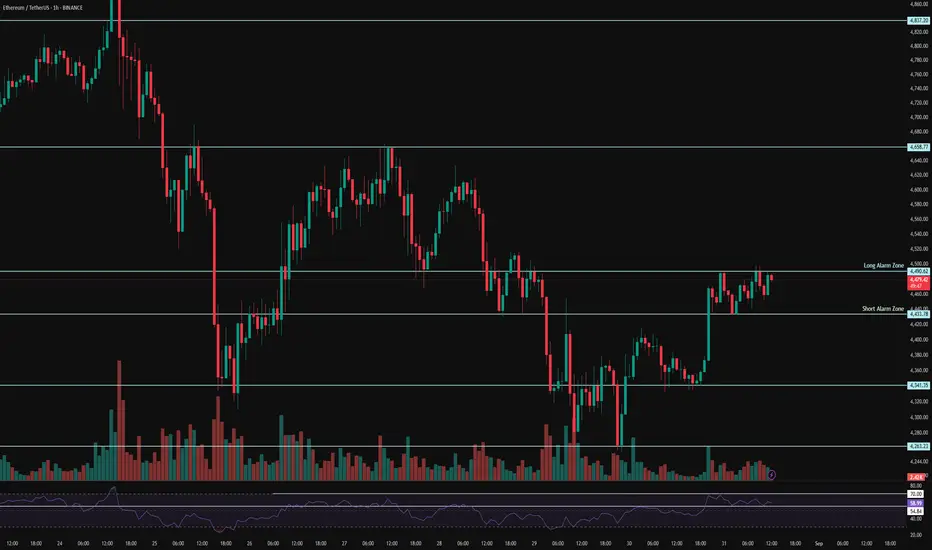
ETH 4H Analysis – Key Triggers Ahead | Day 7💀 Hey , how's it going ? Come over here — Satoshi got something for you !
⏰ We’re analyzing ETH on the 4-hour timeframe timeframe .
🔭 In the 4-hour timeframe of Ethereum, we can see that after registering its all-time high, Ethereum was rejected downwards and then took support from the $4,273 area and moved upwards. We need to see how valid this support can remain in the new week. There is also an important resistance at the $4,515 area, and breaking this level could end Ethereum’s corrective trend.
⛏ The key RSI areas are 35 and 58. If the fluctuation passes these levels, Ethereum could enter a new phase of volatility and eventually start its movement.
💰 The size and number of red candles have almost decreased, and with increasing volume and larger candle sizes, Ethereum can start a good trend. Keep in mind that today is a holiday, so not much volume enters the market. On the other hand, there are rumors on Twitter about the death of Donald Trump, which could also prevent an increase in volume.
🪙 In the 4-hour timeframe of the ETHBTC index , we can see that this index broke its box at the 0.03946 area and registered an all-time high for Ethereum against Tether pair. Then it was rejected from this area and showed two rebound reactions at the 0.03946 support, which is the broken box top. With a breakout of the highlighted areas in this index analysis, both Bitcoin and Ethereum could see more liquidity, and this directly affects the ETH/USDT pair.
🔔 The alarm zones that can be considered for Ethereum in this timeframe are the $4,273 and $4,514 areas. The price action in these areas can be of high value, and with increasing volume, they could give us either a short or long trade opportunity.
❤️ Disclaimer : This analysis is purely based on my personal opinion and I only trade if the stated triggers are activated .

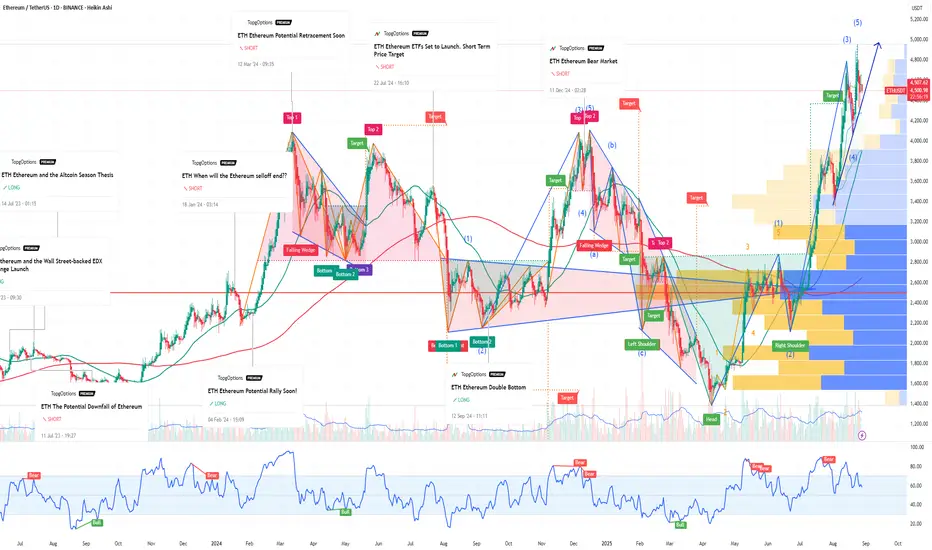
$ETH Did The Poke Above All Time High!As I said in my last update it would be unusual to complete the Elliot wave motif wave without a poke above all time high first and we got that this week adding confluence to an expected retracement ahead in wave 2. Poke above all time high shows long term strength.
Weekly RSI has bearish divergence from the wave 3 top in overbought territory.
Initial target is the (4) bottom and weekly pivot point at $3200 followed by $2800 High Volume Node and then the weekly 200EMA, S1 pivot and High Volume Node support at $2250. I will look out for longs in these areas.
Analysis is invalidated if proceed into price discovery.
Safe trading

Ethereum ETH Analysis: 1D Bullish Trend with Order Block Support🔎 I’m currently looking at Ethereum (ETH), which is showing a strong bullish trend on the daily timeframe 📈. Price has pulled back significantly into a daily bullish order block 🟢 — a previous accumulation range that I expect to act as a key support level.
On the 30-minute timeframe ⏱, I’m watching closely for a bullish break of structure 🔑 as confirmation for a potential long entry 🎯.
⚠️ Not financial advice.

BTC Game Plan BTC Game Plan
📊 Market Sentiment
Overall sentiment remains bullish, supported by expectations of a 0.25% rate cut in the upcoming FOMC meeting. A weakening USD and increasing global risk appetite continue to create favorable conditions for further upside in crypto assets.
📈 Technical Analysis
BTC printed a new all-time high but failed to close above it. Since then, price has been retracing inside the range, likely to collect more liquidity before another potential leg higher.
I will be focusing on discount zones and liquidity lows as potential areas for long opportunities.
📌 Game Plan
My key level is $104,750. A close above this level will confirm bullish intent.
This area aligns with 3 major confluences:
Broken trendline retest
0.75 range zone (deep discount level)
Daily swing liquidity
🎯 Setup Trigger
I will wait for a 4H market structure shift as confirmation before entering a trade.
📋 Trade Management
Stoploss: 4H swing low confirming the BOS
Targets:
• TP1: $113,300
• TP2: $117,110
• Runner: Potential push towards new ATH
💬 Like, follow, and comment if you find this setup valuable!
⚠️ Disclaimer: This content is for informational and educational purposes only and does not constitute financial, investment, or trading advice. Always do your own research before making any financial decisions.

ETH 4H👁️👁️Where is that going? Upwards. They swept more longs than I expected, so the correction was deeper. They need more shorts to make the move higher.🖤

Ethereum sideways ┆ HolderStatBINANCE:ETHUSDT on the daily chart is showing a consolidation phase after rallying past 4200. Price could test the 4500 zone before continuing higher. Resistance remains at 5000, and a breakout there could extend to 5200+.

ETH $3600 Soon.. Current ETH situation is bearish. I think in coming weeks ETH will reach its monthly FVG, that's around $3600.

Potential bearish drop off?Ethereum (ETH/USD) has rejected off the pivot which lines up with the 50% Fibonacci retracement and could drop to the swing low support.
Pivot: 4,644.35
1st Support: 4,106.00
1st Resistance: 4,948.64
Risk Warning:
Trading Forex and CFDs carries a high level of risk to your capital and you should only trade with money you can afford to lose. Trading Forex and CFDs may not be suitable for all investors, so please ensure that you fully understand the risks involved and seek independent advice if necessary.
Disclaimer:
The above opinions given constitute general market commentary, and do not constitute the opinion or advice of IC Markets or any form of personal or investment advice.
Any opinions, news, research, analyses, prices, other information, or links to third-party sites contained on this website are provided on an "as-is" basis, are intended only to be informative, is not an advice nor a recommendation, nor research, or a record of our trading prices, or an offer of, or solicitation for a transaction in any financial instrument and thus should not be treated as such. The information provided does not involve any specific investment objectives, financial situation and needs of any specific person who may receive it. Please be aware, that past performance is not a reliable indicator of future performance and/or results. Past Performance or Forward-looking scenarios based upon the reasonable beliefs of the third-party provider are not a guarantee of future performance. Actual results may differ materially from those anticipated in forward-looking or past performance statements. IC Markets makes no representation or warranty and assumes no liability as to the accuracy or completeness of the information provided, nor any loss arising from any investment based on a recommendation, forecast or any information supplied by any third-party.

ETH bear trap, kill the longs before 5kETH WILL GO TO 4K BEFORE 5K, price will search for stop losses of noobs before going up over 5k and price discovery

Same Setup, Same Zone – Will AMP Send Again?AMP is currently sitting on a strong support zone while trading just below a key descending resistance line.
This setup has repeated multiple times in the past — and each time, a breakout led to a strong upside move. If history repeats, a clean breakout here could trigger another explosive rally.
Until then, it’s a waiting game.
DYOR, NFA

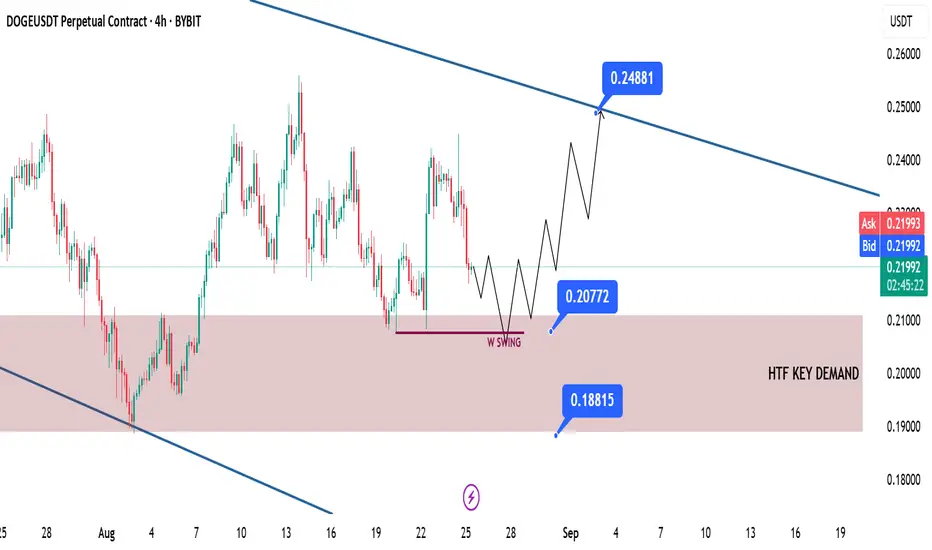
DOGE Swing Long Idea DOGE Game Plan
📊 Market Sentiment
Overall sentiment remains bullish, supported by expectations of a 0.25% rate cut in the upcoming FOMC meeting. A weakening USD and increasing global risk appetite are creating favorable conditions for further upside in crypto assets.
📈 Technical Analysis
Price is retracing towards the HTF Demand zone, which I expect to act as a bounce area.
Moreover, price currently seems to be seeking liquidity to fuel its next bullish move. That liquidity could be the weekly swing low at $0.207.
📌 Game Plan
Wait for price to reach the HTF Demand zone.
Look for price to sweep liquidity and close back above the $0.207 level.
🎯 Setup Trigger
I will be waiting for a 4H market structure shift before entering the trade.
📋 Trade Management
Stoploss: Daily close below HTF support zone — $0.188
Target: $0.248
💬 Like, follow, and comment if you find this setup valuable!
⚠️ Disclaimer: This content is for informational and educational purposes only and does not constitute financial, investment, or trading advice. Always do your own research before making any financial decisions.
Ethereum defended the $4310 ┆ HolderStatBINANCE:ETHUSDT on the 6h chart is consolidating under 5000 after a -14% retracement. Flag structures and channel support keep the trend bullish, with 5000 acting as the major resistance. A breakout above this line sets the stage for 5200.

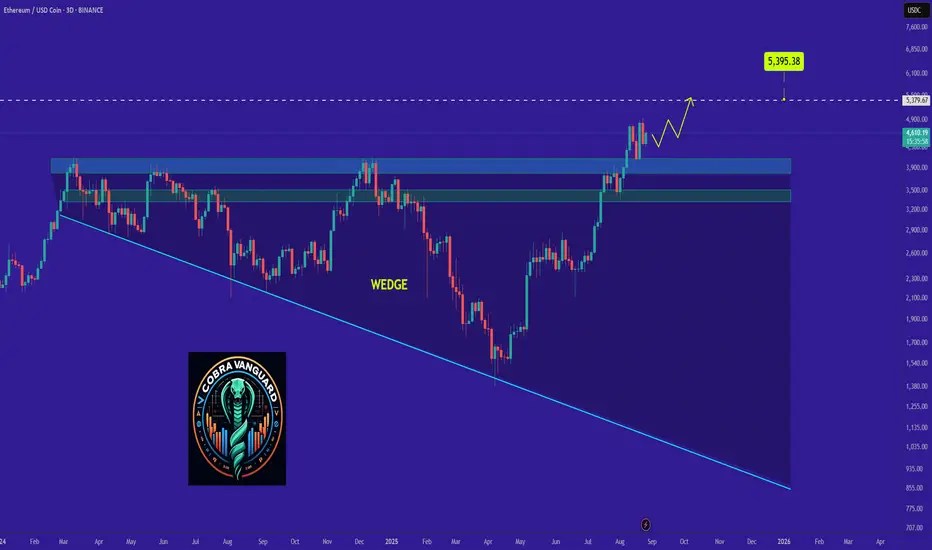
Why ETH Remains Bullish and Its Next Potential Move !As discussed in the previous analysis, the price has finally broken the wedge, and now, with a slight pullback, it could reach above $5k.
PREVIOUS ANALYSIS
Why ETH Ethereum Could Surpass BTC Bitcoin’s Market CapIf you haven`t sold the previous top on ETH:
Now why Ethereum Could Surpass Bitcoin’s Market Cap:
1. Ethereum’s Network Upgrades Drive Value
Ethereum has undergone significant upgrades, most notably the Merge, transitioning the network from Proof-of-Work (PoW) to Proof-of-Stake (PoS). This dramatically reduced ETH’s issuance rate and energy consumption, positioning Ethereum as a more sustainable and “deflationary” asset. With upcoming upgrades like Sharding, Ethereum is set to become faster, cheaper, and more scalable—critical factors for adoption in decentralized finance (DeFi) and Web3 applications.
2. DeFi and Smart Contract Dominance
Ethereum hosts the majority of DeFi protocols, NFT marketplaces, and decentralized applications (dApps). The network effect is strong: developers and users are deeply entrenched in Ethereum, creating high demand for ETH for transaction fees (gas) and staking. As DeFi continues to grow, ETH’s utility and demand could rise exponentially, putting upward pressure on price.
3. Institutional Interest and Adoption
Institutional interest in Ethereum has increased substantially. Products like ETH ETFs and staking services are attracting large-scale capital inflows. Unlike Bitcoin, which is often treated as digital gold, Ethereum has a dual narrative: store of value and programmable money. This unique proposition makes it appealing not only to investors but also to corporations exploring blockchain solutions.
4. Scarcity and Deflationary Pressure
Post-Merge, Ethereum implemented EIP-1559, which burns a portion of transaction fees, effectively reducing ETH supply over time. During periods of high network activity, ETH becomes increasingly deflationary. This contrasts with Bitcoin, whose fixed supply doesn’t adjust dynamically to network usage, giving Ethereum a potential advantage in a high-demand scenario.
5. Macro Trends and Crypto Evolution
As crypto matures, utility and adoption increasingly dictate valuation. Ethereum’s ecosystem—spanning DeFi, NFTs, DAOs, and enterprise solutions—is far more versatile than Bitcoin’s. This could make ETH the go-to platform for digital finance, giving it an edge in both market capitalization and long-term relevance.
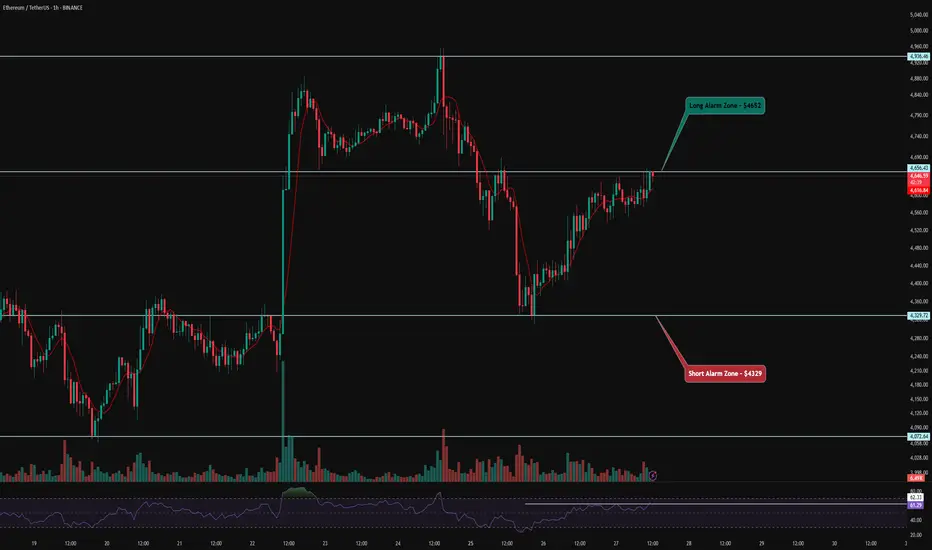
ETH 1H Analysis – Key Triggers Ahead | Day 4💀 Hey , how's it going ? Come over here — Satoshi got something for you !
⏰ We’re analyzing ETH on the 1-hour timeframe timeframe .
👀 On the 1H timeframe for Ethereum, we can observe that ETH is currently moving inside a V-pattern. If the price breaks out and consolidates above the neckline of this pattern, we could see a strong bullish continuation. Checking ETF flow data also shows heavy accumulation of Ethereum, which supports the bullish bias.
⚙️ The key RSI level for ETH sits around 62. Once the RSI crosses above this threshold, Ethereum has the potential to break the neckline of the V-pattern and push into the overbought zone, signaling further upside momentum.
🕯 Additionally, the volume, candle size, and number of green candles are increasing as ETH approaches this resistance. With rising trading volume, ETH could target higher price levels and potentially confirm a new all-time high.
🪙 On the 1H BINANCE:ETHBTC chart , we see a significant resistance level around 0.04274. A breakout above this zone with strong volume and volatility would provide an additional confirmation for a long position in Ethereum.
🔔 Our long setup alert zone is placed around $4652, while the short setup alert zone is positioned near $4329.
❤️ Disclaimer : This analysis is purely based on my personal opinion and I only trade if the stated triggers are activated .