XRP Game PlanXRP Game Plan
📊 Market Sentiment
Market sentiment has slightly shifted as expectations for a 0.25 bps cut in September are no longer strongly priced in. Current probabilities still show around a 60% chance of easing, but overall, the market remains uncertain. This uncertainty has led to risk-off moves and sell-offs across multiple assets, starting with NQ and extending into crypto.
📈 Technical Analysis
Price is retracing towards a higher timeframe (HTF) key support level.
The main liquidity zone sits around $2.73, where I would expect a significant bounce.
📌 Game Plan
I expect price to run into the $2.73 liquidity zone and close back above it. From there, I will look for price to reclaim the HTF key level as confirmation of bullish continuation.
🎯 Setup Trigger
I will monitor the 4H market structure for confirmation before initiating a position.
📋 Trade Management
Stoploss: 4H swing low confirming the BOS
Targets:
TP1: $3.14
TP2: $3.38
💬 Like, follow, and comment if you find this setup valuable!
⚠️ Disclaimer: This content is for informational and educational purposes only and does not constitute financial, investment, or trading advice. Always do your own research before making any financial decisions.
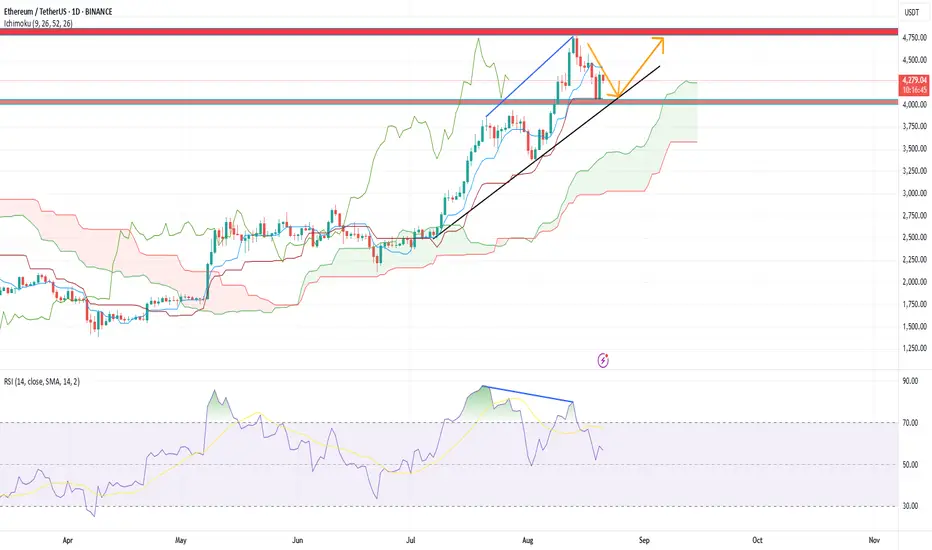
D-ETH

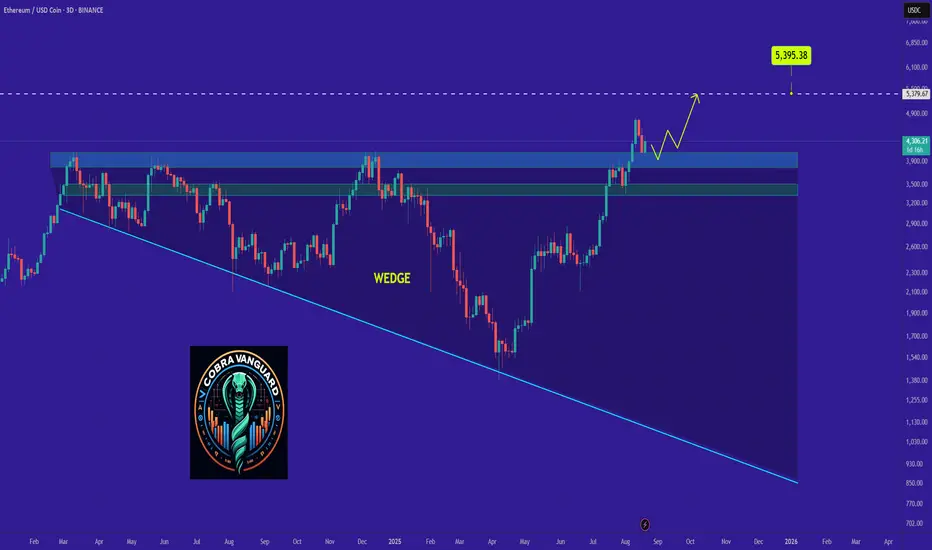
ETH New Analysis (4H)After the weekly trigger line was broken and a key supply was cleared, most of the major market participants have been accumulating Ethereum. Considering the momentum and power of the previous bullish trend, we expect nearby supports to hold well and a large distribution phase to form.
In this phase, in order to fill the orders of big players and create a strong bullish outlook before a major correction, the price is expected to revisit the previous bullish wave or even hunt Ethereum’s all-time high.
As long as the green zone holds, we anticipate a price pump for Ethereum in the coming days.
For risk management, please don't forget stop loss and capital management
Comment if you have any questions
Thank You

Ethereum 7 Days Later · Retrace Or Correction?More information is available now that Ethereum has been retracing for seven days, we can start to make some predictions by analyzing how the token is currently behaving, for example; there isn't much on this chart other than high volume the day that ETHUSDT peaked, the other bearish signals are weak.
The drop is not strong. ETHUSDT is trading safely above EMA55. This move resembles what happened 11-June. A retrace.
On 11-June ETHUSDT peaked at $2,879 and started to retrace. 11 days later, 22-June, ETHUSDT bottomed at $2,111 and that's it, that was the retrace. The entire move was a 26.65% drop, I think we can see something similar.
28-July ETHUSDT peaked again but only briefly, there was a six days long retrace totaling -14.89%. The drop happened from $3,941 to $3,354 but then Ethereum just kept on growing as if nothing happened like before; it is possible to see something similar.
The strength of the current drop, after seven days of bearish action, seems weak. It can intensify in a flash and we see a market crash, but the same dynamics that are present with Bitcoin are also present here. A major crash or flush would only result in a prolonged recovery followed by higher prices.
Ether is likely to move lower but not much lower. Ether is likely to consolidate just to move higher. Ether is growing. Keep it simple.
Namaste.

#ETH #ETHUSDT #ETHEREUM #Analysis #Update #Eddy#ETH #ETHUSDT #ETHEREUM #Analysis #Update #Eddy
According to the formed pattern, namely QM in the RTM style on the weekly block breaker, I expect an upward movement and a ceiling hunt and an ATH of Ethereum, and also in the ICT and liquidity styles, I expect a Fake BOS and a drop to the weekly block order to liquidate long positions and then continue the upward trend according to the analysis I did on the chart and the Path I drew. I expect the Ethereum currency to act accordingly.
So I expect an upward movement, a drop and a re-rise according to this analysis and explanation.
The important upper timeframe area for volatility has been identified and named.
These settings are based on a combination of different styles, including volume style with ict style and a combination of RTM and liquidity style.
Based on your strategy and style, get the necessary confirmations to enter the trade in these volatility settings.
Don't forget about risk and capital management.
The entry point, take profit point and stop loss point along with their values are indicated on the chart.
The responsibility for the transaction is yours and I am not responsible for any failure to comply with your risk management and capital.
🗒 Note: If, according to the analysis, the progress after the main rise begins, I expect the price of Ethereum to reach the targets of the latest analysis provided on Ethereum, which will be attached.
⚠️ Warning: Predicting market movements is a mistake and this analysis may be violated, so do not rush into your decisions and proceed to trade after obtaining the necessary confirmations. Market makers will always surprise us and predicting movements and future movements is a complex and difficult task.
Check out my previous analysis on Ethereum via the link below :

ETHBTC vs BTC.DEthereum / Bitcoin 📈 Bitcoin Dominance 📉
CRYPTOCAP:ETH / CRYPTOCAP:BTC vs. CRYPTOCAP:BTC.D

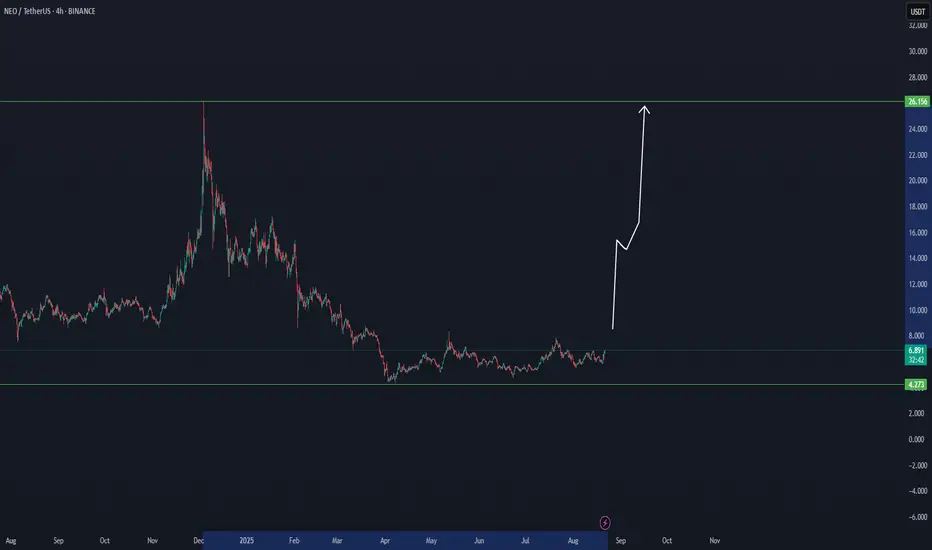
NEO IS COMING BACK FROM 262 DAYS FOR NEW INCREASENEW looks depending low time frame, interesting for day trade, which allows it same time to become a follow coin.
NEO is one of the best coins at this moment to follow for confirmations.
CYBER is ready to move higherAfter big dump, bottoming pattern formed succesfully and CYBER can go easily to the upside.
Expecting targets 40-110% in the mid term.
THIS IS NOT A FINANCIAL ADVICE
MANAGE YOUR RISK AND SET STOPLOSS ALWAYS

ETHBTC Opportunity Buy: Major 2025 AltcoinSeason & Bull MarketThis is the big one and the good one. ETHBTC was bearish since December 2021 but this cycle finally came to an end in April this year. After the initial bullish breakout and higher low we can clearly see some bullish action developing; three consecutive weeks green. The bullish bias is now confirmed. It is still early.
We are looking at 200% potential. The "back to baseline" target. This is a price range where ETHBTC traded sideways as part of a distribution phase for more than two years. This is a must-to-be-tested resistance zone and thus opens up a sure 200% profits potential for this newly developing bullish wave.
Ethereum's ETFs are coming, Bitcoin already has its ETFs. This can mean Ethereum outperforming Bitcoin, and many altcoins, in so many ways. This also opens up the potential for a new all-time high on this pair.
The same sequence of 'low-higher low' happened in the last bull market. ETHBTC hit bottom in September 2019 then produced a higher low and this signaled the start of a major, long-term 447% rise. The conditions are similar now but the rise will be faster.
We have two main targets for the all-time high in late 2025 or early 2026.
1) 0.13207. With 442% profits potential from current price.
2) 0.20278. With 733% profits potential.
The entire bullish cycle for this pair can unravel within 4-6 months. If it becomes extended, it can last one year or longer. Both scenarios are possible.
It is 100% certain that ETHBTC will go on a major bullish cycle together with the rest of the altcoins market. Bitcoin will also grow.
Thanks a lot for your continued support.
If you are bullish on Crypto, comment below.
Namaste.

Sonic ($S) – Rebound After Heavy DownsideAfter months of downside, $S looks ready to repeat its historical cycle of massive accumulations followed by explosive breakouts.
✅ Previous cycles show gains of +1,600%, +5,600%, and +900% after similar consolidation phases.
✅ The current falling wedge breakout on the weekly chart suggests that momentum is shifting back in favor of the bulls.
✅ Strong fundamentals are aligning:
Testnet 2.1 upgrade (Aug 12) integrated Ethereum’s Pectra for scalability & interoperability.
TVL inflows of $21M and growing trading volume (June $3.1B → July $4.9B).
US expansion plans (ETF, NASDAQ PIPE, Delaware entity) with governance vote ending Aug 31.
🎯 Targets Ahead
First resistance: $0.54
Mid-term: $0.84 → $1.45
Long-term (cycle projection): $9 → $15+
⚡️ History shows what happens after long consolidations: parabolic runs. With fundamentals lining up and technicals breaking out, this could be the beginning of Sonic’s next major cycle.
💡 “After all the downside, it’s time for $S to return – the setup looks explosive.”

Ethereum price correction will continue to around $4,000.After Ethereum hit the 4800 resistance level, we are witnessing a price correction. I think Ethereum can goes up again when it hit the Support level at around 4000$.
Important level here for ETH🎯 Key Levels to Watch:
• Above: 4240 / 4340 / 4470
• Below: 4090 / 4010 / 3940
🔥 ETH Liquidation Heatmap:
• Above: 4229 / 4275 / 4316
• Below: 4082 / 4040 / 3972
Ethereum just touched Daily 20sma at price ~4066
I bought some there, but frankly, I expected it to fall lower and most of my orders are still there. Unless ETH grows above 4300 and start trading there, chances for another dip to 3940-4010 stay valid.
Why ETH Remains Bullish and Its Next Potential Move !It appears that the pullback is nearing its end, which could potentially lead to a price increase of up to $5000.
PREVIOUS ANALYSIS
#XRP How Long To Reach 3.31 ?#XRP
The price is moving within a descending channel on the 1-hour frame, adhering well to it, and is heading for a strong breakout and retest.
We have a bearish trend on the RSI indicator that is about to be broken and retested, supporting the upside.
There is a major support area (in green) at 2.80, which represents a strong basis for the upside.
For inquiries, please leave a comment.
We are in a consolidation trend above the 100 Moving Average.
Entry price: 2.90
First target: 3.30
Second target: 3.14
Third target: 3.31
Don't forget a simple matter: capital management.
When you reach the first target, save some money and then change your stop-loss order to an entry order.
For inquiries, please leave a comment.
Thank you.

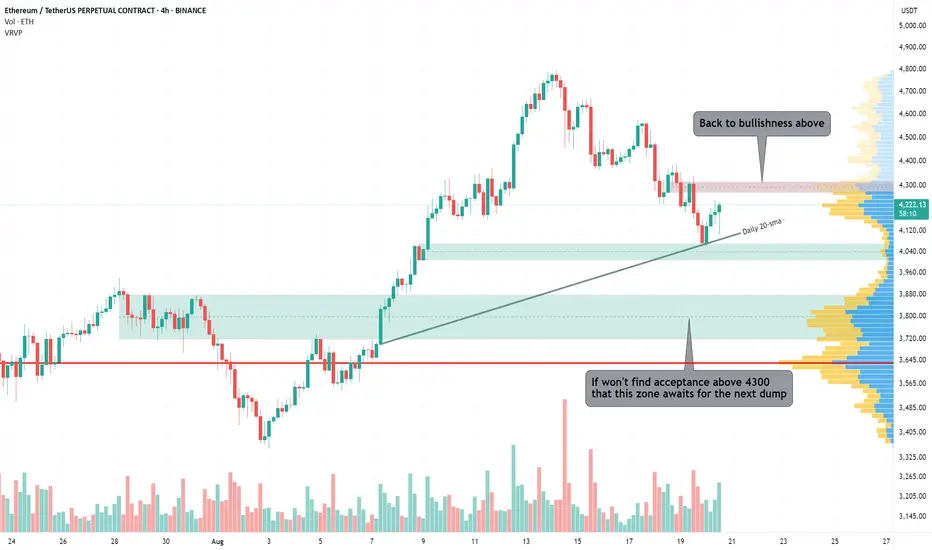
ETHEREUM - MAKE OR BREAK TIMECRYPTOCAP:ETH Is right at the downtrend line and if it decides to reject then we will most likely be heading down towards $3.8-$4k area.
Weekly WCB formed and the Daily (Top Right) is figuring out what it wants to do.

ETH ~ Is this the right buy for 4950?Likely? not likely if you can see or likely? LEts see whats it upto, though as said, it shall blow the pumpkin of everyone

SUI Game Plan - AltcoinSUI Game Plan - Altcoin
📊 Market Sentiment
Overall sentiment remains bullish, supported by expectations of a 0.25% rate cut in the upcoming FOMC meeting. A weakening USD and increasing global risk appetite are creating favorable conditions for further upside in crypto assets.
📈 Technical Analysis
Price was rejected from the broken HTF bullish trendline.
It retraced back to the daily swing demand zone to gather more liquidity.
Price is currently trading below the 0.5 Fibonacci equilibrium level, which I consider a discount zone.
📌 Game Plan
I expect a deeper retracement towards the 4H swing liquidity at $3.45.
Additionally, the 0.75 Fibonacci max discount level aligns with this 4H swing liquidity. Running that liquidity would likely trigger a strong bounce.
🎯 Setup Trigger
I’ll be watching for a 4H break of structure (BOS) to initiate entries.
📋 Trade Management
Stoploss: 4H–1H swing low confirming the BOS
Targets:
TP1: $3.90
TP2: $4.18
TP3: $4.44
💬 Like, follow, and comment if you find this setup valuable!
⚠️ Disclaimer: This content is for informational and educational purposes only and does not constitute financial, investment, or trading advice. Always do your own research before making any financial decisions.

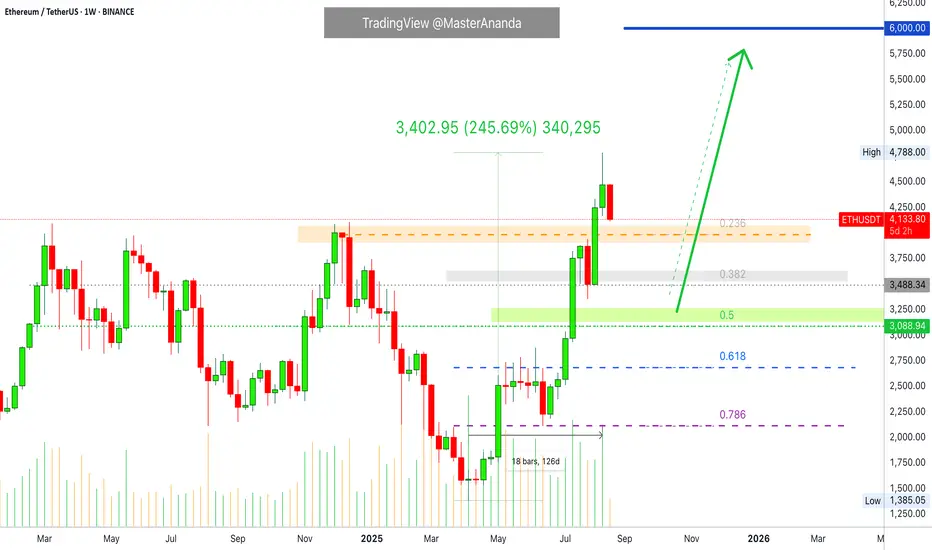
Ethereum: What About Support? $3,000 Next? Watch!Ethereum grew a massive 245% from its 7-April 2025 low and market bottom. The last low pre-2025 bull market. And we are here and this chart is awesome because there is no doubt where we are in this market cycle. We know the market is experiencing growth, Ether is growing, and we know this is only the start.
After strong growth, there is always a correction.
The market tends to seek balance.
ETHUSDT growing straight up for 126 days, four months. 245% total rise.
Where are the support levels?
A strong rise within a bull market is followed by: a mild correction or a strong correction? A long-term multiple months long correction or a two weeks long correction?
Let me help you answer those questions.
Four months will never allow for a correction lasting 3-4 months. This is out of the question. Normally a correction deletes only a portion of the previous move and it tends to last a portion of the previous move.
The equivalent to 0.618 and 0.786 was already consolidated back in May and June. This means that this level does not need to be tested or if it is tested, in an extreme case, then it is likely to hold. Why? Because Ether stopped at this point for more than a month creating a baseline.
The 0.236 Fib. retracement, around $3,900, was not consolidated so this level goes bust as support, on the first try. There wasn't any action around this level on the way up, there won't be any on the way down. So we know Ether to move lower on this drop.
The next level is 0.382 Fib. and this is a strong level. Retraces and corrections within a bull market can easily end here. This is a price of $3,485. There is support around this level as it was consolidated for two weeks before the last high. This level has potential to hold because Ethereum is very strong right now and this zone is below the March, May and December 2024 peaks.
The last level is the 0.5 Fib. retracement. This is another strong support and it tends to stop corrections on its track on a strong bull market. This level can be easily tested. If it is tested, the action isn't likely to last long at these low pries. We are talking about $3,100.
Again, the range between $2,100 and $2,700 is the 0.786-0.618 Fib. retracement and this is a dream buy zone right now and very unlikely that such an opportunity will open up. If it does open, this time, will you buy? Buy when prices are low. Sell at resistance, buy at support.
Ethereum is going down. It is still too early to say how long this correction will go for. Just keep in mind that a retrace can last 1-3 weeks while a correction can last 1-3 months. Both scenarios are possible. Regardless of what the market decides, the bull market is not over, we will see additional growth.
Ethereum will continue growing to hit a new all-time high and beyond.
Namaste.
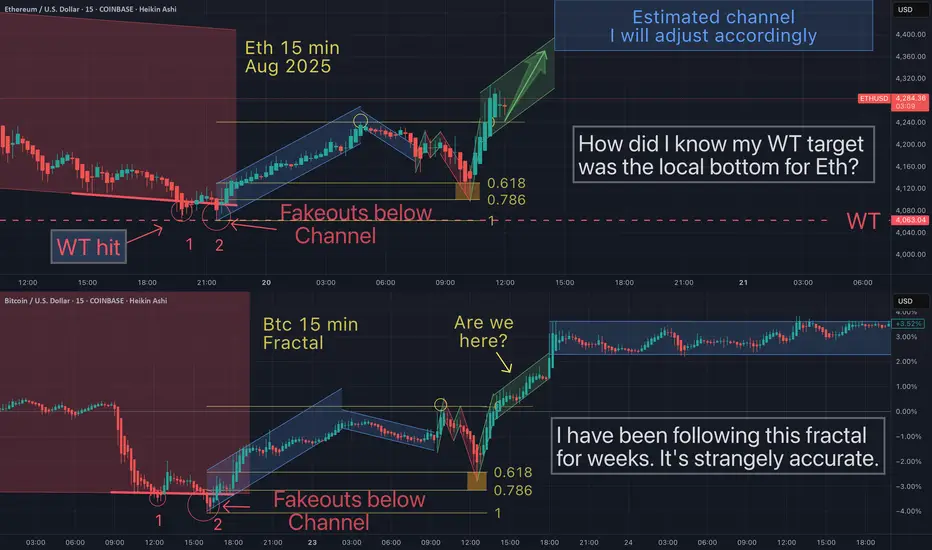
Eth has been following this exact Btc fractalIn the world of graphing (charting) and linear equations, the concept of "fractals" would be mathematically improbable. But in charting, fractals work - until they dont. Fractals usually stop working as an exact map when you LEAST expect (or want) then to.
ETH at the Edge: Support or $4K Next?
ETH on the 1H
ETH is still hovering around the green local support zone.
Yesterday it bounced from the daily close (black dotted line). Today it broke the lower limit of the green zone, stalled at the 50MA, and is now retesting that same lower limit, with the 50MA pressing down.
If support holds, a bounce back above the 50MA toward the upper limit of this green zone is possible. If it fails, $4K could be the next support.
Current signals:
MLR > SMA > BB Center, PSAR bullish → trend still favors the upside.
RSI is above 50 but pointing down.
MACD is right on the edge of flipping red.
Important: structure is still lower lows + lower highs, so if you’re looking to go long, tight risk management is not optional.
Always take profits and manage risk.
Interaction is welcome.

Ethereum will retest the 4100 level ┆ HolderStatBINANCE:ETHUSDT retesting $4,100 support after recent highs above $4,600. Structure shows strong bullish continuation if buyers hold this zone, with targets at $4,600 and $5,000. Breakdown risks pullback to $3,800–$3,600.
ETH - Gives you another chanceETH ~ 3946 good for the last move to 4950 i shall say this is a good place for DCA!

ETHUSD H4 | Bullish bounce off pullback supportEthereum (ETH/USD) is falling towards the buy entry of 3,893.21, which is a pullback support that is slightly above the 78.6% Fibonacci retracement and could bounce to the take profit.
Stop loss is at 3,563.13, which is a multi-swing low support.
Take profit is at 4,170.96, which is a pullback resistance.
High Risk Investment Warning
Trading Forex/CFDs on margin carries a high level of risk and may not be suitable for all investors. Leverage can work against you.
Stratos Markets Limited (tradu.com ):
CFDs are complex instruments and come with a high risk of losing money rapidly due to leverage. 65% of retail investor accounts lose money when trading CFDs with this provider. You should consider whether you understand how CFDs work and whether you can afford to take the high risk of losing your money.
Stratos Europe Ltd (tradu.com ):
CFDs are complex instruments and come with a high risk of losing money rapidly due to leverage. 66% of retail investor accounts lose money when trading CFDs with this provider. You should consider whether you understand how CFDs work and whether you can afford to take the high risk of losing your money.
Stratos Global LLC (tradu.com ):
Losses can exceed deposits.
Please be advised that the information presented on TradingView is provided to Tradu (‘Company’, ‘we’) by a third-party provider (‘TFA Global Pte Ltd’). Please be reminded that you are solely responsible for the trading decisions on your account. There is a very high degree of risk involved in trading. Any information and/or content is intended entirely for research, educational and informational purposes only and does not constitute investment or consultation advice or investment strategy. The information is not tailored to the investment needs of any specific person and therefore does not involve a consideration of any of the investment objectives, financial situation or needs of any viewer that may receive it. Kindly also note that past performance is not a reliable indicator of future results. Actual results may differ materially from those anticipated in forward-looking or past performance statements. We assume no liability as to the accuracy or completeness of any of the information and/or content provided herein and the Company cannot be held responsible for any omission, mistake nor for any loss or damage including without limitation to any loss of profit which may arise from reliance on any information supplied by TFA Global Pte Ltd.
The speaker(s) is neither an employee, agent nor representative of Tradu and is therefore acting independently. The opinions given are their own, constitute general market commentary, and do not constitute the opinion or advice of Tradu or any form of personal or investment advice. Tradu neither endorses nor guarantees offerings of third-party speakers, nor is Tradu responsible for the content, veracity or opinions of third-party speakers, presenters or participants.

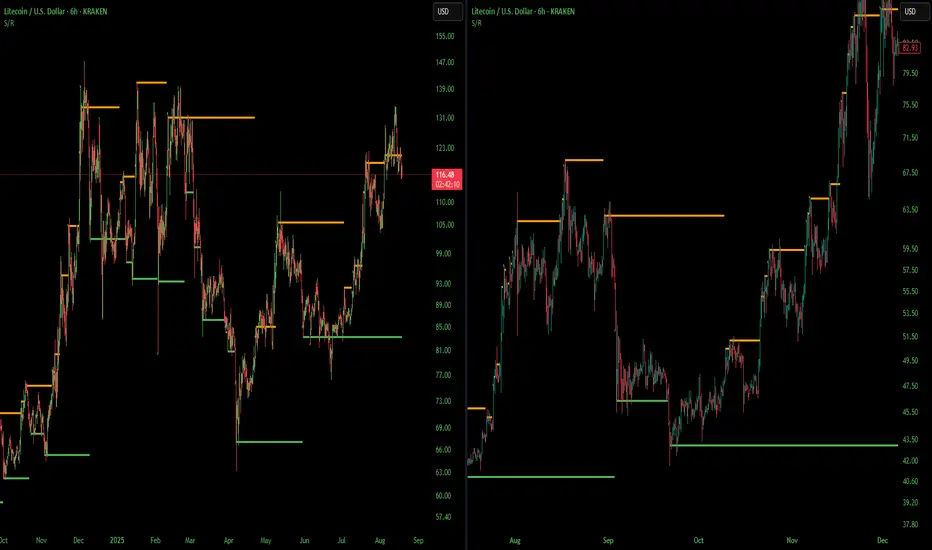
Not Exact But Man Does It Look Similar LTCUSDI had pointed this out in a previous chart but i thought I would zoom in and show how similar these look. I think its launch time, last time LTC was at this point it did a 10x in a month. Alt season starts when Litecoin says so. Not financial advice just my opinion. Thank you