ETHUSDT → A new range has been opened. Onward to ATH!BINANCE:ETHUSDT is breaking through strong resistance formed in the 4090-4100 area on D1-W1. Consolidation is forming after strong growth, which can be seen as a positive sign.
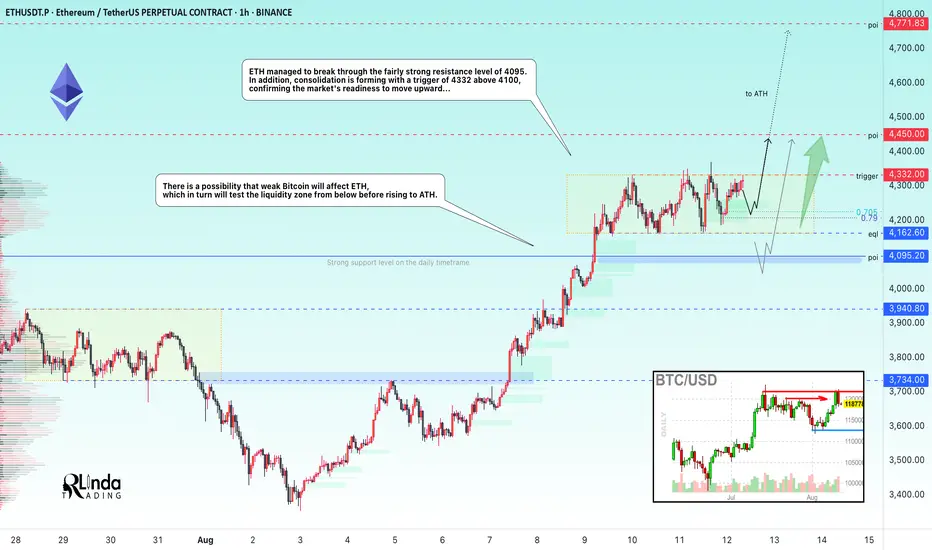
Bitcoin has been looking quite weak recently against ETH, which continues to rally despite Monday's red market. ETH managed to break through the fairly strong resistance level of 4095, and after a strong 25% rally, the price moved into consolidation (trading range 4325-4160, with resistance at 4325 as the trigger). Technically, we see that the market has stopped updating local lows, and a fourth retest of resistance is forming with reduced volatility, which in general could lead to a breakout attempt. Consolidation of the price above the consolidation resistance could trigger further growth. A channel to the ATH is open...
Resistance levels: 4325, 4450, 4800
Support levels: 4220, 4162, 4095
ETH is quite strong and the market may not allow the price to fall too low, as there is a lot of excitement. However, I do not rule out the possibility that weak Bitcoin will affect ETH, which in turn will test the liquidity zone (4162 - 4095) from below before rising to ATH.
Best regards, R. Linda!
D-ETH
Analysis LearnOpen the image to see it in higher quality. 🕯 The points marked are potential entries based on market conditions and higher timeframe analysis. If confirmed, I may take the trade. The win rate usually ranges between 30% and 60%, which means that out of all these buy and sell setups, up to 60% might result in a loss.
📕 Many of you have asked for tutorials here and on TradingView. Please understand that I don’t have the time to provide them, and the best way to learn is by trading with your own money—which you’ve worked hard to earn—of course, not with large amounts but with proper risk management.
🙏 I hope this chart helps you.

$Eth Ethereum nearing critical resistance....All Time High soon!This is a weekly candlestick chart of ETHUSD
Current price: 3800
CRYPTOCAP:ETH Ethereum recently broke out of a long-term downtrend, indicated by the red diagonal trendline. Price action has shifted from bearish to bullish. This is also a show of strong Momentum as recent candles are large and green, showing aggressive buying (strong bullish pressure).
If #eth continues in this uptrend then here are the resistance above to watch: 4000, 4800 and possibly new all time highs at 5600, 6400
Note worthy to know that the areas between 3800-4000 is very critical resistance.
Assuming a retracement from this resistance, Ethereum remain bullish above 2900
Invalidation of this idea is under 2900

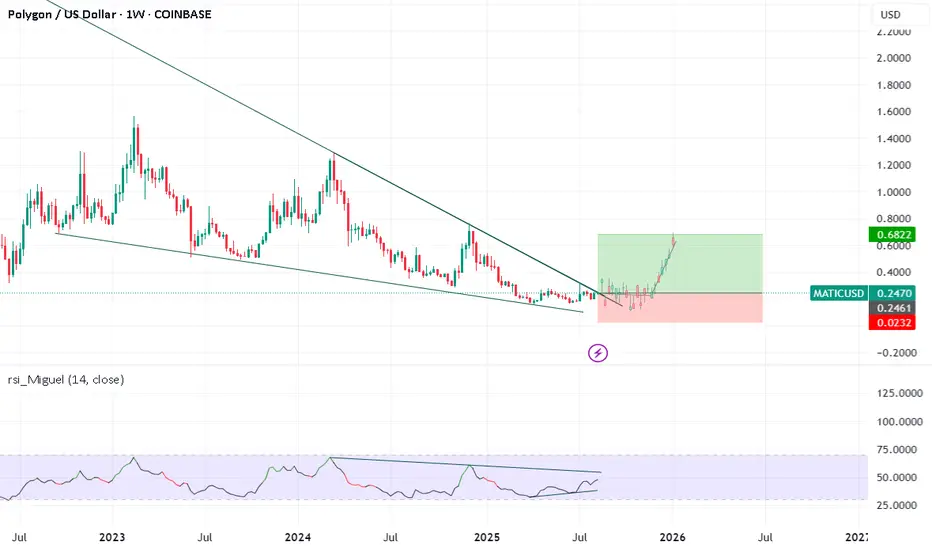
Matic Polygon +170% SoonWhy might MATIC (Polygon) "explode" in price on certain days?
While it’s impossible to predict exact “explosive” dates, here are key catalysts and technical factors that historically drive MATIC price spikes—and may do so again:
1. Major Upgrades & Network Upgrades
The Heimdall v2 upgrade—launched July 10, 2025—marked a transformative step, slashing finality to ~4–6 seconds and speeding up block production to ~2-second intervals.
Ongoing developments as part of Polygon 2.0, AggLayer, and zkEVM integration continue to boost ecosystem potential
These upgrades often spark increased attention and price appreciation, particularly around launch or adoption milestones.
2. Technical Reversals & Chart Signals
Analyst “MasterAnanda” highlighted a bullish divergence on the 3-day RSI: Polygon’s price hit a low in April 2025, while the RSI bottomed months earlier in July 2024—suggesting a trend reversal and potential rally toward $1
If key resistance levels are breached with volume—especially following such RSI signs—traders may see "explosive" moves.
3. On-Chain Activity & Growing Adoption
The Agglayer Breakout program that airdrops tokens to POL stakers aims to enhance user participation and ecosystem engagement
Partnerships with gaming and Web3 platforms, plus zk-tech integration and account abstraction standards, help build a foundation for longer-term growth
Increased developer activity, staking incentives, and ecosystem usage can create demand surges.
4. Broader Market Trends & Macroeconomic Catalysts
As a Layer-2 Ethereum scaling solution, MATIC often moves in sync with broader crypto trends—such as bullish sentiment in Bitcoin or Ethereum
Regulatory clarity, ETFs, or institutional inflows boosting Ethereum could spill over into MATIC.
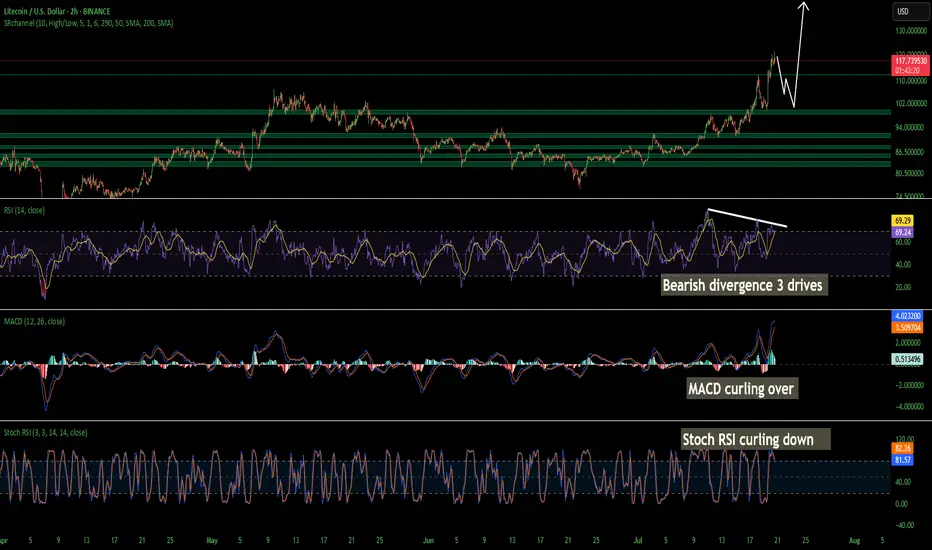
LTC Litecoin Short Term Pull Back Quick and SharpI believe Litecoin Is topping out on the 2 hour. Looks like we may come back down and tap support at around 104 but I wouldn't be surprised a wick hits 100. I have buy orders around 103-106. I am not super confident on a deeper pullback so thats why my buys are there is so i don't miss the dip. Id rather make a little less money than miss a buy in trying to nail the bottom. Litecoin is starting its breakout from a 7 year consolidation and accumulation phase. This should be pretty massive. Litecoin is going to benefit considerably from these new bills that are being signed and many of the favorites in the top 100 will soon disappear!
The time for Litecoin to shine as I have been talking about for years is now. I am almost certain that this is that time. My predictions all still hold if you would like to go read them. I was just off on timing. Timing is the hardest thing to predict especially with how wild this planet has been lately. None of this is financial advice its just my opinion.
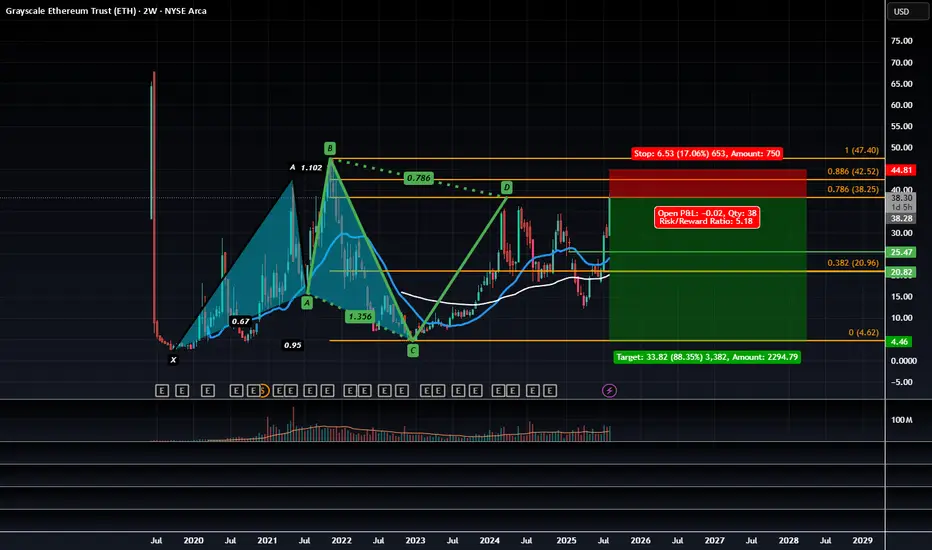
The Grayscale Ethereum Trust at Risk of Exacerbated DeclineETPs such as Grayscale's ETHE here utilizes APs (Authorized Participants) which are essentially broker dealers and large financial institutions such as banks, hedge funds and other investment firms to maintain liquidity of the Exchange Traded Product. These APs capitalize on the spread between the ETHE shares and the underlying product, in this case Ethereum, to make a yield through arbitrage.
Put simply, if demand for ETHE begins to rises above current supply, Authorized Participants can create new shares by depositing actual ETH with Grayscale. In return, Grayscale grants the AP newly minted ETHE shares. The AP then is able to list these shares on the secondary market where retail traders can buy them.
Historically these APs were able to mint new ETHE through this process of depositing ETH to Grayscale but they weren't able to redeem their ETHE shares back to ETH, however with the very recent onset of In-kind redemption and creation being permitted by the SEC , we are more likely to see a huge shift in the trend of redemptions.
Now that the SEC has enabled these in-kind redemptions, we could see these APs opt to redeem their ETHE shares for ETH just so they could sell said ETH on the open market or use it as liquidity for privately negotiated block trades on CME futures market during times of stress.
Say if there were sudden inflationary shocks, bond yields rose, or we had systemic banking risks, or even margin risk due to the underperformance of other sectors these institutions may have exposure to, we would likely see them let go of their riskiest assets first before resorting to selling other assets such as stocks and equities, especially those within the defensive categories. This would put Grayscales ETPs in direct danger of collapse as they lose liquidity from their APs and more importantly so it would put these underlying assets at risk of significant decline as the APs continue redeeming, adding supply to the open market, and selling.
This would not only result in negative pressure being put on the underlying assets but will also most likely result in Grayscales ETPs falling a significant amount more than the underlying due to the drainage off liquidity and the resulting widening of spreads. Asa result I think the end game for a lot of these crypto adjacent ETPs and Stocks will be that they go bust especially the leveraged products even including stocks like MSTR which effectively act as a leveraged exposure ETF to Bitcoin. In spite of this negative view I do have some optimism for XRP but overall I am quite bearish on the crypto market and all of the adjacent products being created from it.
In short: ETH along with BTC, which started out to as something to separate itself from the fiat banking system is now completely integrated and at the mercy of the fiat banking system along with all the macroeconomic risks that come with it.
Technical Outlook for the Grayscale Ethereum ETP:
We have a Bearish 5-0 that is completing at the 0.786 retrace we've recently made higher highs but that was likely on the onset of the SEC news release from a couple days ago being interpreted at a bullish capacity, however as the news settles I think it will be more of a negative outcome and us trading to the PCZ off that news provides a good opportunity to sell call spreads and buy puts on ETHE here.
ETH Long after pull-backEthereum (ETH) price action in August 2025 shows a recent price around $4,567, with a decline of about 3.87% on the day. The price has ranged between roughly $4,450 and $4,790, close to its yearly high for the current year. Market activity suggests volatility with occasional pullbacks and consolidations near key levels around $4,600 to $4,800. Technical outlook indicates bullish momentum is somewhat challenged by periods of consolidation and minor corrections, with resistance levels near $4,800-$5,000 and support around $4,500 and below.

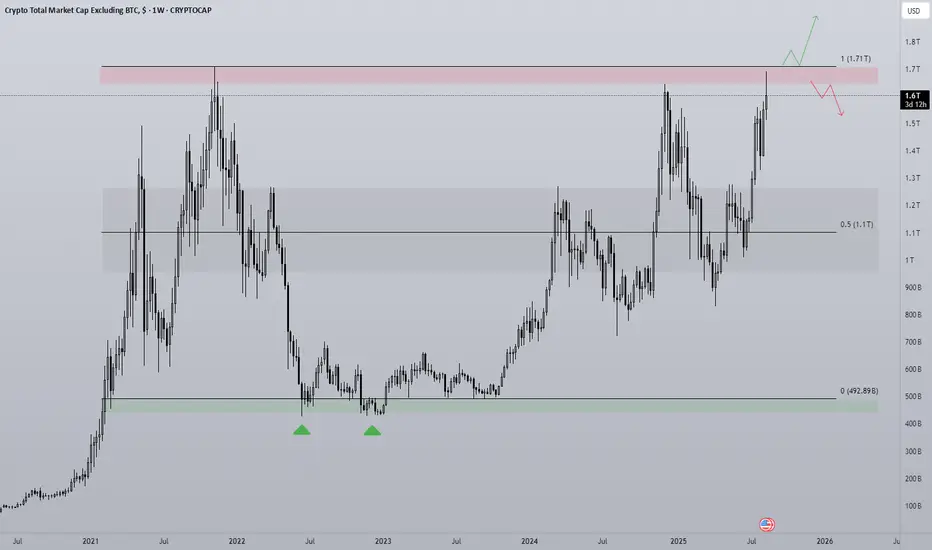
TOTAL2 - Breakout or Rangebound?The altcoin market as a whole has reached a critical point in the cycle. With all time highs in sight the question of what happens next is an important one.
Bullish scenario -
Accumulation under the Range high and a strong break above with volume, that would put TOTAL2 into price discovery and from there just riding the wave until there is a reason not too. Invalidation on the loss of range high.
Bearish scenario -
Clear rejection off the Range high and a break in bullish structure e.g a lower high and lower low on the 4H/1D time frame. This does not include bullish accumulation under the high as that shows coiling for a breakout instead of a loss of momentum.
Paying close attention to the context of the trading environment is key to the execution of the trade as well. Anecdotally the crypto sphere is euphoric with many calling for astronomical gains, posting their trade gain screenshots etc, google searches for coins like Ethereum have sky rocketed. These are all warning signs for me that at least as of now we are due a correction going off of previous cycles. I am by no means bearish on the larger time frame but coming into range high resistance with the market environment the way that it is this needs to be considered in trade execution.
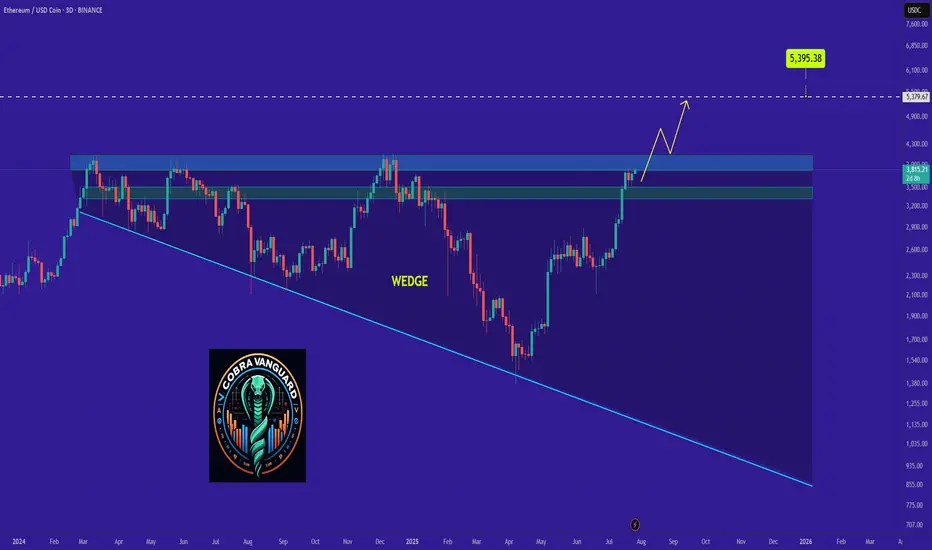
Why ETH Remains Bullish and Its Next Potential Move !The ETH will increase $200 and reach to the top of the wedge in the coming days .
We can be hopeful that after breaking out of the wedge, we will see significant price growth.
Best regards CobraVanguard.💚
Give me some energy !!
✨We spend hours finding potential opportunities and writing useful ideas, we would be happy if you support us.
Best regards CobraVanguard.💚
_ _ _ _ __ _ _ _ _ _ _ _ _ _ _ _ _ _ _ _ _ _ _ _ _ _ _ _ _ _ _ _
✅Thank you, and for more ideas, hit ❤️Like❤️ and 🌟Follow🌟!
⚠️Things can change...
The markets are always changing and even with all these signals, the market changes tend to be strong and fast!!
Ethereum ETH Pullback Into Support Could Lead to Another Rally📊 Taking a close look at ETH/USDT, the market has recently shown bullish intent after a break of structure on the daily 📈. From a Wyckoff perspective, price is currently reaching into a key resistance zone. Im looking for a retrace into support and, potentially forming an accumulation phase. I’ll be watching for a shakeout below support — followed by a strong rally. If this confirms with a bullish market structure break, it could offer a high-probability long setup 🔍💡🚀 (not financial advice).

ETH ROAD TO 20K+ plan BAs far as we are getting closer to the final accumulation stage on ETH we can see a potential shape of huge channel in log scale but even bigger I posted previous time due to price action and ETH going better I thought.
Still after forming median of the channel I would like to see a big and fast correction from here towards 2900 support which must hold imo.
Top of that channel depends on timing so the later the better I guess.

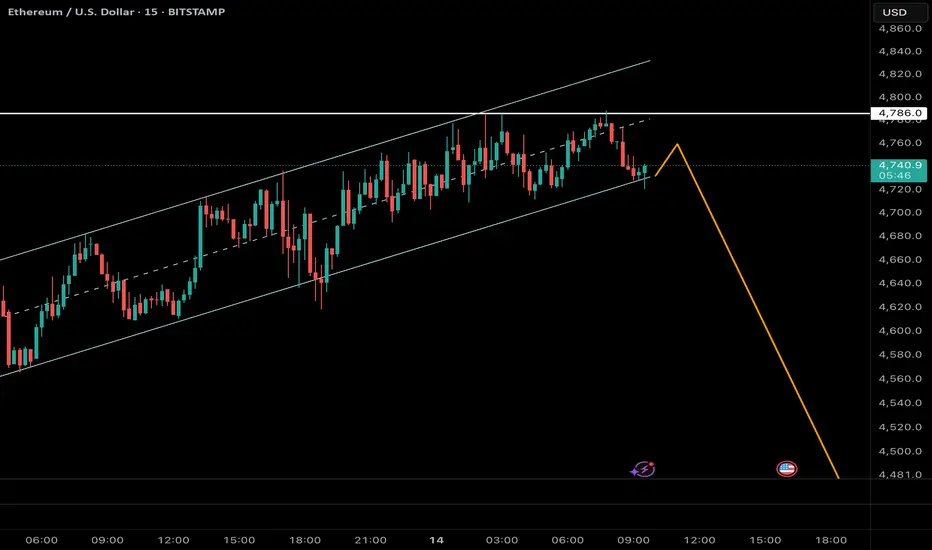
Ethereum on the Edge – The Breakdown Could Start Any Moment!Following yesterday’s analysis, where we identified Ethereum in the final stages of wave 5 of 5 at the upper boundary of its ascending channel, the 15-minute chart now reveals a contracting Neutral Triangle structure. This pattern typically forms as the final subdivision of wave 5, often preceding a sharp and decisive reversal.
Currently, price is testing the upper boundary of the B–D trendline. A confirmed breakdown from the E-wave low (≈ $4,590) would mark the completion of the triangle and signal the start of the anticipated decline.
Key Observations:
• Pattern: Neutral Triangle inside wave 5 of 5 (final stage of advance)
• Reversal Trigger: Break below E-wave low (~$4,590) on strong volume
$BTC Macrolast idea remains intact—we are still bullish. Alts have held strong while BTC plunged. (I don’t own any BTC, and neither should you above $100K.)
I predicted the exact $15.5K bottom on X, as well as the August 5th crash and bottom. Unfortunately, I wasn’t on the charts in December and missed the biggest, clearest signal on USDT.D for a potential local top, which otherwise would have 2x'd my current portfolio but mistakes were made)
BTC taking the hits while alts hold steady is a strong sign that whales are taking profits from Bitcoin and preparing for "rotation".
Most traders believe the cycle is over—and there are valid reasons for that (some of them are):
- A monthly bearish engulfing candle
- A structure resembling the 2021 top, suggesting one last rally before the bear market
- Worst of all, double bearish divergence on the monthly, which worries me too
However, there are strong counterarguments.
The biggest? The cycle has never topped with BTC.D this weak. That’s why I’m still leaning toward a bullish scenario until proven otherwise.
Update on the above chart:
The parabola is intact with a beautiful reaction. That doesn’t mean we can’t still visit the red box—there’s only air between them—but I’m holding, and that remains my primary scenario.
Alts can make new lows, but RR isn’t worth it. As I’ve said before, the time to sell spot bags has passed. You don’t sell in between unless invalidation occurs.
Timing is everything. We failed to time this market, assuming it would mimic past cycles—but everyone was wrong. Traders won this cycle, while investors (except BTC holders) struggled... until now, at least.
ONLY DIFFERENCE BETWEEN BOTH SCENARIOS (MENTIONED ON CHART) FOR ALTS?
You have to wait way longer on the second scenario but both would take us to our goal.
Worst case? We break and HTF close on USDT.D - last hope, officially ending bull market!

Ethereum Breaks 504 Days Long Resistance · The 2025 Bull MarketEther just broke a 504 days long resistance. The next one is the 2021 all-time high which happened a massive 1,372 days ago. Early November 2021.
Ethereum is breaking all resistance. One is already gone and the next one will be gone very soon, just this week is the first time that ETHUSDT is moving freely after breaking the high from March and December 2024. This was a price level around $4,100 and this was a tough barrier.
First in March 2024 Ethereum started to decline from this price to a low of $2,111. The second time happened with a $1,385 bottom. This time, ETHUSDT is already trading at $4,725 so there is no resistance left.
The last all-time high is not a resistance level of relevance. It does have some psychological effects because people track it but the market isn't likely to stop there for any meaningful amount of time. The action is headed straight up.
You know we are open and aiming for $11,000 but right now $6,000 followed by $7,300 is an easy goal. Go higher.
Do you think Ethereum was expensive when it traded around $2,400?
Remember, "trading at bottom prices"? Not anymore.
Ethereum is ultra-bullish now and there is no going back, a new all-time high is upon us and once Ether hits a new all-time high, all bets are off. Everything will speed up and all the smaller altcoins will start to follow.
The high increase in trading volume that tends to happen on the third wave of a bullish impulse is not present here. In fact, there is no significant rise in trading volume since July 2022. The weekly session in April produced high volume but not higher.
This is good. This means that the best is yet to come. We haven't seen much yet. We still have to experience the bullish force, strong momentum, the completion of the third wave and then finally the fifth wave.
Whatever you do, keep holding long-term.
Ethereum is going up.
Namaste.

Bitcoin Dominance · Bitcoin Hits $1,000,000, ETH $200K Bitcoin Dominance is displaying the lowest reading in 8 months, since January 2025.
Bitcoin Dominance is in the worst condition possible in 4 full years. The Bitcoin Dominance Index chart predicts a major bullish cycle across Crypto; Bitcoin and the altcoins market.
Good evening my fellow Cryptocurrency trader, I hope you are having a wonderful day.
This week we have a bearish continuation on BTC.D, which also works as bearish confirmation which reinforces the bearish continuation. The altcoins are already going up, it has been happening for months.
The market has been rising for months; Bitcoin has been rising for years but this isn't all. Seeing BTC.D here we know the bigger portion of the current trend is still to unravel.
The rounded top, a bearish reversal signal, is complete and the neckline, the main pattern support, has been broken. Trading volume continues to be high and the bearish bias strong.
There is more. It is the first time Bitcoin Dominance breaks below EMA55 weekly since June 2022. Coming from a high point, this event happened January 2021, the start of the previous bull market. The same signal again now means the start of the current bull market.
It is already happening, it is already confirmed.
It was the same back in 2021. In January/February 2021 it was already happening and it was already confirmed that Crypto was having a major bull market. Bitcoin was already trading near its previous all-time high. Market conditions are the same. Bitcoin is about to grow 20%. While Bitcoin grows this much, the altcoins will grow between 300 and 600%. Then Bitcoin will take a pause and the altcoins will continue to grow. Ether is likely to go beyond 10K.
Crypto is going up. This is the best possible ever. Your life can forever change.
Take a minute to think.
Stop for a moment. Engage your mind and visualize... What type of results can you produce?
What would you do if you knew with a high level of certainty that Crypto is going up? How would you take advantage of this information? What type of actions are you taking now to maximize profits in this bullish wave?
It is not about being bearish or bullish, it is about adapting to what is happening. Crypto is going up; Are you in or are you out?
Namaste.

Ethereum's Hits New All-Time High · Next Target $7,332Ether (ETH) is approaching its 2021 all-time high and wow!, this is awesome, think about it. One day we are witnessing a correction, Ethereum crashing for years lower below $2,000 and then even lower, below $1,500 and then what? After just several months Ethereum is already trading way high above $4,500 and ready to hit a new all-time high, catching up to Bitcoin and XRP; the rest of the altcoins market will follow.
Yes, a new all-time high but that was never the goal. The previous peak is only a resistance point, a reference point which we use to know how good we are doing, how far advanced we are in the current cycle but it is never the end. The all-time high is meant to be broken in each cycle and this is exactly what we are seeing today.
As soon as ~$4,900 breaks, ETHUSDT is likely to continue to straight up to face resistance right around $6,000. Stops should be just like the past. A few days red or sideways then back green. Always up with maximum force, the entire move.
The main resistance for this current advance is $7,332 but for the current cycle, new and updated numbers based on current market action and fresh data suggests that $11,318 is a possible target based on standard cryptocurrency bull market action. That is, we don't even need an extraordinary bull market to make Ethereum worth $11,111 per Ether token.
Ok. Market conditions look great. It's been a long ride... We've been tracking Ethereum for so many years now and this entire bullish recovery, cycle and wave. Let's continue to ride the market together... Let's trade!
Namaste.

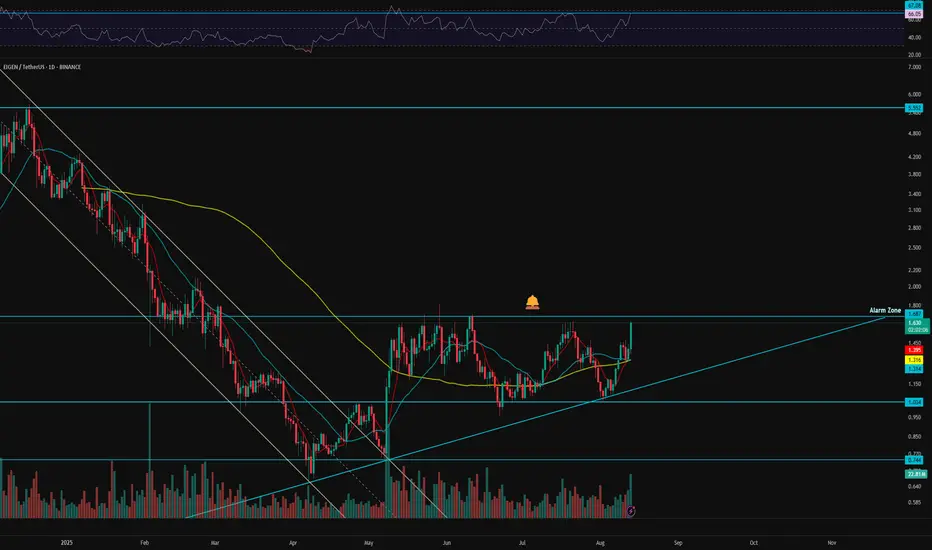
EigenLayer Daily view| DeFi’s Ethereum Restaking Power💀 Hey , how's it going ? Come over here — Satoshi got something for you !
⏰ We’re analyzing EIGEN on the 1-Day timeframe , this coin ranks 132 on CoinMarketCap. It’s a restaking project on the Ethereum network, highly valued and reputable in the DeFi space, and backed by well-known Ethereum developers .
👀 After breaking out of a strong descending channel, this coin moved toward its resistance zone at 1.687 within just three days under strong buying pressure. It was then rejected from this level and formed a bottom at 1.034. This bottom is close to a drawn trendline, and the latest touch of this trendline triggered many buy orders, bringing in significant buying momentum. The key zone for entering a trade is the resistance area that has seen roughly five reactions, each time resulting in rejection. If this daily box breaks, the coin could move to higher price levels.
👑 The 7-day moving average has crossed above both the 25-day and 99-day moving averages, indicating strong buyer power and upward momentum. Moving averages are often used for martingale strategies and as setup confirmations.
⚙️ On the RSI, the key resistance lies around 67.08. A breakout above this level increases the chance of entering the overbought zone, though the major strong resistance is at 70.
🕯 Both trading volume and transaction count are rising, and usually, for coins considered “Ethereum ecosystem projects,” volumes can spike sharply when Ethereum dominance falls.
🔔 We’ve set an alert zone at the 1.687 resistance level. When the price reaches this zone, you can watch the price action and, with confirmation, consider entering a trade.
🖥 Summary : If EigenLayer breaks the 1.687 zone, it could reach much higher price levels. Since it offers a restaking product to the crypto community, it has the potential for strong price surges, as most of its past pumps have happened within just a few candles—even one candle. Don’t forget to set your alert at 1.687 .
❤️ Disclaimer : This analysis is purely based on my personal opinion and I only trade if the stated triggers are activated .

ETH at resistance!Ok, finally ETH is making happy all his estimators but I jsut want to point out that it's close to ATH so maybe wait to see what happens before buying it. I'd wait for some short setup unless there's a stronk breakout!
I expect something like what I drawn there. I don't own a lot of ETH but remember that after ETH money will flows in big caps alts and that will make us happy.
Good luck!

BTC | Long Idea – All-Time Highs LoadingBTC | Long Idea
📊 Market Sentiment
Overall sentiment remains bullish, supported by expectations of a 0.25% rate cut in the upcoming FOMC meeting. A weakening USD and increasing global risk appetite are providing favorable conditions for further upside in crypto assets.
📈 Technical Analysis
Price formed a 4H demand zone and immediately retested it, showing a strong bullish reaction.
That retest offered a perfect entry, but there’s still potential for another move back to the demand zone before pushing higher.
The 1H swing low liquidity sits in confluence with both the 4H demand zone and the 0.5 Fibonacci retracement level — a strong triple confluence.
This alignment occurs around the $120,000 level, making it a key watchpoint.
📌 Game Plan
Wait for price to revisit the 4H demand zone.
Look for a sweep of the 1H swing low liquidity.
See the 0.5 Fibonacci level tapped for maximum discount before continuation.
🎯 Setup Trigger
Look for a 1H market structure break after price taps the $120,000 confluence zone.
📋 Trade Management
Stoploss: Below the 1H swing low that confirms the break of structure.
Target: Direct push towards all-time highs at $123,300.
💬 Like, follow, and comment if you find this setup valuable!
Disclaimer: This is not financial advice. The content is for informational and educational purposes only and reflects personal opinions.

ETH | Long Idea - All time highs soonETH | Long Idea
📊 Market Sentiment
Overall sentiment remains bullish, supported by expectations of a 0.25% rate cut in the upcoming FOMC meeting. A weakening USD and increasing global risk appetite are creating favorable conditions for further upside in crypto assets.
Ethereum is approaching all-time highs, fueled by a $1B single-day ETF inflow. Additionally, rumors of potential SEC approval for Ethereum staking policy could directly boost ETH’s utility — strengthening the long bias.
📈 Technical Analysis
Price is climbing steadily after sweeping LTF liquidity.
Retracements have been shallow due to strong momentum and market hype.
All-time highs are now clearly an institutional / smart money target.
📌 Game Plan
Watch for a sweep of 1H swing lows / equal lows at $4,605 followed by a bullish rejection.
Alternatively, 12H FVG at $4,561 could be taken before rejection — both liquidity runs are valid watchpoints.
🎯 Setup Trigger
Look for a 1H break of structure after liquidity grabs at the mentioned levels.
📋 Trade Management
Stoploss: 1H swing low that confirms the break of structure.
Target: Direct move towards all-time highs at $4,868.
💬 Like, follow, and comment if you find this setup valuable!

ETHFI | Swing Long Idea - AltcoinETHFI | Swing Long Idea
📊 Market Sentiment
Overall sentiment remains bullish, supported by expectations of a 0.25% rate cut in the upcoming FOMC meeting. A weakening USD and increased global risk appetite are creating favorable conditions for further upside in crypto assets.
ETHFI moves in close correlation with Ethereum’s price action. As ETH approaches all-time highs, fueled by a $1B single-day ETF inflow, ETHFI is also showing strong bullish potential.
Additionally, rumors about possible SEC approval of Ethereum staking policy could significantly increase ETHFI’s utility in the future — adding conviction to a long bias.
📈 Technical Analysis
Price broke a HTF key resistance and closed above.
The retest of this level confirmed it as strong support.
Price also broke the HTF bearish trendline, followed by a successful retest and bullish rejection.
📌 Game Plan
Long position entered at $1.2730 after rejection from the retest of the broken bearish trendline.
📋 Trade Management
Stoploss: Daily close below $1.14
Targets:
TP1: $1.41
TP2: $1.65
Trail stops aggressively to lock in profits as price moves favorably.
💬 Like, follow, and comment if you find this setup valuable!

Bitcoin vs Ethereum | 15-20k$ ETH? same chart, same psychology .
- after bullrun price dropped ~80%, we have a bottom
- recovery to resistance level
- retesting the bottom cycle with breaking news
The chart shows the same price psychology.
