Break below ascending support will go to next support levelLook for more downside if Delta Air line trade and closed below the ascending support line + Delta Variant Cases spike.
Eying around $35
DAL

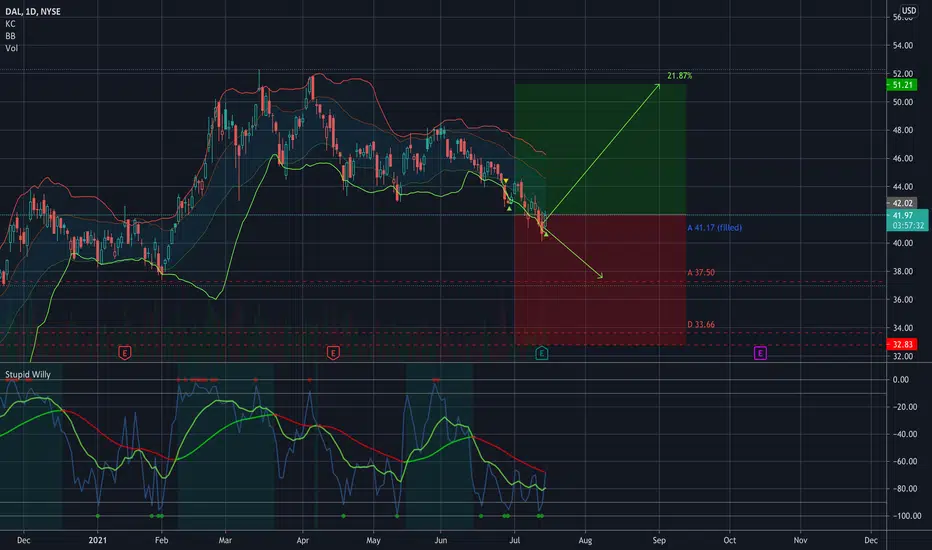
🟢 $DAL Target 51.21 for 21.87% (Risk Level - LOWER MED)🟢 $DAL Target 51.21 for 21.87% (Risk Level - LOWER MED)
Next add at 37.50
Or double position at 32.83
I posted this one yesterday but they I got the dreaded 24 hr TV flag restriction 😬 I couldn't chat either 🤣... haha... it's ok...
-----
—
On the far right of the chart is my Average (Grey) Current Target (Green), and Next Level to add (Red) Percentage to target is from my average.
Numbers with an A are places that are a good idea to add if you can.
Numbers with a D are places where you should double your position.
I start every position with .5 - 1% of my account and build from there as needed and as possible.
I am not your financial advisor. Watch my setups first before you jump in… My trade set ups work very well and they are for my personal reference and if you decide to trade them you do so at your own risk. I will gladly answer questions to the best of my knowledge but ultimately the risk is on you. I will update targets as needed.
GL and happy trading.
DAL - ready for a breakoutwave 4 reached a logical target.
Price taget: 60-63
Bearish invalidation at 37 USD

DOW moves to all time high of 37kBad news aside, IYT is what pushes the DOW to 37k. IYT got pummeled back in June losing alot of ground. Airlines and Railroads have finally found their footing, basing, and slowly climbing up this past week. IYT to 300 soon!

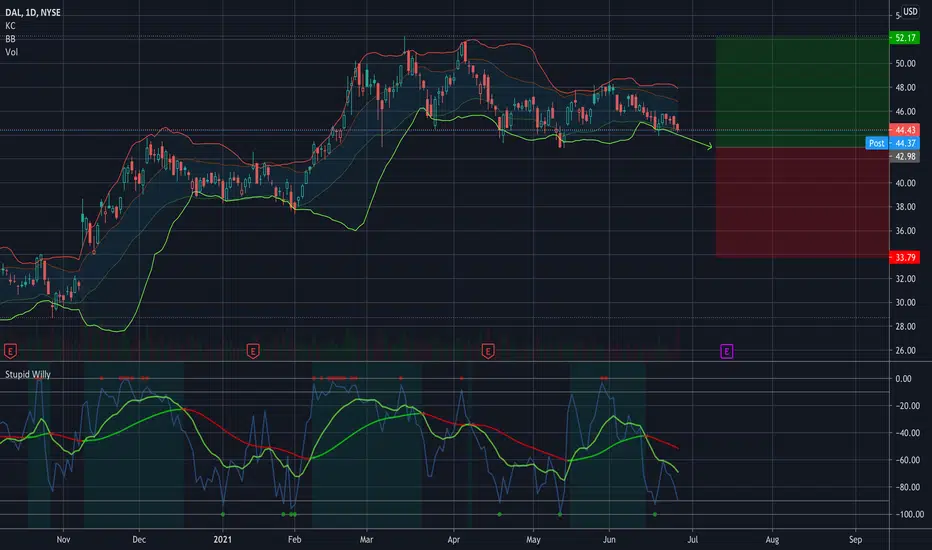
WATCHING $DAL for ENTRY TARGET @ 42.98 WATCHING $DAL for ENTRY TARGET @ 42.98
I’m practicing to really nail my entries better… if it hits 42.98 I'll play.
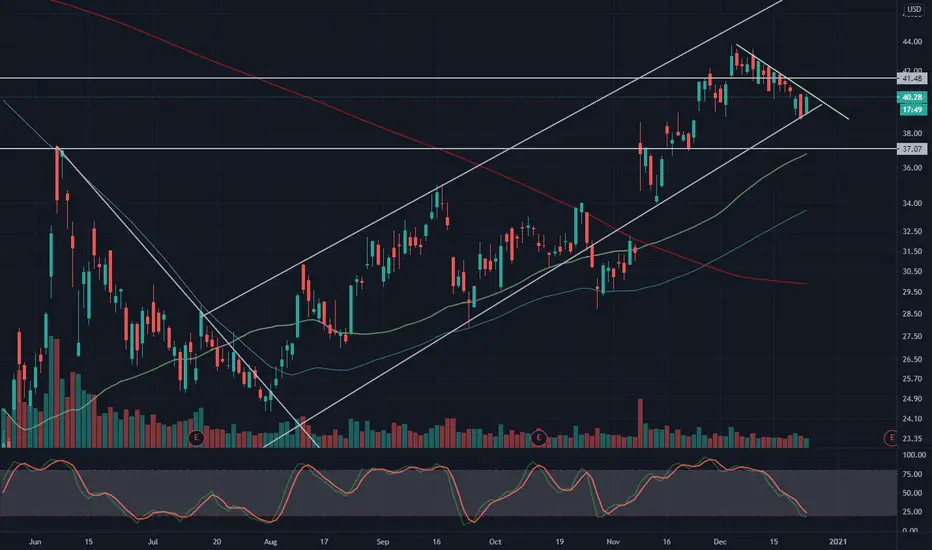
AAL - Airlines recovery, BUY opportunityWe can see a nice wedge breakouts on rising volume in airlines.
Fundamentally, we should take into a consideration deffered demand on trips due to COVID restrictions. Combined with Technical Analysis it means that airlines have space to growth.
I am publishing this idea a bit later then I should, but still it is a great buy opportunity.
Keep in mind your possible risks. Probably AAL will give a chance to take a large position on retest (level 22.30). Stop Loss 21.00

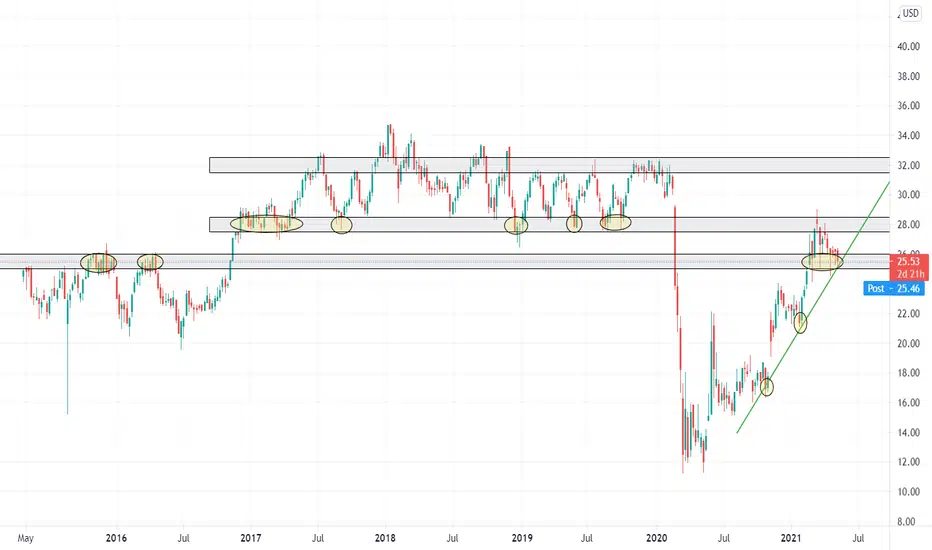
$JETS - Recovery of the Airline Industry“The U.S. Global Jets ETF $JETS provides investors access to the global airline industry, including airline operators and manufacturers from all over the world.”
TECHNICALS
$JETS is currently trading at $25.50 which is 13% below their most recent high of $28.98 which was made in March 2021. The stock has been in an upward trend since October 2020 as a result of increased vaccinations around the world and strong guidance. As seen on the chart, between 2017 and early 2020 $JETS established a strong support zone between $27.50 and $28.50. With travel expected to increase into the summer and vaccinations continue to be rolled out, $JETS can potentially see a 10% move and settle between $27.50 and $28.50 in the coming months.
RECOVERY
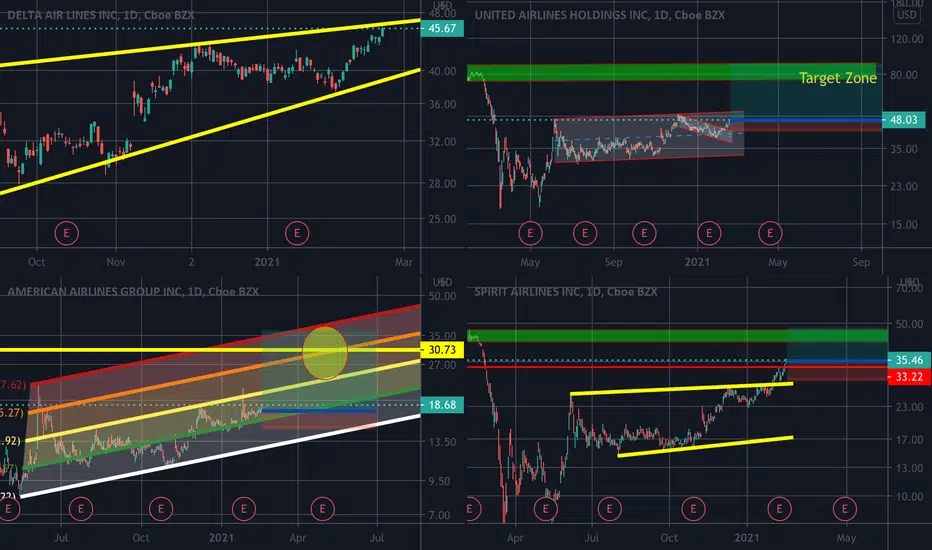
Based on their most recent earnings reports, airline companies such as $AAL, $DAL, $LUV, and $UAL have all posted that their revenue is up 100% or more from their pandemic lows. Although revenue is sitting around 50% of pre-pandemic levels, the growing number suggests that the industry is recovering.
RISKS
The greatest risk to the travel industry at the moment is the massive increase in covid cases in India and the emergence of the new covid variant B.1.617. Although much more information is needed, the new variant appears to be spreading at a much faster rate than before and it is unknown if vaccines will help prevent the contraction of the virus.
Anthony, OptionsSwing Analyst
Airlines lagged as Dow Transports move upFEDEX and UPS have moved up alot in recent days along with some other dow transports. Airlines have lagged behind with no bids. This week, look for Airlines to move out of oversold conditions to move Dow higher. News will break out as passengers return to flying domestically. Volume will pick up accordingly. Breach 46.70 with volume, look out 52!

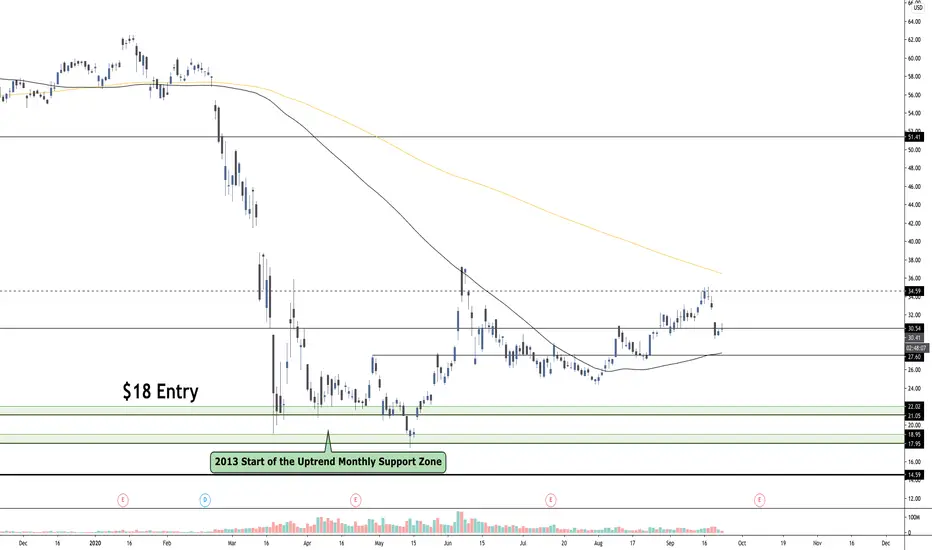
DAL Keep ClimbingAirlines and other travel based companies definitely got hit the hardest from covid and are still slowly recovering where as other stocks have already recovered and more.
First signaled $18 entry which was a 2013 start of the uptrend and is a monthly level support zone. aka very strong level
Next Best entry placed at $27.60
Target $30.54
Next Target $34.59
Eventual Target $51.41
please don't dump on me Ed Bastian i love delta good airline, my first choice for flying
DAL SwingDAL along with the rest of the travel sector is catching some big buyers as the economy is shifting to its reopening phase. Look for some strong movements along the next couple of weeks as the chart is preparing for a big move too. Sitting directly under the 20EMA and a perfect bounce off the 50 - the stock also caught many buyers yesterday exactly off of the resistance, which is also a sign of strength.


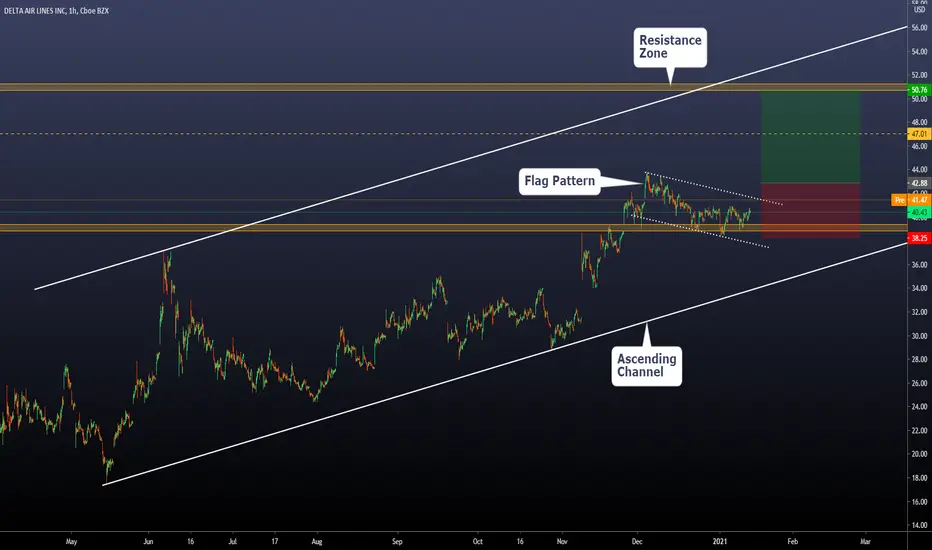
Flag Pattern on Delta Airlines - Bullish breakout expectedToday we will make a Daily and a 1h analysis on Delta + the setup we will take on this asset.
Daily Chart:
On the daily chart, we can see a Clear support zone and a resistance zone. The price is above the support zone, and we can project a bullish movement towards the next zone (Resistance)
On the 4hs chart, we will understand the setup:
Here we can see a Flag Pattern above the support zone.
Flag Patterns are considered continuation structures. That means that if we have a breakout of it, we can expect a continuation of the previous trend.
Our entry-level is a stop order at 42.88 / Stop level is at 38.25 / Break-even level is at 47.01 / Take profit at 50.76
The risk-reward ratio on this setup is 1.7, and we expect a resolution of 30 days.
If the price goes below the stop level without executing the setup, we will consider that the view is no longer valid.
Thanks for reading!
I am boarding the plane #stocksDelta has been hovering above its range for over a month now and I am looking for take into earnings. Assuming the breakout/trend to the upside will continue, I am hoping earnings will provide a catalyst for the stock to head toward 45. I don't think the numbers themselves will be good but I am hoping the have positive guidance about people traveling post the vaccine.

THE WEEK AHEAD: KBH, DAL, ICLN, SLV, EWZ, KRE, XLE, IWM/RUTEARNINGS:
There aren't a ton of earnings next week. Some financials are announcing, but I generally don't play those a ton for volatility contraction, since they never really frisk up that much, and all are below 50% 30-day implied here. KBH provides the best bang for your buck with the implied metrics I'm generally looking for (>50%), followed by DAL. Both, however, are at the low end of their 52-week range, in part due to the massive vol spike we experienced in March, which will make that metric somewhat misleading here.
KBH (18/56/14.5%),* Tuesday after market close.
DAL (7/53/12.9%), Wednesday before market open.
C (17/44/9.8%), Friday before market open.
JPM (14/32/7.8%), Friday before market open.
WFC (22/44/10.6%), Friday before market open.
EXCHANGE-TRADED FUNDS RANKED BY PERCENTAGE THE FEBRUARY 19TH AT-THE-MONEY SHORT STRADDLE IS PAYING AS A FUNCTION OF STOCK PRICE:
ICLN (14/79/20.0%)
SLV (31/48/11.3%)
EWZ (16/44/10.6%)
XLE (22/41/10.2%)
KRE (17/42/9.9%)
BROAD MARKET:
Pictured here is an IWM short put out in March at the strike paying at least 1% of the strike in credit. An IRA trade, I would look to roll up intraexpiry to lock in realized gain with >45 days 'til expiry, take profit on approaching worthless (<.20), and sell call against if assigned. Currently 67 days 'til expiry, it is understandably a bit long in duration, but I already have some on in the February monthly.
IWM (26/34/7.6%)
QQQ (21/31/6.9%)
DIA (14/24/5.2%)
SPY (11/24/5.0%)
EFA (14/21/4.7%)
* -- The first metric is the implied volatility rank or percentile (i.e., where implied is relative to where it's been over the past 52 weeks); the second, the 30-day implied volatility; and the third, what the at-the-money short straddle is paying as a function of the stock price.

DAL: Long now at 39, SL at close below 37, PTs - 45, 48, 51Broke out few weeks ago, consolidating, came down on lower volume. Ideal buy will be around 37, but can take a position now at 39 for a decent R/R


RCL and DAL BULLISH Recovery StocksSome price action this week got me very interested in stocks that were all the rage through the pandemic trading in 2020. NYSE:RCL is a trade I posted about yesterday that was up 4% on the day today. I like this price action to go more. NYSE:DAL is another stock in recovery that a friend had me look at and it has almost identical price action. He also took a LONG date option and I love it... he's getting PAID FOR PATIENCE!

Delta Air lines Inc. LONG📈 NYSE:DAL LONG H4
🛒BUY above = 31.43
🎯Target1 = 32.54
🎯Target2 = 33.23
🛑Trailing Stop loss = 29.62
❌Cancel trade and open reverse trade = 29.62
🙈Recommended risk = 1-2%

𝗧𝗿𝗮𝗻𝘀𝗽𝗼𝗿𝘁𝘀 𝗨𝗽𝗱𝗮𝘁𝗲: $DJT Weekly. False Breakout?Got the new highs, but a false breakout? If so, should revisit $10K or lower soon
$TRAN $IYT $FDX $AAL $UAL $DAL $LUV $EXPE $SPY $SPX $ES_F $VIX $DIA $DJI $YM_F #Stocks #Transports 🛫

DELTA AIR LINES INC. LONG📈 NYSE:DAL LONG H4
🛒BUY above = 33.30
🎯Target1 = 34.80
🎯Target2 = 35.70
🛑Stop loss or cancel trade = 30.90
🙈Recommended risk = (2%-3%)
