EURUSD 3-7Nov NFP week. Two gates decide it: 1.1525 and 1.1635If you trade EURUSD only one week at a time, clarity beats prediction. We closed Friday around 1.1535, near the lower edge of the October range. That puts the pair in a simple state. The market is either building a base above 1.1525 and preparing to challenge 1.1635, or it is slipping back into the mid 1.14s where liquidity sits. I am not here to guess. I am here to define the levels, the triggers, and the discipline that keeps the drawdown small while leaving room for upside if momentum appears.
What matters this week
The calendar clusters the real moves around the US session. Expect a faster tape around midweek and into Friday jobs data.
The driver under the hood is still rate spreads. If yields firm and the dollar catches a bid, 1.1525 is the first line of truth.
The plan uses a two gate structure. Lose the lower gate and you trade short toward the next support shelf. Reclaim the upper gate and you trade long toward the next resistance shelf. Between the gates you keep risk tiny or flat.
Levels that define the week
• Support map: 1.1525 then 1.1500 then 1.1450 then 1.1400 to 1.1350
• Resistance map: 1.1575 then 1.1635 then 1.1700 then 1.1760
Plot them on H4 and H1. Add session separators. Shade the October value area if you keep a volume profile. This gives you a visual spine for every decision.
How I will trade it
I treat 1.1525 to 1.1575 as the neutral band. I call it the noise strip. Inside this band I either reduce size to a probe or I do nothing. I want confirmation from the tape before I put real risk on.
Long idea, momentum reclaim
Base above 1.1575 for at least thirty minutes.
Hold above the level through one pullback. The first pullback must find buyers above 1.1560.
Enter long on a clean break and retest that holds, or on a strong close above 1.1600 if the retest never comes.
Initial stop goes below the pullback low or one H4 ATR from entry. If you prefer structure, use 1.1555.
First target is 1.1635. Take partials there. If momentum remains healthy, let a runner work toward 1.1700.
Invalidation is a close back under 1.1575 after entry. If that happens you flatten without debate.
Short idea, downside continuation
Lose 1.1525 on expanding range.
Do not chase the first break. Wait for a retest from below that fails near 1.1525 to 1.1535.
Enter short when the retest stalls and H1 rolls over.
Initial stop above 1.1550 or one H4 ATR from entry.
First target is 1.1500. If that gives way, work the position into 1.1450. Keep a measured pace around 1.1450 to 1.1400 since liquidity often lives there.
Invalidation is a clean close back above 1.1525 after entry.
Position sizing and risk
The metric to respect this week is Return divided by Drawdown. You can call it R over D. Aim for R over D above one on each trade and above one for the week. That means you size entries so that a normal loss on a single attempt costs less than half of the average win to the next level. Use a fixed fraction per trade or a volatility target based on H4 ATR. For most day traders in majors the sweet spot is one half to one percent of account risk per idea. If your first two attempts fail, you cut size in half for the third. This alone keeps you in the game when the band chops you.
Execution windows
London open often sets the day’s path but New York confirms it. I give more trust to signals that survive the US open.
News minutes are not bravery minutes. If you open a new position inside a data bar you accept slippage as the price of impatience. My rule is simple. Ten minutes before a tier one release I stop initiating new risk unless the trade is already well in profit.
The week closes on Friday with higher volatility risk. If you are green, pay yourself. If you are red, do not try to make it back during the last hour.
Common mistakes to avoid
Trading inside the noise strip with full size.
Averaging down inside the strip when the market is waiting for the next data impulse.
Taking profits early at the first ten pips then giving the rest back on a late chase.
Forgetting that levels are areas not single prints. Build a cushion into stops and entries.
Checklist for your chart
H4 and H1 with session separators.
Lines at 1.1525, 1.1575, 1.1635, 1.1700, and the mid 1.14 shelf.
One ATR measure on H4 for dynamic stops.
A simple label on the chart that says R over D target greater than one.
Optional view. A rates panel or at least a ten year yield overlay on a side chart to keep the macro driver in sight.
I will update the levels only if the market prints fresh structure. Until then the plan is to let price prove direction at the gates and to trade only when the proof is there. If you prefer fewer decisions, pick a single gate for the week. Many traders do well with a one side rule. They only trade longs above the upper gate or only trade shorts below the lower gate. That cuts noise and keeps focus tight.
Reminder
Education and analytics only. No advice. No guarantees. Process beats prediction.
Daytrade

US30 (1H) — Demand Zone Mapping & Bullish ScenariosHere’s my latest mapping for US30 on the 1-hour timeframe.
After a strong bullish impulsive move, I’m now watching for a potential retracement to one of the key demand zones before the next leg higher.
Zone 1: 47,100 – 47,000
This is the nearest demand zone and the first area where buyers might step in again.
If price holds here and forms a bullish reaction (e.g., engulfing candle or strong wick rejection), I’ll be watching for a possible continuation toward 47,750 – 48,100.
This level aligns closely with the 0.236 Fibonacci retracement, so it could serve as a shallow pullback for aggressive buyers.
Zone 2: 46,850 – 46,700
This zone sits around the 0.5 Fibonacci retracement, which usually acts as a more balanced correction area.
If price rejects Zone 1 but finds support here, it could form a stronger base for a continuation rally.
I’ll be monitoring this level closely for a cleaner structure before re-entry.
Zone 3: 46,600 – 46,400
This deeper zone overlaps with the 0.618–0.786 Fibonacci area, often referred to as the “golden pocket.”
If the market extends its retracement this far, it could present a high-probability buy setup—especially if liquidity sweeps below the previous low before reversing upward.
This would indicate smart money accumulation before a potential breakout.
Upside Targets
If bullish momentum continues, my key upside targets remain:
47,430 (0.27 ext)
47,750 (0.618 ext)
48,100 (1.0 ext)
I’ll look for confirmation and structure before committing to any position.
Bias remains bullish unless price breaks below 46,300, which would invalidate this short-term outlook.
Summary
I’m expecting a short-term pullback followed by a continuation toward new highs.
The goal is to wait patiently for price to come to the demand zones instead of chasing moves.
Plan the trade. Wait for confirmation. Execute with discipline.

CORZ daily resistance breakout!🔉Sound on!🔉
📣Make sure to watch fullscreen!📣
Thank you as always for watching my videos. I hope that you learned something very educational! Please feel free to like, share, and comment on this post. Remember only risk what you are willing to lose. Trading is very risky but it can change your life!

TSLA (daytrading) 2 plan for itPlan 2 could be possible because:
(p1 price is on sma 50 d1,p2 could be sma 200)
TSLA still has a small gap below that might need to be filled.
This week doesn’t look good for the overall market.
I will continue to watch it closely

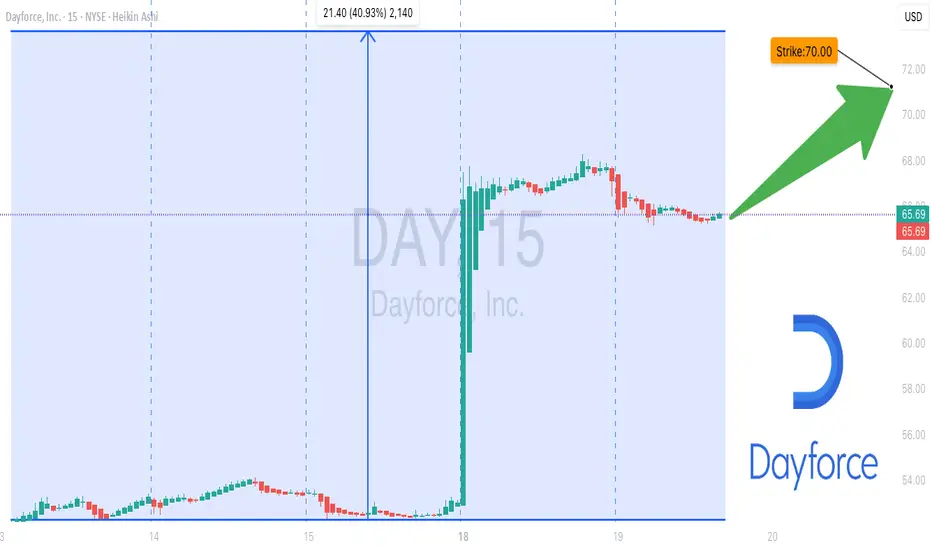
DAY $70C to the Moon? Options Setup Inside
# 🚀 DAY Weekly Options Setup | \$70C to the Moon? 🌙🔥
💡 **Ticker**: \ NYSE:DAY (Dayforce Inc.)
📅 **Setup Date**: Aug 19, 2025
🎯 **Play**: Weekly CALL Option
---
## 📊 Trade Setup
* 🔥 **Strike**: \$70.00
* ⏰ **Expiry**: Sep 19, 2025
* 💵 **Entry**: \$1.35 (midpoint target)
* 🛑 **Stop Loss**: \$0.54 (-40%)
* 🎯 **PT1**: \$2.00 (+50%)
* 🎯 **PT2**: \$2.70 (+100%)
* 📈 **Confidence**: 75%
---
## 🔎 Why Bullish?
✅ Rising Daily & Weekly RSI
✅ 1.4x Volume Surge = Institutional Buying
✅ Low Volatility = Cleaner Trend
✅ All models aligned: **Strong Bullish Momentum**
---
## ⚠️ Risks
* RSI overbought zone → short-term pullback risk
* Weekly options = higher volatility ⚡
META daily updade(swing) Meta after break out is going retest the flag.
have 2 important point to get in.
ready to entry and watch out could fake break out.

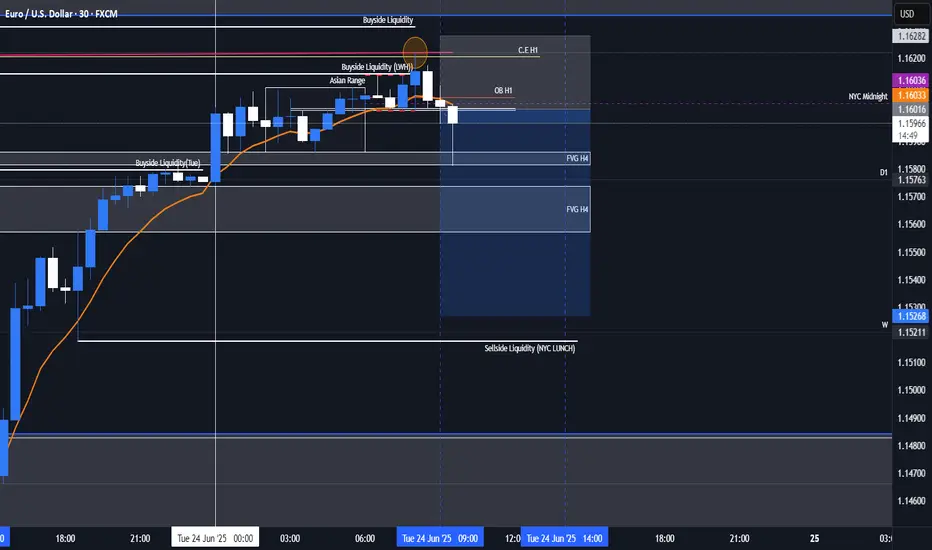
EURUSD Intra-day ShortEURUSD is in a long-term pivot to go short but the market is still in a accumulation phase of collecting orders and so we are still not in the position yet to commit to longer targets. We are looking at short term draw on liquidity like yesterday's NYC session and are accounting for a possible accumulation there after to the upside potentially.

OptionsMastery: Daily resistance on UBER! 🔉Sound on!🔉
📣Make sure to watch fullscreen!📣
Thank you as always for watching my videos. I hope that you learned something very educational! Please feel free to like, share, and comment on this post. Remember only risk what you are willing to lose. Trading is very risky but it can change your life!

OptionsMastery: Daily Resistance on TGT!🔉Sound on!🔉
📣Make sure to watch fullscreen!📣
Thank you as always for watching my videos. I hope that you learned something very educational! Please feel free to like, share, and comment on this post. Remember only risk what you are willing to lose. Trading is very risky but it can change your life!

FREE Day Trade Setup 15April: $NVDA🚨 FREE Day Trade Setup: NASDAQ:NVDA 🚨
🚀 Bullish Scenario:
Entry: Break above $111.88 (S/R Area)
🎯 Targets: 10% / $112.70, $114.05, PDH
📈 Instruments:
Options: April 18th $112 Calls
🚪 Exit: Close below H5 on chosen timeframe (2m / 5m / 15m)
📉 Bearish Scenario:
Entry: Break below PDL at $109.07
🎯 Targets: 10% / $108.01, $106.92, $105.77
📉 Instruments:
Options: April 18th $109 Puts
🚪 Exit: Close below H5 on chosen timeframe (2m / 5m / 15m)
Not Financial Advice

AUDCHFAUDCHF Potential Buy Idea as Price has overall changed the trend from Bearish to Bullish by forming a Head & Shoulder Pattern,
Now we have a clean Structure HH/HL and Price has Retraced back to 60% of the Previous Push.

FREE $QQQ Day Trade Setup!🚨 FREE NASDAQ:QQQ Day Trade Setup:
Break below $460.71 (Pre-Market Low)
🎯 $458/ $455
Options: April 1st $460 Puts
Ride H5_D on 2Min. chart. (Close above H5 is an Exit)
Retest PDL (Friday Low) = Look for a rejection
🎯Pre-Market Low
Play April 1st $466 Puts
Not Financial Advice


egld setup"🌟 Welcome to Golden Candle! 🌟
We're a team of 📈 passionate traders 📉 who love sharing our 🔍 technical analysis insights 🔎 with the TradingView community. 🌎
Our goal is to provide 💡 valuable perspectives 💡 on market trends and patterns, but 🚫 please note that our analyses are not intended as buy or sell recommendations. 🚫
Instead, they reflect our own 💭 personal attitudes and thoughts. 💭
Follow along and 📚 learn 📚 from our analyses! 📊💡"

THIS BINANCE COIN CAN BREAK TO 1 USD UNEXPECTEDTHIS BINANCE COIN CAN BREAK TO 1 USD UNEXPECTED
We will follow for 1 week if this coin is able to return 1 USD. the following will be max 1 week.


XYRO/USDT NEW VOLUMEXYRO/USDT NEW VOLUME
High riks coin, same time its a coin which can show new volume coming time

Day Trading: A Comprehensive GuideDay trading is a dynamic trading style that attracts many traders, particularly those looking to capitalize on short-term market movements. Unlike other trading strategies that span days, weeks, or even months, day trading involves executing trades within the same trading day, taking advantage of price fluctuations throughout that period. This guide will explore the essence of day trading, its strategies, pros and cons, and tips for success, delving deeper into the intricacies of the market and the techniques required to navigate it effectively.
What is Day Trading?
Day trading involves the buying and selling of financial instruments within a single trading day. Traders do not hold positions overnight; instead, they aim to profit from daily market movements. This approach is particularly appealing to novice traders, who may believe that frequent trades can exponentially increase profits. However, the fast-paced nature of day trading requires discipline and a solid trading plan, as emotional decision-making can lead to significant losses.
Traders typically utilize various time frames, often ranging from one minute (M1) to one hour (H1). While beginners may gravitate towards shorter time frames like M5 or M15, these often result in increased noise and the potential for quickly hitting stop-loss orders. Successful day traders understand that consistent profitability stems from maintaining discipline and developing a robust trading strategy rather than chasing quick wins.
Understanding Market Psychology
Market psychology plays a significant role in day trading. Fear, greed, and anxiety are the primary emotions driving investor behavior, leading to price movements. Traders must remain aware of market sentiment, gauging the mood of other traders and market participants. This involves:
1. Sentiment Analysis: Assessing current market sentiment can help traders position themselves correctly. Bullish sentiment often leads to higher prices, while bearish sentiment causes prices to drop.
2. Economic Indicators: Monitoring economic indicators and news releases helps traders anticipate potential price movements, influencing their trading decisions.
3. Support and Resistance: Key support and resistance levels indicate areas of price stability and potential for price reversal.
Read also:
--- Strategies for Successful Day Trading ---
To thrive in day trading, adherence to particular strategies is essential. Here’s a look at some of the most common techniques employed by day traders:
1. Scalping
Scalping is one of the oldest and most popular strategies in day trading. It involves making numerous trades throughout the day to capture small price movements. Scalpers analyze charts and execute quick trades based on technical indicators, entering and exiting positions in mere minutes. This method thrives in low-volatility environments, where assets tend to fluctuate within tight ranges, allowing traders to realize small but consistent profits.
Example of Scalping on 5-Minute EURUSD with Simple Moving Average and Standard RSI Indicator
2. Reverse Trading
Reverse trading capitalizes on market range-bound conditions. Traders identify key support and resistance levels and execute trades based on the price retracing from these points. This strategy typically requires a combination of technical analysis and an understanding of fundamental data. It's crucial to remain vigilant about scheduled news releases, as these can create sudden price surges or drops that impact positions.
Read also:
3. Momentum Trading
Momentum trading relies on the strength of existing price movements. This strategy involves entering trades in the direction of a prevailing trend, often guided by fundamental analysis and technical indicators such as Moving Averages. Traders monitor economic news and events that may influence market dynamics, utilizing these insights to execute long or short trades accordingly.
Read also:
4. Range Trading
Range trading involves buying an asset when its price falls to the lower boundary of a trading range and selling when it reaches the upper boundary. This strategy requires a keen eye for identifying support and resistance levels and a deep understanding of market volatility.
Read also:
Pros and Cons of Day Trading
Day trading comes with a distinct set of advantages and challenges. Here’s a balanced view of its pros and cons:
Pros:
- Access to Capital: Traders can start day trading with lower capital requirements since each trade can yield a profit in just a few pips.
- Flexibility: Traders have control over their trading schedule, allowing them to choose when and how long to engage in trades.
- Potential for High Returns: Successful day trading can produce significant profits compared to longer-term strategies, provided that trades are executed prudently and systematically.
Cons:
- High Risk: Day trading is inherently risky, especially for those inexperienced in market dynamics. The potential for quick losses is significant.
- Psychological Pressure: The fast-paced nature of day trading can lead to emotional decision-making, which can derail even the most disciplined traders.
Read also:
- Time Commitment: Day traders must be patient and ready to dedicate long hours to monitoring the markets, which may not suit everyone.
- Commissions and Fees: Trading frequently can lead to increased commissions and fees, eating into potential profits and making it essential to maintain a high win-to-loss ratio.
Managing Risks in Day Trading
Risk management is paramount to surviving in the world of day trading. Here are some risk management techniques to consider:
1. Position Sizing: Proper position sizing is critical to risk management in day trading. This involves allocating the right amount of capital to each trade to minimize the impact of potential losses.
2. Stops and Limits: Traders use stops and limits to limit potential losses. Stops are triggered when prices reach a predefined level, closing out the position, while limits are triggered when prices reach a certain level, closing out the position.
3. Risk Reward Ratio: Setting a risk reward ratio helps traders maintain profitability. This involves setting a ratio of reward to risk, typically around 1:3 to 1:4.
Read also: /b]
and..
and...
Conclusion
Day trading can be a lucrative venture for those willing to invest time in understanding market mechanics, developing strategies, and exercising disciplined decision-making. While it may appear attractive, particularly for beginners, the reality is that successful day trading requires meticulous planning, emotional control, and a well-thought-out strategy.
For those new to day trading, practicing on a demo account is advised to build skills and confidence. Starting with simpler strategies, such as pullback trading or scalping, can help beginners navigate the complexities of intraday trading. Ultimately, comprehensive knowledge of technical analysis and a clear grasp of market sentiment are critical for achieving consistent success in day trading.
✅ Please share your thoughts about this article in the comments section below and HIT LIKE if you appreciate my post. Don't forget to FOLLOW ME; you will help us a lot with this small contribution.

Fair Value Set UpBeautiful isn’t it? Perfect set up, we have a 1HR FVG that got retraced into and an overlapping PD array in the form of the STH. Entry confirmation will be a order flow leg on the timeframes 3-10 at the Fair Value Line ($2770.29) targeting the short term high of $2918.00. More or less a 5% move depending on entry.

Journey to 53k: Trade Idea Execution 2.4.25Will we see lower prices from here? SL is already at BE and in profits in case price reverses against us.
drop a like and a comment if you like this type of content!
Forex, Crypto and Futures Trading Risk Disclosure:
The National Futures Association (NFA) and Commodity Futures Trading Commission (CFTC), the regulatory agencies for the forex and futures markets in the United States, require that customers be informed about potential risks in trading these markets. If you do not fully understand the risks, please seek advice from an independent financial advisor before engaging in trading.
Trading forex and futures on margin carries a high level of risk and may not be suitable for all investors. The high degree of leverage can work against you as well as for you. Before deciding to trade, you should carefully consider your investment objectives, level of experience, and risk appetite.
There is a possibility of losing some or all of your initial investment, and therefore, you should not invest money that you cannot afford to lose. Be aware of the risks associated with leveraged trading and seek professional advice if necessary.
BDRipTrades Market Opinions (also applies to BDelCiel and Aligned & Wealthy LLC):
Any opinions, news, research, analysis, prices, or other information contained in my content (including live streams, videos, and posts) are provided as general market commentary only and do not constitute investment advice. BDRipTrades, BDelCiel, and Aligned & Wealthy LLC will not accept liability for any loss or damage, including but not limited to, any loss of profit, which may arise directly or indirectly from the use of or reliance on such information.
Accuracy of Information: The content I provide is subject to change at any time without notice and is intended solely for educational and informational purposes. While I strive for accuracy, I do not guarantee the completeness or reliability of any information. I am not responsible for any losses incurred due to reliance on any information shared through my platforms.
Government-Required Risk Disclaimer and Disclosure Statement:
CFTC RULE 4.41 - HYPOTHETICAL OR SIMULATED PERFORMANCE RESULTS HAVE CERTAIN LIMITATIONS. UNLIKE AN ACTUAL PERFORMANCE RECORD, SIMULATED RESULTS DO NOT REPRESENT ACTUAL TRADING. ALSO, SINCE THE TRADES HAVE NOT BEEN EXECUTED, THE RESULTS MAY HAVE UNDER-OR-OVER COMPENSATED FOR THE IMPACT, IF ANY, OF CERTAIN MARKET FACTORS, SUCH AS LACK OF LIQUIDITY. SIMULATED TRADING PROGRAMS IN GENERAL ARE ALSO SUBJECT TO THE FACT THAT THEY ARE DESIGNED WITH THE BENEFIT OF HINDSIGHT. NO REPRESENTATION IS BEING MADE THAT ANY ACCOUNT WILL OR IS LIKELY TO ACHIEVE PROFIT OR LOSSES SIMILAR TO THOSE SHOWN.
Performance results discussed in my content are hypothetical and subject to limitations. There are frequently sharp differences between hypothetical performance results and the actual results subsequently achieved by any particular trading strategy. One of the limitations of hypothetical trading results is that they do not account for real-world financial risk.
Furthermore, past performance of any trading system or strategy does not guarantee future results.
General Trading Disclaimer:
Trading in futures, forex, and other leveraged products involves substantial risk and is not appropriate for all investors.
Do not trade with money you cannot afford to lose.
I do not provide buy/sell signals, financial advice, or investment recommendations.
Any decisions you make based on my content are solely your responsibility.
By engaging with my content, including live streams, videos, educational materials, and any communication through my platforms, you acknowledge and accept that all trading decisions you make are at your own risk. BDRipTrades, BDelCiel, and Aligned & Wealthy LLC cannot and will not be held responsible for any trading losses you may incur.

VINE/USDT DAY TRADE VOLUMEVINE/USDT DAY TRADE VOLUME
has good chance to recovery for day trade to new uptrend

XMR/USDT NEW VOLUMEXMR/USDT NEW VOLUME
It is able to show new uptrend volume in the coming time on day trade.
