AUDCHFAUDCHF Potential Buy Idea as Price has overall changed the trend from Bearish to Bullish by forming a Head & Shoulder Pattern,
Now we have a clean Structure HH/HL and Price has Retraced back to 60% of the Previous Push.
Daytrade

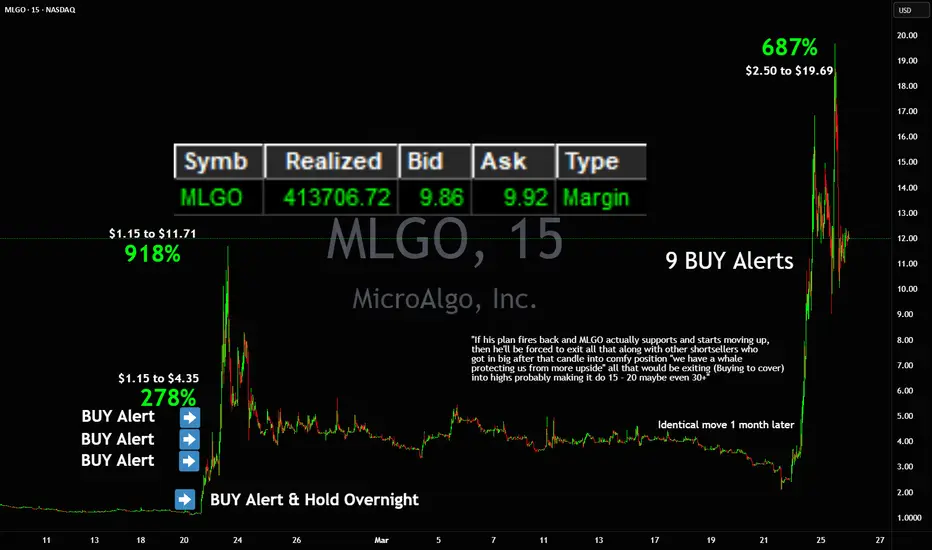
WOW $2.50 to $19.69 in 2 days 687% power squeezeWOW 💥 $2.50 to $19.69 in 2 days 🚀 687% power squeeze on 9 Buy Alerts
First buy at $4.93, last sell at $19.24
I sent commentary about NASDAQ:MLGO what's happening in the background and how I see shortseller behind manipulation losing the battle and blowing up to $15 - $20+ while it was still below $10 🎯
A month ago it triggered the exact move.
FREE $QQQ Day Trade Setup!🚨 FREE NASDAQ:QQQ Day Trade Setup:
Break below $460.71 (Pre-Market Low)
🎯 $458/ $455
Options: April 1st $460 Puts
Ride H5_D on 2Min. chart. (Close above H5 is an Exit)
Retest PDL (Friday Low) = Look for a rejection
🎯Pre-Market Low
Play April 1st $466 Puts
Not Financial Advice


egld setup"🌟 Welcome to Golden Candle! 🌟
We're a team of 📈 passionate traders 📉 who love sharing our 🔍 technical analysis insights 🔎 with the TradingView community. 🌎
Our goal is to provide 💡 valuable perspectives 💡 on market trends and patterns, but 🚫 please note that our analyses are not intended as buy or sell recommendations. 🚫
Instead, they reflect our own 💭 personal attitudes and thoughts. 💭
Follow along and 📚 learn 📚 from our analyses! 📊💡"

correction on my last post Solana Nearing $200: A Potential Day Solana is on the verge of hitting the $200 mark if there is a breakout. For day traders, this could be a great chance to lock in some profits. I’m planning to wait briefly after the breakout to see if it’s just a fake breakout. If the price continues to rise, I’ll open a long position and aim to close it at $200. My stop-loss is currently set at $183 and will be adjusted based on price action, so it eventually moves into positive territory.
What’s your take on this? Let me know!
Stay tuned, and I’ll catch you in the next one — peace!

THIS BINANCE COIN CAN BREAK TO 1 USD UNEXPECTEDTHIS BINANCE COIN CAN BREAK TO 1 USD UNEXPECTED
We will follow for 1 week if this coin is able to return 1 USD. the following will be max 1 week.


XYRO/USDT NEW VOLUMEXYRO/USDT NEW VOLUME
High riks coin, same time its a coin which can show new volume coming time

Day Trading: A Comprehensive GuideDay trading is a dynamic trading style that attracts many traders, particularly those looking to capitalize on short-term market movements. Unlike other trading strategies that span days, weeks, or even months, day trading involves executing trades within the same trading day, taking advantage of price fluctuations throughout that period. This guide will explore the essence of day trading, its strategies, pros and cons, and tips for success, delving deeper into the intricacies of the market and the techniques required to navigate it effectively.
What is Day Trading?
Day trading involves the buying and selling of financial instruments within a single trading day. Traders do not hold positions overnight; instead, they aim to profit from daily market movements. This approach is particularly appealing to novice traders, who may believe that frequent trades can exponentially increase profits. However, the fast-paced nature of day trading requires discipline and a solid trading plan, as emotional decision-making can lead to significant losses.
Traders typically utilize various time frames, often ranging from one minute (M1) to one hour (H1). While beginners may gravitate towards shorter time frames like M5 or M15, these often result in increased noise and the potential for quickly hitting stop-loss orders. Successful day traders understand that consistent profitability stems from maintaining discipline and developing a robust trading strategy rather than chasing quick wins.
Understanding Market Psychology
Market psychology plays a significant role in day trading. Fear, greed, and anxiety are the primary emotions driving investor behavior, leading to price movements. Traders must remain aware of market sentiment, gauging the mood of other traders and market participants. This involves:
1. Sentiment Analysis: Assessing current market sentiment can help traders position themselves correctly. Bullish sentiment often leads to higher prices, while bearish sentiment causes prices to drop.
2. Economic Indicators: Monitoring economic indicators and news releases helps traders anticipate potential price movements, influencing their trading decisions.
3. Support and Resistance: Key support and resistance levels indicate areas of price stability and potential for price reversal.
Read also:
--- Strategies for Successful Day Trading ---
To thrive in day trading, adherence to particular strategies is essential. Here’s a look at some of the most common techniques employed by day traders:
1. Scalping
Scalping is one of the oldest and most popular strategies in day trading. It involves making numerous trades throughout the day to capture small price movements. Scalpers analyze charts and execute quick trades based on technical indicators, entering and exiting positions in mere minutes. This method thrives in low-volatility environments, where assets tend to fluctuate within tight ranges, allowing traders to realize small but consistent profits.
Example of Scalping on 5-Minute EURUSD with Simple Moving Average and Standard RSI Indicator
2. Reverse Trading
Reverse trading capitalizes on market range-bound conditions. Traders identify key support and resistance levels and execute trades based on the price retracing from these points. This strategy typically requires a combination of technical analysis and an understanding of fundamental data. It's crucial to remain vigilant about scheduled news releases, as these can create sudden price surges or drops that impact positions.
Read also:
3. Momentum Trading
Momentum trading relies on the strength of existing price movements. This strategy involves entering trades in the direction of a prevailing trend, often guided by fundamental analysis and technical indicators such as Moving Averages. Traders monitor economic news and events that may influence market dynamics, utilizing these insights to execute long or short trades accordingly.
Read also:
4. Range Trading
Range trading involves buying an asset when its price falls to the lower boundary of a trading range and selling when it reaches the upper boundary. This strategy requires a keen eye for identifying support and resistance levels and a deep understanding of market volatility.
Read also:
Pros and Cons of Day Trading
Day trading comes with a distinct set of advantages and challenges. Here’s a balanced view of its pros and cons:
Pros:
- Access to Capital: Traders can start day trading with lower capital requirements since each trade can yield a profit in just a few pips.
- Flexibility: Traders have control over their trading schedule, allowing them to choose when and how long to engage in trades.
- Potential for High Returns: Successful day trading can produce significant profits compared to longer-term strategies, provided that trades are executed prudently and systematically.
Cons:
- High Risk: Day trading is inherently risky, especially for those inexperienced in market dynamics. The potential for quick losses is significant.
- Psychological Pressure: The fast-paced nature of day trading can lead to emotional decision-making, which can derail even the most disciplined traders.
Read also:
- Time Commitment: Day traders must be patient and ready to dedicate long hours to monitoring the markets, which may not suit everyone.
- Commissions and Fees: Trading frequently can lead to increased commissions and fees, eating into potential profits and making it essential to maintain a high win-to-loss ratio.
Managing Risks in Day Trading
Risk management is paramount to surviving in the world of day trading. Here are some risk management techniques to consider:
1. Position Sizing: Proper position sizing is critical to risk management in day trading. This involves allocating the right amount of capital to each trade to minimize the impact of potential losses.
2. Stops and Limits: Traders use stops and limits to limit potential losses. Stops are triggered when prices reach a predefined level, closing out the position, while limits are triggered when prices reach a certain level, closing out the position.
3. Risk Reward Ratio: Setting a risk reward ratio helps traders maintain profitability. This involves setting a ratio of reward to risk, typically around 1:3 to 1:4.
Read also: /b]
and..
and...
Conclusion
Day trading can be a lucrative venture for those willing to invest time in understanding market mechanics, developing strategies, and exercising disciplined decision-making. While it may appear attractive, particularly for beginners, the reality is that successful day trading requires meticulous planning, emotional control, and a well-thought-out strategy.
For those new to day trading, practicing on a demo account is advised to build skills and confidence. Starting with simpler strategies, such as pullback trading or scalping, can help beginners navigate the complexities of intraday trading. Ultimately, comprehensive knowledge of technical analysis and a clear grasp of market sentiment are critical for achieving consistent success in day trading.
✅ Please share your thoughts about this article in the comments section below and HIT LIKE if you appreciate my post. Don't forget to FOLLOW ME; you will help us a lot with this small contribution.

Fair Value Set UpBeautiful isn’t it? Perfect set up, we have a 1HR FVG that got retraced into and an overlapping PD array in the form of the STH. Entry confirmation will be a order flow leg on the timeframes 3-10 at the Fair Value Line ($2770.29) targeting the short term high of $2918.00. More or less a 5% move depending on entry.

Journey to 53k: Trade Idea Execution 2.4.25Will we see lower prices from here? SL is already at BE and in profits in case price reverses against us.
drop a like and a comment if you like this type of content!
Forex, Crypto and Futures Trading Risk Disclosure:
The National Futures Association (NFA) and Commodity Futures Trading Commission (CFTC), the regulatory agencies for the forex and futures markets in the United States, require that customers be informed about potential risks in trading these markets. If you do not fully understand the risks, please seek advice from an independent financial advisor before engaging in trading.
Trading forex and futures on margin carries a high level of risk and may not be suitable for all investors. The high degree of leverage can work against you as well as for you. Before deciding to trade, you should carefully consider your investment objectives, level of experience, and risk appetite.
There is a possibility of losing some or all of your initial investment, and therefore, you should not invest money that you cannot afford to lose. Be aware of the risks associated with leveraged trading and seek professional advice if necessary.
BDRipTrades Market Opinions (also applies to BDelCiel and Aligned & Wealthy LLC):
Any opinions, news, research, analysis, prices, or other information contained in my content (including live streams, videos, and posts) are provided as general market commentary only and do not constitute investment advice. BDRipTrades, BDelCiel, and Aligned & Wealthy LLC will not accept liability for any loss or damage, including but not limited to, any loss of profit, which may arise directly or indirectly from the use of or reliance on such information.
Accuracy of Information: The content I provide is subject to change at any time without notice and is intended solely for educational and informational purposes. While I strive for accuracy, I do not guarantee the completeness or reliability of any information. I am not responsible for any losses incurred due to reliance on any information shared through my platforms.
Government-Required Risk Disclaimer and Disclosure Statement:
CFTC RULE 4.41 - HYPOTHETICAL OR SIMULATED PERFORMANCE RESULTS HAVE CERTAIN LIMITATIONS. UNLIKE AN ACTUAL PERFORMANCE RECORD, SIMULATED RESULTS DO NOT REPRESENT ACTUAL TRADING. ALSO, SINCE THE TRADES HAVE NOT BEEN EXECUTED, THE RESULTS MAY HAVE UNDER-OR-OVER COMPENSATED FOR THE IMPACT, IF ANY, OF CERTAIN MARKET FACTORS, SUCH AS LACK OF LIQUIDITY. SIMULATED TRADING PROGRAMS IN GENERAL ARE ALSO SUBJECT TO THE FACT THAT THEY ARE DESIGNED WITH THE BENEFIT OF HINDSIGHT. NO REPRESENTATION IS BEING MADE THAT ANY ACCOUNT WILL OR IS LIKELY TO ACHIEVE PROFIT OR LOSSES SIMILAR TO THOSE SHOWN.
Performance results discussed in my content are hypothetical and subject to limitations. There are frequently sharp differences between hypothetical performance results and the actual results subsequently achieved by any particular trading strategy. One of the limitations of hypothetical trading results is that they do not account for real-world financial risk.
Furthermore, past performance of any trading system or strategy does not guarantee future results.
General Trading Disclaimer:
Trading in futures, forex, and other leveraged products involves substantial risk and is not appropriate for all investors.
Do not trade with money you cannot afford to lose.
I do not provide buy/sell signals, financial advice, or investment recommendations.
Any decisions you make based on my content are solely your responsibility.
By engaging with my content, including live streams, videos, educational materials, and any communication through my platforms, you acknowledge and accept that all trading decisions you make are at your own risk. BDRipTrades, BDelCiel, and Aligned & Wealthy LLC cannot and will not be held responsible for any trading losses you may incur.

VINE/USDT DAY TRADE VOLUMEVINE/USDT DAY TRADE VOLUME
has good chance to recovery for day trade to new uptrend

XMR/USDT NEW VOLUMEXMR/USDT NEW VOLUME
It is able to show new uptrend volume in the coming time on day trade.

THE TRUMP RETURN GAME.. DAY TRADE POSSIBLITYTHE TRUMP GAME.. DAY TRADE POSSIBILITY
We did add yesterday a trump update and closed with an increased range.
This new price change TRUMP/USDT seems interesting for a live follow and for this reason, we will focus on the return of the coin and maybe there is more than just a return. new volume can bring interesting things with it.

prom/usdt new day trade movementsprom/usdt new day trade movements
This coin shows new volume patterns, which can be confirmed in the coming time as a day trade coin. We are going to follow this coin to see if it can be confirmed.
This times with BTC breakdown it's hard to find confirmed day trend coins.
The goal is to have a system that even if you have it wrong with 4 trades, that 1 trade will still be profitable over the 4 1/4

#xauusd CPI week price range Gold tapping 2698 on NFP day was the perfection of KRI +Fib technique.
Bull is still in control with the intraday support of 2680 targeting 2.618 extension which is 2755/66 zone.
A break below intraday support 2680, short scalp targeting 2640/45, which is pre-jolts level. Bear will take over if it breaks below 2640/45 targeting 2588/92

XRP easy target of $3.73/80 will be real soon#XRPUSD H4 timeframe:
KRI made new high in Nov 24
By Dec 24, it hit extension 2.618 and broke this extension on the next day
I believe Jan 24 2025 or Feb 1 2025, XRP will reach 4.618 extension and that is $3.78

#XRP easy target is coming soonBITSTAMP:XRPUSD H4 chart using KRI technique, we can see it broke 2.618 easily. When it does that, the next stop will be 4.618extension which is $3.78
Gotta have this coin in your bad guys

#HBAR easy target coming soon.I had talked about #HBAR couple years ago when price was couple of pennies.
Looking at H4 chart for COINBASE:HBARUSD with same KRI technique, 1.272 extension will be .46 cents and 1.618 extension will be .55 cents with the support at .23 cents
There are lot of positive news for HBAR lately so jump on the wagon before it moons.
Easy TP: .46 and .55 cents with support .23 cents

#gold target before NFPShort term bullish for #xauusd since December 30. Using KRI strategy, fib extension has reached 1.272 which is 2677. This week has also been bullish so I do expect gold to tap 1.618 extension which is gonna be 2698 before or during NFP tomorrow.
NPF strategy is very simple; fade the initial move after NFP data releases.
Friday range would be: resistance 2698 and support 2640 "buy at support and sell at resistance with tight SL"

GOLD WANNA FALLING ONCE AGAINAs i published an idea that gold will fall, and gold fall my entry was at 2637, stop loss was 2651 and target was 2585, but that setup gave us 450 pips.
Now I'm back with another idea, my idea is gold will fall when it touches the price 2632.80
Lets see what will happen. Gold moving crazy since last week its moving up and down.
ENTRY POINT : 2632.80 at the area of OB H1.
STOP LOSS : 2641.40 and Target is 2611.50
PLEASE USE STOP LOSS AND TP ON YOUR EVERY TRADE. DONT FORGET TO SHARE YOUR IDEAS ON THIS POST, PLEASE SHARE YOUR IDEAS.
STAY TUNE FOR EVERY UPDATE.
GOOD LUCK EVERYBODY.

US30 Bearish to Bullish Play for the Week So US30 hit a nice bullish Rally from the divergent bottom but we were not able to break through 35.400 even though we broke the 4hr daily yellow trendline to the upside.
We broke back into bearish territory Friday before close. So now I am looking at a weekly consolidation candle from last week giving me a projection for another possible consolidation week starting with a drop to the 42.450 area then I expect bulls to come In ultimately pushing price higher breaking through our 1st major resistance 34.400 into our 2nd major resistance 35.550, if we manage to break through both expect a bullish Rally into our next Major Resistance at 44.450. This week could close as another doji consolidation week if so I’m holding bottom buy entry to swing exits.
I’m looking for a higher low this week giving us a wick on this weekly candle, I have a sell limit placed (shown on chart) and will possibly put a buy limit at the target price.
FULL BEARISH SCENARIO: If we manage to break through 42.440 in a major way expect 42.250 next and a full break through that level would go to next major support zones at 41.900 & 41.650
May the pips be in our favor.

Apple Stock W-Pattern: Another Bullish Entry on the HorizonOver the past few weeks, we’ve repeatedly seen the same W pattern forming in Apple’s stock. I believe the stock is still in an uptrend, and the next good entry point could be during the downswing of the second leg. I’m planning to open a long position.
Whether I’ll close this position at around $260 as a day trade or decide to hold it longer is something I’ll let you know soon. What’s your take on this? Let me know!
Stay tuned, and I’ll catch you in the next one — peace!
