GBP/AUD FALLING: DEATH CROSS + CHANNEL BREAKGBP/AUD convincingly broke through its channel, which held strong since early September. Accompanying this break-through, a bearish cross of the MA50 and MA200 (so called death cross) happened a few bars earlier.
Target 1 should be an area where you want to unload some of your positions, in case the price will rebound from the support line. Target 2 could be reached with enough volatility, but dont be sure of it.
Deathcross

EUR/NZD 🇪🇺🇳🇿 to fall and bounce!EUR/NZD 🇪🇺🇳🇿 has formed the broadening Wedge pattern. The price has recently been rejected by the bottom upward trendline , however as the death cross suggesting the price can possible test the area again after which , according to the ROC divergence and stochastic crossover the price is going to rice up to the test of 1.76985 lvl with the possible further growth.
If you like the idea PLEASE don't forget to hit the LIKE 👍👍👍button
Also share your thoughts and charts here in the comment ⌨️ section.

GBP/USD🇬🇧 🇺🇸 to decline!GBP/USD🇬🇧 🇺🇸 has formed the descending triangle. The price has been falling according to the smooth downtrend except the fake out. However , as the Stochastic is in the overbought and about to cross over and the 50&200 ma provided us with the Death Cross the price is going to decline.
If you like the idea PLEASE don't forget to hit the LIKE 👍👍👍button
Also share your thoughts and charts here in the comment ⌨️ section.

Brent 🛢to decline and then bounce!The upcoming Death Cross suggest that the Brent🛢 is going to fall. However as we have strong support levels indicated below and the RSI is lying in the oversold area we shall expect the bounce from one of the levels indicated below.
If you like the idea PLEASE don't forget to hit the LIKE 👍👍👍button
Also share your thoughts and charts here in the comment ⌨️ section.

CHF/JPY 🇨🇭🇯🇵 to fall to the 115.344 with the following spikeTaking the multiframe look at the CHF/JPY 🇨🇭🇯🇵 on the 2H chart we see the Long Upper shadow that suggest that the price can decline down to the Local Support of 115.344 that is also backed by the bearish ( almost Dead Cross) narrowing of 50&200 MAs at the 12 H chart. There the price most likely to bounce from the long lasting Uptrend Line up to the area of 116.166 lvl.
If you like the idea PLEASE don't forget to hit the LIKE 👍👍👍button
Also share your thoughts and charts here in the comment ⌨️ section.

USD/CAD🇺🇸🇨🇦 to fall and test the 1.31011 level.USD/CAD🇺🇸🇨🇦 pulled back from the lost lasting downtrend line and together with the death cross and the swing of the ROC 12 suggest that the price is going to decline and test the 1.31011 level.
If you like the idea PLEASE don't forget to hit the LIKE 👍👍👍button
Also share your thoughts and charts here in the comment ⌨️ section.

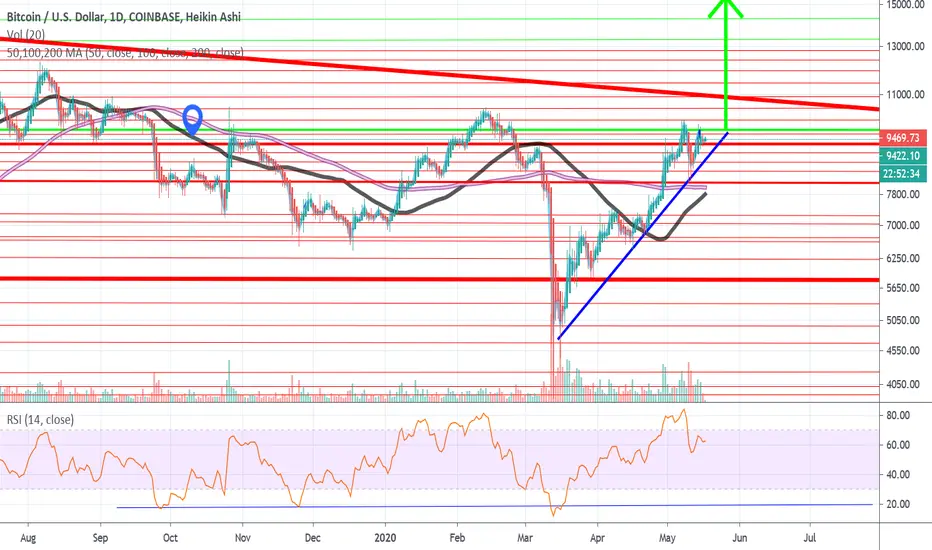
Bitcoin approaching a death cross and heading lowerThe 50 (Green) DMA is approaching crossing under the 100 (Blue) DMA. If this goes ahead, this would trigger a strong signal that BTC will be heading lower.
With the RSI also close to the over bought level, this adds another signal/metric for an impending downward trajectory.
The price has also remarkably followed a supporting trendline for over a month. If a death cross gets triggered and the price falls below this trendline, a downward pattern on 3 signals (death cross, over bought RSI, price falling below a supporting level) will have been confirmed.
At this point, it looks as if a downward pattern will be forming soon.

Golden and Death CrossesThe most popular and simplistic way to use moving averages is to divide the market into a bullish or a bearish one based on a cross. Even today, financial newspapers refer to these crosses as being really important and defining for a market. In order to look for a golden or a death cross, a daily timeframe needs to be open on the financial product one is interested in trading. In our case, let’s use the daily chart on the BTC/USD. The next thing to do is to apply two different moving averages on the chart: one that takes into account 100 as a period (MA100), and one that considers 50 as a period (MA50). This means that MA100 is plotting a value based on the values of the last 100 days, while the MA50 one is taking into account only the last 50 days.
The overall idea to interpret a market is quite simple: When the MA50 moves above the MA100, or it makes a cross, this cross is called a golden cross. It means that from that moment on the overall market turned bullish, and so buyers should dominate that market. The opposite is true as well: When the MA50 crosses the MA100 to the downside, the cross that is formed is called a death cross, and signals a bearish environment in the period ahead. The BTC/USD chart below shows both golden and death crosses, as the MA50 (the red line) crosses above or below the MA100 (the white one).
Best regards EXCAVO

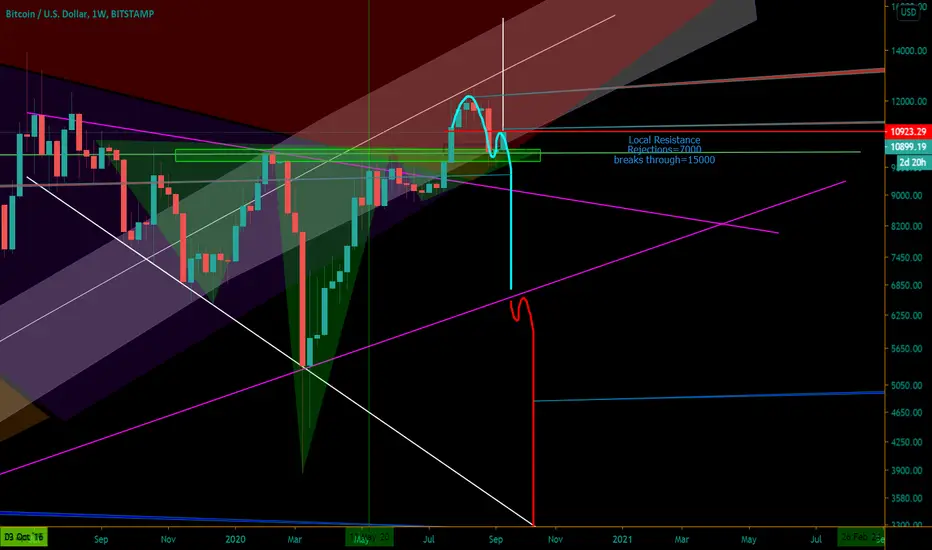
Bitcoin Crash, INCOMING?! *Death Cross*?Hello, I am a fairly inexperienced trader who has been researching the "never below 10k again" theory, but I think I found a frighting pattern on accident.
Can someone with real TA skills please me this is a real? If it is, I"m going to be sick to my stomach.
Thank you, Cheers
ibb.co

SPX vix results refelected on this chart PAIN & GAINIt might sound crazy, but if history is relevant to today's bull market. Then, we could see a bull market the likes of which no one have seeing in our live times. But,
what about if we do not ???? what about if we get some of the less readings. time will tell the story. CHARTS FOR THOUGHT !
wish you all the best.

Bitcoin reaching 3k if we don't break this levelBitcoin is extremely overbought on rsi, is rejected from MUST BREAK resistance, has high volume, and death cross on MACD. The eth crash coming will take bitcoin with it.
BTC at 7000 soon.
Potential 4hr chart double bottom in play on BTCUSD price action is 1 4hr candle away from 4hr deathcross, but this could easily end up being a deathcross fakeout even if the cross occurs...there is double bottom potential here on the 4hr chart if it can flip this green horizontal neckline to solidified support...the breakout target for the double bottom is pretty close to the target from the 4hour falling wedge pattern from my previous idea as well which makes for good confluence...also we are currently inside a bull flag too on the 4hr which is making upn the right part of the double bottom and also has a similar target once again increasing the confluence and in turn the probability for a bullish breakout. Best to wait and see it confirm first before making a move as well as seeing how price action responds to the initial cross of this 4hr deathcross.

Death Cross Forming $UNI will be testing out the Death Cross pattern with $UN paper trading. History shows that UN usually will go down the day after - 2 days after the pattern is complete, reaches it's low a few days later. The goal is to reach $53, right where it was before it blew up last month from earnings


DEATH CROSS FAKEOUT?Yesterday i was looking for a breakdown on the GBP/JPY. We retraced a bit but couldn’t break the support. Now we are resuming upwards and i am looking to go long. But we first need to break the overhead resistance at 133.8. Keep an eye on it.

GBP/JPY DEATH CROSS!A potential play on GBP/JPY. We can see a death cross being confirmed and the price action getting pulled right into the cross. If we resume down from here i would be expecting price to come back down into the 130.8 ish range. We could see a bounce in that area but i think it is more likely to find a bottom in the 129.4 ish area.


BTCUSD, Winter is coming!The sun is leaving the mountain.
It might take a month as the previous winter.
What's your plan?

0001. Hoggish Play - Short UVXY As the name implies, I prefer to keep Hoggish Plays to myself, since they end up paying most of my living expenses.
But, there is no need to keep this one to myself, so buy Puts for 6/19 at the money or out the money. Either works.
Not going to add much more commentary, since it's a Hoggish Play.
GL
-Hoggish Pig
AMEX:UVXY
TVC:VIX

This is my look at Bitcoin VS USD on 05.28.2020I'm not a financial advisor, Don't buy or sell bass on what I'm saying... I do own some Bitcoin and I think it has a great future, this future may or may not be that great so PLEASE DO YOUR OWN HOMEWORK. THIS POST IS JUST FOR INFO ONLY...
This is my look at Bitcoin Vs USD on 05.28.2020
This is an experimental indicator that I have made and testing it out... It is using the EMAs the white line is 13 EMA, the green line is 55 EMA and the yellow line is 89 EMA ...
The points going pass is a future guess by the experimental indicator and the way it works is if it's pointing down like the white one is on this chart, to me, it's suggesting that Bitcoin is going to head higher in the next couple of days and using the RSI and the MACD that should be happening sometime over the weekend or early next week has helped to confirm that for me...
The points going pass is a future guess by the experimental indicator and the way it works is if it's pointing up like the white one is on this chart, to me, it's suggesting that Bitcoin is going to head down in the next couple of hours and using the RSI did have a couple of death crosses over the last day or so and the MACD looks like it will have a death crosses any time now!
What do you think about this, a good idea or a bad idea?

Ascending Triangle breakout for Bitcoin?Inside of the ascending triangle on a micro scale Bitcoin is forming a cup & handle, there is merit potentially for a inverted H&S as well.
The RSI is displaying a inverse H&S, interesting because the moving averages are about to converge
Only time will tell, but a golden cross followed by an immediate death cross seems like a future occurrence.
75% oil drop start?He spoke in the previous neutral forecast about the likelihood of a second fall of 2012-2014, apparently it started much earlier than planned and the death cross is getting closer

oil will fall, it's a matter of timeHello everyone, so on my chart, you can now see a repeat of the price movement, namely starting from 2012 (as indicated on the chart) and a possible intersection of the two-day moving average or, as usual, the appearance of the death cross
