When the CBOE no longer wants to short BitcoinThere is an impressive correlation between Bitcoin's price and the futures markets created on it by the two well-known financial juggernauts: the Chicago Mercantile Exchange (CME) and the Chicago Board Options Exchange (CBOE).
As I already mentioned on one of my first publications of 2018, the start of the futures contracts (CBOE on 12-10-2017 and CME on 12-17-2017) coincides perfectly with the bubble top, of which the ATH (All Time High) close $ 20,000 was also on 17-12-2017.
These derivative products allow to bet upwards but also and especially down on the value of the asset concerned, here Bitcoin.
The bet is contractualized at a price and a date fixed in advance with very important leverage effects. It is basically the giant casino of global finance. And the Bears (financial institutions, banks) then have a privileged tool to express their skepticism about Bitcoin!
However, the economic incentive to manipulate the market of the underlying is all the stronger in the presence of a bet taken on the derivative market!
As of March 2018 circulating on the social networks the alleged actions of some fund managers, accused of having provoked the decline of the Bitcoin price to be able to generate profits, which could have prompted many savers to withdraw from crypto-markets .
But what is interesting to note today is that the Chicago Stock Exchange, the CBOE, announced in March 2019 to end its Bitcoin futures!
The last listed contracts scheduled to end in June 2019.
In my view, this is an additional indicator of a lesser influence of the most powerful Bears (big boys in finance, institutions, banks) on the crypto-market, giving the latter the possibility of 2019 to come out of his bear market.
What seems to want to prove to us, a few days after this announcement, the pump to $ 5200 ... like a boost of confidence Bulls!
Derivatives

Seeking EdgeHow can you make money in this environment? When you step back and look at trading on a quarterly basis, how has one faired in 1Q19? From January 1st to present, BTC has been stuck in a range of $3,350 - $4,200. Yes, you could have day traded masterly and had a good quarter for top line profits, but as many of you know, fees can add up with an active trading strategy. If you’re more of a strategic/opportunistic trader looking for 10-15% moves over a weekly time horizon, you really only had 2 good chances to capture these gains throughout these last two and half months. And to that point, with how thinly traded the BTC market is right now, you can see these moves happen in minutes and you MUST be on top of position 24/7 (once again, not easy).
So this brings us back to the initial question of the day; How can we make money in this market? In situations like these, it takes some creativity and courage to think outside the box and come up with new trading strategies or trade in areas that are not yet overtraded. This is the typical evolution of markets. Traders go to where money is most easily made, like water flows to the path of least resistance. As a strategy gets oversaturated (no pun intended) with traders using the same strategies, ‘edge’ diminishes. Therefore, these traders must find new strategies or products that give them their ‘edge’ back.
BitOoda’s thesis is that the Derivatives Market will see the next wave of influx of traders into the space, trading products with leverage that they could not normally get in the spot market. To date, we see the sophisticated funds within the digital asset space entering this derivatives markets. Because of this evolution of the market, typical ‘wall street’ funds are knocking on the door, looking to learn about the dynamics of these markets, waiting to pounce when the moment is ripe. Our goal here is to facilitate the trading of these products, in a transparent and compliant manner, without conflict of interest that we are seeing so much of within this industry. The momentum is building for the agency brokerage model. It is only a matter of time that the Digital Assets Market will catch up to other mature market classes within typical financial capital markets.

Forward Curve - CALL WRITING STATEGYAs we’ve been having conversations with all kinds of players within the cryptosphere, we’ve noticed Index Fund managers as well Miners who are long-only are looking for additional sources of income.
This piece will be to educate them in a potential CALL WRITING strategy that can satisfy their need for additional income. When entering a CALL WRITING program, one would typically sell the 20 to 30 delta out-of-the money calls somewhere between 3-6 months out. If the program outcome is successful, a fund will increase its yield by collecting the option premium. Let us walk through the potential trade and its outcomes:
Assume you have a cost basis of $4,500 for your BTC. We would look at the BTC June (6/25/19) $6,000 Calls that are worth roughly $200.
1. If the underlying stays flat
o Do nothing, sit back, and enjoy collecting the premium
o At expiration (6/25/19), your cost basis would become $4,300 (original basis – premium = new basis)
o Next Trade: analyze volatility curve and target appropriate calls to sell
2. If the underlying sells off to $2,500 (hypothetical)
o You can ‘roll’ your short calls to a lower strike to increase the premium income making up for losses in the underlying asset.
o Sell the $4,500 Call and buy back the $6,000 Call for a net spread of $100 ($100 is an assumption and would have other factors to dictate that price: time, vol, BTC price etc.)
o At expiration (6/25/19), your cost basis would become $4,200 (original basis – total premium = new basis)
3. If the underlying rallies towards $6,000 (hypothetical)
o You should roll the short calls ‘up-and-out’ (to a higher strike and a further month in the calendar year)
o Hypothetically, we would try to buy back the June $6000 calls and sell December calls (maybe $9,000 strike) for the same premium.
o The cost basis would remain the same @ $4,300, however you would not get called out of your BTC length if June settled above $6,000
When the premium on the short calls are miniscule, you can decide to buy them back, or let them expire. After this decision is made, you can start this process over and sell more calls to continue lowering the cost basis of your BTC.
The risk to this strategy is that you are short calls that, if end up in-the-money, can be exercised – meaning you would have to deliver your BTC to the call purchaser. To prevent this from happening one should be rolling the calls ‘up-and-out’. If the opportunity to do this is missed (let’s say BTC gapped from $4,000 to $8,000 overnight), you would end up cutting your profits short.
If this income generating program is something you would consider establishing, please reach out to us and let us know so we can hop on a call to discuss further.
Contacts
Tim Kelly
Founder and CEO
tkelly@bitooda.io
Brian Donovan
Executive VP of Institutional Sales
bdonovan@bitooda.io
Dr. Ilya Kurland
Chief Derivatives Strategist
ilya@bitooda.io

SDS S&PLooking to have found a possible bottom or top depending on how you view this. SDS looks to capatilize on a bearish market. Seems a safe hedge given current S&P conditions.

Overbought Short Opportunity EthAs you can see on the two downward upper and lower trend lines I called a short opportunity when ETH/USD was hovering around 242. Looks like that was the right call and it went down to 215. Would have been a nice little profit I would say.
Now we are nearing overbought again comparatively similar to the last call considering the trend lines and where the price action lies at the moment within the trend.
This could be another short opportunity. However the MACD is meddling with a cross which may signal that waiting for confirmation may be best. Lets wait and see if this gets rejected at 240. If it goes to 244 its a buy. If its rejected at 240 and we bounce back down to 237-238 its a short opportunity.

UK Oil DailyOil is going down to 71/70 than up to max. 76 (82 isn't in my mind now). 76 down to 66,10 (161,8).
That's only my opinion and no trading advice. Good luck guys.

How to Utilize the $VIX as a HedgeWhile the $VIX is a volatile index by itself, containing derivatives that can be fun to trade individually; it can also be used as a valuable hedge against a range of portfolios. While I had a tech heavy portfolio the last month and a half, I took tremendous short term gains anywhere between 10 and 15%. While holding the $VXX ETF to mimic movements of the $VIX, I used this derivative to hedge against sharp downfalls in this NASDAQ.
Over the course of tech making a quick run, the ETF I held took losses of around 20%. This is why it is vital to take a holding relative to other positions - I usually do 1/3 position compared to fulls in my portfolio. This way the losses only really amounted to ~6.5% compared to a full position. Today on 6/19, a couple days after I liquidated all my tech positions (still holding $NVDA), the NASDAQ took a hit and the $VXX ETF is up 8.2% currently. This spike has erased losses to -10% for the position alone (~-3% to a full position) and has actually made me net green for the day even after suffering losses of 2.5% on $NVDA.
Even though the $VIX is extremely risky by itself, I do think it contains great value as a hedge if utilized correctly.

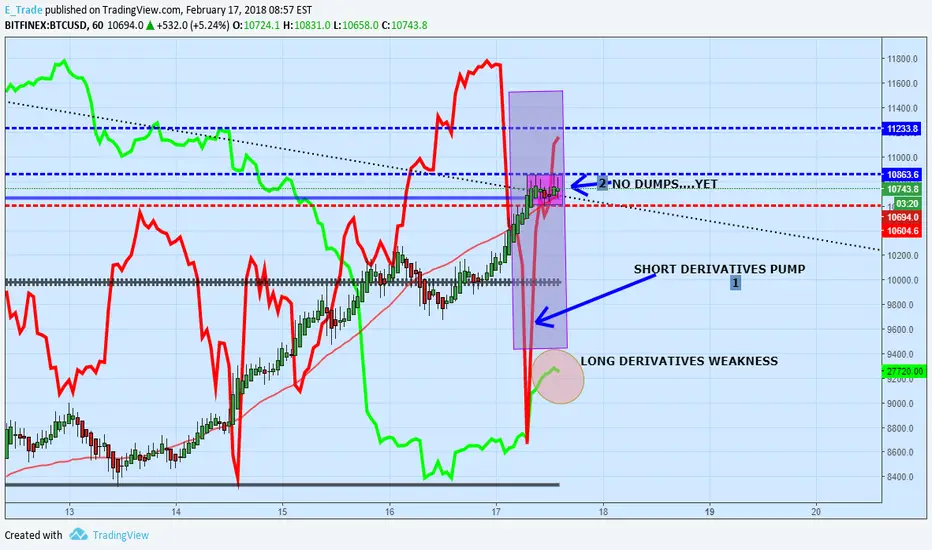
BTCUSD_M15_Derivatives analisysIf derivatives will confirm price swings, and shorts will became stronger on long's weakness, i see a short scenario considering the previous posts, if the weekly key level will be confirmed with a bearish momentum breakout and if the actual lateral market will create a distribution situation as mentioned before.
I also know that on the M1 chart we are ATH , with several increasing minimums , which could represent another bullish setup if the long period trendline will be violated.
By the way, there's not a short period entry setup yet, we have to break the round 700 and after the price has to show up a short pattern to confirm the analisys and to follow the short Key levels mentioned.
Silver shortsAs Trumps victory is now being digested, markets appear to be warming to him , however still early days and Obama is still president. My projection is very bearish on silver as we see investors rushing towards stocks and bonds in the next few weeks , believing the Economy will be ok. Or is it?? Shorts in play for time being.

USDCAD - Always a loonie....Earlier...
image.prntscr.com
USDCAD 4 hr -
Now...
image.prntscr.com
USDCAD 4 hr -
While CAD been a loonie can do a move back lower to the 301X but perhaps one more strike higher can be seen as per the 8 hr layout that carries indication of a possible double bottom scenario..
image.prntscr.com
USDCAD 8 hr -
Hence be expecting some back and forth moves on this pair while shows more intend to hold out on any further strength on the USD..

EURAUD - Tops ( break point ) rejected - we head lowerEURAUD...
image.prntscr.com
EURAUD 8 hr - 4800 pretty much been a break zone and had been tested multiple times and rejected indicates we to carry on to the lower side for a possible move towards closer to 4500 handle.. 4570-9X been moderate tgt .. More explained in the next 2 hr chart layout
image.prntscr.com
EURAUD 2 hr - Self Explained within the chart.. Easier layout to follow

Swissy - Depended on next break -Swissy........
image.prntscr.com
Swissy 4 hr - Simple case of a breakout here -- that would orchestrate the next big move.. While USD looks bullish, somehow Swissy looks undone to the lower side first.. Anyways shunning the biasness here - let's stick to the break to either side to get going on to that direction...
image.prntscr.com
Swissy 8 hr - Self Explained within the chart

GBPAUD - Short side likely to prevailGBPAUD -
image.prntscr.com
GBPAUD 8 hr -
Seems to have closed under Rising Wedge with distinction to it been a bear flag as well and as such difficult to point a tgt on the drop but tentatively around 1.700 on a deeper run with moderately towards lower 1.72XX.
image.prntscr.com
GBPAUD Daily - Deeper run if happening...
image.prntscr.com
GBPAUD 2 hr - Incase of some extended on retrace higher it should ideally get contained under 7660-8X and get a sub 7600 close to get going to the down side..

GBPJPY - Favor move lower been up on a fresh breakout.image.prntscr.com
Up on Friday ..
GBPJPY...
image.prntscr.com
GJ 8 - Still have 142.23 short intact hf ... Like to play it to the bone on this one...

GBPCAD - Next move to 1.7000 just may provide entries longs...GBPCAD ..
Likely move to 1.7000 to be seen and carries decent support to there..
image.prntscr.com
GBPCAD 4 hr -
image.prntscr.com
GBPCAD 30 mins - Initial playout

Destine for some falling out.. GBPUSD....
Overall looks to have shunned out the temporary bullish move it carved last week and the fall has more room to carry on..
image.prntscr.com
GBPUSD 4 hr - Pretty straight forward layout - Upcoming support is 297X.. A short term bounce and then likely piercing under for a deeper fallout..
image.prntscr.com
GBPUSD 4 hr -
image.prntscr.com
GBPUSD 8 hr -
image.prntscr.com
GBPUSD Daily- Self Explained ...
image.prntscr.com
GBPUSD 2 hr - Pretty much mimicking the 4 hr layout

EURUSD... Showing hints of move towards parity....EUR off weekly..
Weekly on very current PA suggesting further down.. Overall bigger tgt points to parity for starters..
image.prntscr.com
image.prntscr.com
EUR weekly
image.prntscr.com
EUR Daily - Based on daily next significant supp or rather bear move tgt comes to around 1.0800 handle that has stood ground on numerous attempts before propelling bounces...

Rising wedge, but for now running into supportAs we see some support is coming in from our longer term trend channel as well as the lower Bbands.
So far the last three weeks have provided with the expected sideways action once reaching 50.
Selling calls has been the right strategy so far (51, 52 and 53 calls).
At this support I am covering my short calls, but will hold of selling any put spreads to see how the FOMC decision plays out. I would not be surprised to see no rate hike and crude test some downside targets.
For now, neutral, but getting ready to sell some downside put spreads once we breach the support (if we do)

GBPCAD.. APPROACHING CRITICAL LVLS.. GBPCAD.. APPROACHING CRITICAL LVLS..
i.imgur.com
GBPCAD 8 hr - 9220-3X possible top off zone and a critical point - Test to it be a third attempt and as such been a break point would expect to hold initial attempt - making it a decent spot to enter shorts..
i.imgur.com
GBPCAD 8 hr -Same chart and it's one of those zones / angles where if price ends up holding 1-2 more attempts carries potential for some 4-600 pips drop on the pair; before likely it getting bull out ... 1.2000 is something that can't be ignore now....

Quick run on EURJPY.123.7X matters now..
i.imgur.com
EURJPT 2 hr -
123.7X break point for further up north towards 124.5X for starters ; else halt to push lower for a 123 retest and a likely break for a 122 move...

AUDJPY - Bear Flag Play on.....AUDJPY...
i.imgur.com
AUDJPY 4 hr - Indication of a bear flag looms and as such initially buy side prefers off around the supportive TL or T1 . Initial tgt been T3 or mid range.. Eventually look for break higher side to T2 and then with it been a possible Bear Flag top to sell into strength for a possible play sketched on the charts..


EURUSD - Going into the NFP..The theme going into the NFP is to fade the spikes. While thinking the upside on EURUSD is done; nevetheless a decent up swing on a spike be tempted to set shorts into ..
1.1470-8X comes in as a spot to try short if price ends up spiking around to here; for a potential tgt intra day down to 132X.
Alternatively looking to buy off the 132X for a possible swing back to 1400 and likely use Monday to set shorts off 1400-1X down to sub 1200...
Will find out how it goes.. but first need a fake up ( spike ) to around 1470-8X and a halt to start gunning on the short side..
img.prntscr.com
EURUSD 2 hr - 148X resis
img.prntscr.com
EURUSD 4 hr - 147X resis
