Triangle Chart Patterns: How to Identify and Trade ThemTriangle Chart Patterns: How to Identify and Trade Them
Triangle chart patterns are essential tools in technical analysis, helping traders identify potential trend continuations. These formations build as the price consolidates between converging trendlines, signalling an upcoming move in the market. In this article, we’ll explore the three types of triangle patterns—symmetrical, ascending, and descending—and how traders use them to analyse price movements.
What Are Triangle Chart Patterns?
Triangle chart patterns are a common tool used to understand price movements in the market. These patterns form when the price of an asset moves within two converging trendlines, creating a triangle shape on a chart. The lines represent support and resistance levels, and as they get closer together, it signals a potential breakout in one direction.
Symmetrical, ascending, and descending are three types of triangle patterns. Each of these patterns reflects a different market sentiment, with symmetrical triangles showing indecision, ascending triangles suggesting a bullish bias, and descending triangles hinting at bearish momentum. These formations are useful because they help traders spot potential breakouts, where the price might move sharply up or down after a period of consolidation.
It’s important to note that triangles and wedge patterns are similar but not the same. Both patterns involve converging trendlines, but wedges tend to slope upward or downward. Triangles, on the other hand, either feature one horizontal trendline and a sloping trendline or two sloping trendlines at roughly the same angle.
Below, we’ll cover the three triangle types. If you’d like to follow along, head over to FXOpen and TradingView to get started with real-time charts.
Symmetrical Triangle
The symmetrical triangle is a popular chart pattern that shows up when the price of an asset starts consolidating within a tighter range. Unlike other triangle patterns, it doesn’t lean heavily in either direction—bullish or bearish—making it a neutral signal. It forms when buyers and sellers are in a bit of a standoff, with no clear trend in sight. However, this period of indecision often leads to a significant move once the price breaks out of the pattern.
What Does It Look Like?
- Two converging trendlines;
- One sloping down from the highs (resistance);
- One sloping up from the lows (support);
- The price oscillates between these two lines, forming lower highs and higher lows;
- The formation narrows as the lines get closer together, creating a point of breakout.
What Does It Indicate?
A symmetrical triangle pattern indicates a period of indecision in the market. Buyers and sellers are evenly matched, causing the price to move within a narrowing range. As it gets smaller, the pressure builds, and the price is likely to break out either up or down. Since the formation is neutral, the breakout could occur in either direction, and traders wait for this moment to see where the market is heading.
How Do Traders Use It?
Traders typically watch for a breakout from the symmetrical triangle to signal the next significant price movement. They often look for an increase in trading volume alongside the breakout, as this can confirm the strength of the move. In most cases, it’s used as a signal for potential price continuation. However, some traders see it as a reversal indicator, depending on what the preceding trend looks like.
Ascending Triangle
An ascending triangle is a bullish triangle pattern that’s often looked for when analysing potential price breakouts. It usually forms during an uptrend but may also appear in a downtrend. It suggests that buyers are becoming more aggressive, while sellers are struggling to push the price lower, creating a situation where the market might break upwards.
What Does It Look Like?
- A horizontal resistance line at the top (price struggles to break above this level);
A rising trendline at the bottom, connecting higher lows (buyers are stepping in earlier each time);
- The price moves between these two lines, creating a triangle shape;
- The formation narrows over time, putting pressure on the resistance level.
What Does It Indicate?
An ascending triangle pattern signals that buyers are gaining control. While the price keeps hitting a ceiling (resistance), the higher lows show that the market’s buying pressure is increasing. This often leads to a breakout above the resistance level, where the price can make a significant upward move. Traders usually see this formation as a sign that the market is primed for a continuation of the current uptrend. However, sometimes it can appear in a downtrend and signal a trend reversal.
How Do Traders Use It?
Traders typically use the ascending triangle to spot potential breakouts above the resistance level. When the price finally moves and closes above this line, it’s seen as confirmation that the upward trend is continuing. Many also pay close attention to the trading volume during this breakout—rising volume can confirm that the breakout is genuine.
In some cases, the price may break through the resistance quickly, while in others, it could take time before the upward move happens. There may also be false breakouts before the true bullish move occurs, with the price typically closing below resistance.
Descending Triangle
A descending triangle is a bearish chart pattern that signals potential downward movement in the market. It typically forms during a downtrend but can also appear in an uptrend. It shows that sellers are becoming more dominant, while buyers are struggling to push the price higher, which could lead to a breakdown below a key support level.
What Does It Look Like?
- A horizontal support line at the bottom (price struggles to break below this level);
- A descending trendline at the top, connecting lower highs (sellers are pushing the price down);
- The price moves between these two lines, creating a triangle shape;
- The formation narrows over time, with the pressure building on the support level.
What Does It Indicate?
A descending triangle chart pattern suggests that sellers are in control. While the price holds at the support level, the series of lower highs shows that selling pressure is increasing. This often leads to a breakdown below the support line, where the price might experience a sharp decline. Traders see the formation as a bearish signal, indicating that the market could continue its downward trend.
How Do Traders Use It?
Traders typically use the descending triangle to identify potential breakdowns below the support level. When the price falls and closes below this line, it’s considered confirmation that the sellers have taken over and that further downside movement could follow.
Similar to other triangle patterns, it’s common to watch for a rise in trading volume during the breakdown, as it can confirm the strength of the move. It’s also possible to see false breakouts below the support level when the price closes back inside the pattern almost immediately.
How Traders Use Triangle Patterns in Technical Analysis
These patterns are just one piece of the puzzle in technical analysis, but they can offer us valuable insights when used correctly.
Triangle Pattern Trading: Entry, Stop-Loss, and Profit Targets
Entry Points
Traders typically wait for a confirmed breakout from the triangle formation’s boundaries before entering a trade. For ascending triangles, this means watching for the price to break above the upper trendline (resistance), while for descending triangles, they look for a breakdown below the lower trendline (support). In a symmetrical triangle, the breakout may be in either direction, usually informed by the broader market trend.
The entry is often confirmed by a closing candle above or below these key levels to reduce the risk of false breakouts.
Stop-Loss Placement
Stop-loss orders are crucial here. For ascending triangles, stop losses might be placed just below the last swing low, while for descending triangles, they might be set just above the recent swing high. In the case of symmetrical triangles, traders often place the stop-loss just outside the formation’s apex.
Profit Targets
To set profit targets, traders typically use the triangle's height (the distance between the highest and lowest points). This height is then projected from the breakout point, offering a realistic target for the trade. For example, if a triangle stock pattern’s height is $10 and the breakout occurs at $50, the target would be $60 for a bullish move.
Combining with Market Context
Triangles may become more reliable when considered in the context of the broader market environment. Traders don’t just look at the pattern in isolation—they analyse the prevailing trend, market sentiment, and even macroeconomic factors to gauge whether a breakout aligns with the larger market movement. For instance, an ascending formation in a strong uptrend adds confidence to the idea of a bullish breakout.
Using Other Indicators for Confirmation
While triangles provide a useful framework, they’re usually combined with other technical indicators for confirmation. Traders often align triangles with volumes, moving averages, or momentum indicators to assess whether the breakout has strong support behind it. For instance, a breakout confirmed by high volume or a moving average crossover might add confluence to the trade.
Limitations and Considerations of Triangle Patterns
Triangles are useful tools in technical analysis, but they come with limitations and important considerations. While they can signal potential breakouts, it’s essential to approach them cautiously.
- False Breakouts: Triangles often experience false breakouts, where the price briefly moves beyond the trendline but quickly reverses. This may trap traders in unfavourable positions.
- Subjectivity: These formations are open to interpretation. Different people may draw trendlines slightly differently, leading to varying conclusions about where the breakout occurs.
- Need for Confirmation: Relying solely on patterns can be risky. They may work better when combined with other indicators, such as volume or moving averages, to confirm the trend direction.
- Market Conditions: In volatile or news-driven markets, chart patterns may not behave as expected, reducing their reliability. They may provide false signals or lose significance in these situations.
The Bottom Line
Triangle chart patterns are popular tools among those looking to analyse market movements and potential breakouts. Whether it’s a symmetrical, ascending, or descending triangle, these patterns provide valuable insights into price consolidation and future trends. While no pattern guarantees a winning trade, combining triangles with other indicators may improve market analysis.
Ready to apply your knowledge? Open an FXOpen account to explore chart patterns in more than 700 live markets and take advantage of our low-cost, high-speed trading environment backed by advanced trading platforms.
FAQ
What Is a Triangle Chart Pattern?
A triangle chart is a pattern in technical analysis that forms when the price of an asset moves between converging trendlines, creating a triangle shape on a price chart. They typically signal a period of consolidation before a strong potential breakout in price.
What Are the Patterns of Triangles?
There are three main types of triangles in chart patterns: symmetrical, ascending, and descending. Symmetrical triangles indicate indecision in the market while ascending triangles are often bullish, and descending triangles tend to be bearish.
How to Trade a Triangle?
Traders typically wait for a confirmed breakout from the triangle’s trendlines. According to theory, entry points are based on a breakout above resistance or below support, with stop-loss orders placed just outside the triangle. Profit targets are often set based on the height (the distance between the highest and lowest points) of the pattern.
What Is the Triangle Pattern Strategy?
The triangle pattern strategy involves waiting for a breakout and using the formation’s height to set profit targets. It’s combined with tools like volume, moving averages, and momentum indicators to confirm the move and avoid false breakouts.
Is the Triangle Pattern Bullish or Bearish?
They can be both bullish and bearish. Ascending triangles are generally seen before a bullish movement, descending triangles are bearish, and symmetrical triangles can be either.
This article represents the opinion of the Companies operating under the FXOpen brand only. It is not to be construed as an offer, solicitation, or recommendation with respect to products and services provided by the Companies operating under the FXOpen brand, nor is it to be considered financial advice.
Descending Triangle

GBPCAD bearish view
OANDA:GBPCAD whats next?, we are have two times bounce on trend line,
currently on D is visible DESCENDING TRIANGL,
in triangl we have RECTANGLE PATTERN 4h which is breaked,
below rectangle pattern we have on lower TF better visible BEARISH FLAG pattern 1h (violet doted), which currently looks breaked,
here expecting bearish push now till next trend zone.
SUP zone: 1.85000
RES zone: 1.82250, 1.81600

BITCOIN → Break of the bullish structure. Moving to 78-68KBINANCE:BTCUSD has been slowly recovering for the last two weeks, but failed to overcome the resistance. The bears held the trend. The price is breaking the local bullish structure and preparing for a strong fall.
Bitcoin's fundamental background is weak, expectations were not met by the crypto summits, nor by any major announcements or hints of a crypto reserve. The crypto community still didn't get what they expected from Trump. The strong drop was triggered by the SP500 index falling, driven by rising inflation, reduced consumer pressure and new trade tariffs. These factors have contributed to increased uncertainty in the markets, prompting investors to move to safer assets such as gold and government bonds
Technically, the price has been in consolidation (correction channel) for two weeks and after breaking the support of the figure, the price entered the realization phase within the global downtrend.
Resistance levels: 85300, 86350, 89400
Support levels: 83600, 81270, 79980, 78100
Emphasis on the support at 83600. The price fixing under this zone may provoke further fall to 80-78K. But I do not exclude the fact that a small correction to the zone of interest is possible (to capture liquidity) before a further fall to the previously identified key zones of interest.
Regards R. Linda!

WILL #GRT MAKE IT!!!
Currently #GRT is facing a resistance which was previously strong support of descending triangle.
#grtusdt needs to break above this resistance, then we can probably see rally up to 0.5$ region after breaking out resistance of previously formed descending triangle.
In case of any further dip, we can see #grt heading towards its major support region.

EURCAD - Descending TriangleHello Traders !
On Tuesday 11 March, The EURCAD reached a strong resistance level (1.61530 - 1.57962).
The price formed a descending triangle pattern.
Currently, The support level is broken !
So, I expect a bearish move📉
____________
TARGET: 1.52350🎯

XAUUSD Weekly Analysis – Bearish Correction ExpectedGold (XAUUSD) has recently broken above a rising wedge resistance on the weekly timeframe but is now showing early signs of potential exhaustion. Price action is currently hovering around the $3,024 level after a strong bullish rally. However, historical patterns and structure suggest a possible bearish correction ahead.
📊 Key Technical Observations:
Rising Wedge Pattern: Price has been following an ascending channel with a sharp parabolic curve. The structure hints at overextension, making it vulnerable to a pullback.
Previous Corrections: Two notable corrections (-8.89% and -8.15%) provide a historical benchmark, reinforcing the possibility of a similar retracement.
Bearish Scenario :
A potential double-top formation and rejection zone is developing around the $3,050 area.
Target Zones:
TP1: $2,935.95 – first major support/resistance flip zone.
TP2: $2,782.94 – deeper retracement aligned with previous corrective structure.
🧠 Trading Bias:
Bearish bias in the short to medium term as gold may seek to correct before any continuation of the bullish trend.

XAUUSD Head And Shoulder pattern breakdownGold update 15m head and shoulder breakdown
Key Levels:
Resistance Levels:
3,040.000 (Immediate Resistance)
3,050.000
3,060.000
3,070.000 (Major Resistance)
Support Levels:
3,022.000 (Immediate Support)
3,014.000
3,006.500
2,999.000
2,991.000 (Major Support)
Price Action Overview:
Gold is currently trading at 3,033.785, showing a slight upward movement of +1.685 (+0.096%).
The price has been consolidating between 3,031.425 (Low) and 3,034.430 (High) in the last 15-minute candle. The market is testing the 3,035.410 level, which could act as a minor resistance.
Technical Indicators:
USB (Ultimate Support/Resistance Band):
Current Value: 38.301 (-1.279)
Indicates potential support/resistance zones around 3,830.4.
TAT & Skullers Indicator:
Current Value: -38.306 (-1.269)
Suggests a potential retest or breakdown level around 3,830.6.
Market Sentiment:
The market is showing slight bullish momentum, but the price remains within a tight range.
A breakout above 3,040.000 could signal a stronger bullish trend, while a breakdown below 3,022.000 may indicate bearish pressure.
Trading Strategy:
Bullish Scenario:
Entry: Consider a long position if the price breaks and sustains above 3,040.000.
Targets:
3,050.000 (First Target)
3,060.000 (Second Target)
3,070.000 (Major Resistance)
Stop Loss: Place below 3,022.000 to manage risk.
Bearish Scenario:
Entry: Consider a short position if the price breaks and sustains below 3,022.000.
Targets:
3,014.000 (First Target)
3,006.500 (Second Target)
2,999.000 (Major Support)
Stop Loss: Place above 3,035.410 to manage risk.
Risk Management:
Always use proper risk management techniques.
Risk no more than 1-2% of your trading capital per trade.
Adjust position sizes according to your risk tolerance and account size.

Bitcoin - This indicator is always right! Crash to 40k in 2026.What we can see on the chart is Bitcoin cycles. We can statistically predict Bitcoin moves with this simple chart, because it's always right and never wrong. What can we say with certainty?
Statistically:
Bitcoin's bull markets last for 742 to 1065 days
Bitcoin's bear markets last for 364 to 413 days
Correction is every time weaker, but still huge
The recent uptrend on Bitcoin started in December 2022 and ended in January 2025 (791 days). We know that statistically bull markets last for 742 to 1065 days, so this indicator tells us that the bull market ended! This indicator was never wrong, so do your own research. It's always like this. Moon boys calling for 300k, 500k, or 1M in 2025 do not follow my TradingView profile because otherwise they would know this strong fundamental fact. The market cap of Bitcoin is already too big, so forget about 500K or 1M in the short term because the market cap would be higher than gold. Gold is the number 1 asset in the world.
Statistically, Bitcoin crashes every 4 years by 86% to 77%. The market cap is getting bigger as institutions step in, so this time I expect a weaker crash (around 65%). Still, it's a huge crash, and many investors will sell at a loss as usual. Knowledge of the Bitcoin cycles will save you a lot of money.
Bitcoin halving is coded to occur once every 210,000 blocks, or roughly every four years, and will continue in this fashion until the final supply of 21 million BTC is reached. It is assumed that the last BTC will be mined in 2140. After that, transaction fees are supposed to be the only source of block rewards for miners.
Write a comment with your altcoin, and I will make an analysis for you in response. Also, please hit boost and follow for more ideas. Trading is not hard if you have a good coach! This is not a trade setup, as there is no stop-loss or profit target. I share my trades privately. Thank you, and I wish you successful trades!

OMUSDT → Paranormal behavior. Rally readinessBINANCE:OMUSDT as a whole looks stronger than the market. After a strong rally a correction in the format of a bearish wedge is formed, subsequently the price broke the resistance and is trying to consolidate above the key support
Against the background of a weak market OM coin has good prospects as technically someone is interested in this project and the coin as a whole behaves strongly and looks stronger than the market.
A breakout of the bearish wedge (consolidation pattern within the correction) is forming. If the bulls keep the coin above the previously broken figure resistance and above the base of the 6.752 reversal pattern, the growth may continue in the short to medium term
Resistance levels: 7.39, 7.98
Support levels: 6.752, 6.51
One of the few coins that is rising while bitcoin is falling. Focus on the previously mentioned support levels, as well as on the local resistance 7.05, the break of which may provoke a prolongation of growth
Regards R. Linda!

BITCOIN → Short-squeeze 86-89K before falling further to 75KBINANCE:BTCUSD continues to form a downtrend after breaking the bullish structure on the weekly timeframe. There is no bullish driver yet, and technically, the price is heading to the global imbalance zone of 75-73K
The past crypto summit and any other talk of cryptovalt support cannot support the market. Such events end with further market decline.
Technically, the market continues to form a downtrend (global counter-trend), based on this alone, we can say that the price is now going against the crowd and this is generally logical behavior. Globally, the zone of interest is located in the following zones - 75K, 73K and order block 69-66K
Locally, I would emphasize the nearest liquidity zones, located at the top, which can be tested before the further fall: 86697, 89.397
Resistance levels: 85135, 86678, 89397
Support levels: 79987, 78173, 73512
After the false break of 78K support there is no strong reaction, the market is forming a struggle for 84-85K zone, which generally indicates buying weakness. Before the further fall there may be a short-squeeze relative to the above mentioned zones of liquidity, which may lead to a further fall
Regards R. Linda!

BITCOIN → The fall continues... 82K → 76K → 73KBINANCE:BTCUSD is in a sell zone. Trump's comments on the federal reserve, crypto summit failed to impact the crypto market other than a global shakeup and liquidation...
The market has failed to see a proper bullish driver, so far. Trump's comments on the Fed ended in a global shakeup (liquidation). Yesterday's summit went so far as to prevent the cryptovalt market from turning green.
Technically. Global growth is temporarily halted, the flagship is moving into a deep correction phase, with 73K still the primary target. The market needs liquidity, as it will not be possible to grow at the expense of buyers and only bullish leverage all the time.
Price is forming a 90K - 82K range in the short zone after exiting the global consolidation. False break of 91K resistance ( global consolidation support ) ended with a fall, which may continue to both 82K and 73.5K.
Resistance levels: 89400, 91K, 93K
Support levels: 82K, 78K, 73K
The key zone of interest and liquidity is 73-66K. The price is working on a false break of resistance, the imbalance of forces in favor of bears, thus the first stop may happen in the zone of 82K ( lower boundary of the range ). Further it is necessary to observe the reaction to the support. Consolidation, breakdown and consolidation below 82K will provoke a fall to lower targets.
Regards R. Linda!

CRUDE is looking weak. Price connection is expected#CRUDE #Analysis
Description
---------------------------------------------------------------
+ Crude has formed a nice descending triangle pattern and price has broken down the support line which formed over the years.
+ A clear breakdown from this support would push down the prices further.
+ Next target is 50-40$ range.
---------------------------------------------------------------
Enhance, Trade, Grow
---------------------------------------------------------------
Feel free to share your thoughts and insights. Don't forget to like and follow us for more trading ideas and discussions.
Best Regards,
VectorAlgo

USDJPY → Readiness to break the daily support levelFX:USDJPY is testing strong key support at 148.64 for a breakdown. A falling dollar could affect further movement
The falling dollar is supporting the Japanese Yen, thus we may see the currency pair falling.
The price is trying to break the support of the daily level. A pre-breakdown consolidation of 150.3 - 148.64 is formed relative to this support. The last retest of the level ended with a small false breakdown, indicating that there is no one to defend the support anymore, there was no reaction except for another local consolidation, the purpose of which is to accumulate the potential to break the support.
Resistance levels: 150.3, 150.95
Support levels: 148.64, 147.17
The focus is on the level of 148.64 concerning which the market is struggling. The bulls have little chance to hold this level, as the dollar's fall exerts quite a lot of pressure.
The breakdown and fixing of the price below 148.64 may provoke a fall to 147 - 144.
Regards R. Linda!

USDJPY → Retest of key resistance before fallingFX:USDJPY breaks the bullish structure of the market. Dolla in the correction phase has a favorable impact on the market. The currency pair is forming a retest of the previously broken trendline after a strong impulse
The yen reached a 10-week high on Thursday, causing the USDJPY pair to fall to 149.5. Investors are looking for safe-haven assets due to increased trade tensions caused by Donald Trump's aggressive tariff policy.
The Japanese currency received additional support due to expectations of an interest rate hike by the Bank of Japan, which will increase its attractiveness for investors
For now, the focus is on the 0.5 fibo resistance zone, 150.95, and previously broken upside support
Support levels: 149.5, 148.64
Resistance levels: 150.95, 151.4
Most likely, before a possible fall, the price will be able to test the previously broken support, and now it is resistance 150.95 - 151.4. False breakdown of the key Fibo zones may provoke further fall.
Regards R. Linda!

SOL on the Slide: Is a Bounce from $150 in the Cards?Solana has been in a downtrend for over 30 days after reaching its ATH at $295.83. For the past two weeks, SOL was stuck in a trading range that formed a descending triangle (a bearish pattern) which eventually broke down, confirming the downtrend. Additionally, SOL lost its yearly support level at $189.31. Where is SOL heading next? Let's find out!
Key Support Zone
Our main long opportunity is around the $150 level, where several confluences align:
Fibonacci Levels:
The 0.5 fib retracement of the entire 5-wave structure sits at $151.92.
The 0.786 fib retracement from the 5th wave is at $149.77.
A fib extension 1.618 of the descending triangle is at $148.65, which is very close to the $150 mark.
Volume Profile:
The Point of Control (POC), highlighted by the red horizontal ray, is around $144, adding another layer of support.
Trade Setup
Currently waiting for SOL to reach the support zone between $152 and $144. An alarm is set when price nears these levels for a long opportunity.

A Bearish Case for Diageo: Breaking Critical Support LevelsThe descending triangle pattern on Diageo’s weekly chart presents a strong bearish signal, suggesting that the stock may be poised for a deeper decline. Historically, descending triangles indicate mounting selling pressure, and with price action nearing critical support levels, the risk of a breakdown is significantly high.
Currently, Diageo is approaching key lows last seen in 2020, around 2050, a level that previously acted as a strong support zone. However, the confluence of technical factors suggests this support may not hold:
1️⃣ Fibonacci Retracement Confluence – Just below 2050, the 2026 level aligns with a key long-term Fibonacci retracement. While this could act as a temporary support zone, the broader technical setup suggests further weakness.
2️⃣ The Psychological 2000 Level – Round numbers often serve as psychological barriers in the market, but with a descending triangle breakdown, this level may fail to provide meaningful support.
3️⃣ Measured Move Target: 1875 – When analysing the height of the descending triangle pattern, its projected move suggests a breakdown well beyond the above-mentioned support levels. A clean breach of 2050 could see a swift move lower, with 1885 emerging as the next major target.
With the weight of these technical indicators aligning, the path of least resistance appears to be downward. Unless Diageo finds an unexpected catalyst for recovery, breaking these key levels could trigger further selling momentum, forcing the stock into deeper correction territory. Traders and investors should approach this setup with caution, as the evidence strongly favours a bearish continuation. 🚨📉
N.B. Understanding the Descending Triangle Pattern
A descending triangle is a bearish chart pattern that forms when the price action is characterized by a series of lower highs converging towards a horizontal support level. This pattern signals increasing selling pressure, as buyers fail to push prices higher while sellers continuously drive prices downward.
Key Features of a Descending Triangle
1️⃣ Horizontal Support Line – The price consistently finds support at a particular level, creating a flat base.
2️⃣ Lower Highs – Price fails to reach previous highs, forming a descending trendline.
3️⃣ Breakout Expectation – A descending triangle typically breaks downward once sellers overwhelm buyers at the support level.
4️⃣ Volume Decline & Expansion – Volume usually declines as the pattern develops and increases significantly at the breakout.
________________________________________
How to Measure the Descending Triangle
To predict a potential price target, traders measure the height of the triangle and project it downward from the breakout point.
✅ Step 1: Identify the Pattern
• Find the flat support level where price repeatedly bounces.
• Draw a descending trendline connecting the lower highs.
✅ Step 2: Measure the Height
• Take the distance from the highest point of the triangle (initial peak before lower highs start forming) to the horizontal support level.
• Example: If the high of the triangle is 2675 and the support level is 2275, the height is 400 points.
✅ Step 3: Project the Breakdown Target
• Once price breaks below the support level, subtract the measured height from the breakdown point.
• Example: If the breakdown occurs at 2275, then:
o 2275 - 400 = 1875 (expected price target).
________________________________________
Confirming the Breakout
📉 Bearish Confirmation:
• A daily or weekly close below support, ideally with an increase in volume.
• Retests of the broken support level that now act as resistance.
⚠️ False Breakouts:
• Sometimes, price may briefly dip below support and reverse higher.
• Confirmation is key before entering trades based on the descending triangle pattern.
________________________________________
Final Thoughts
A descending triangle is a powerful bearish signal, particularly when seen in downtrends. Traders use it to identify potential breakdown opportunities and set realistic price targets. Risk management is crucial, as false breakouts can occur, and waiting for confirmation increases the probability of a successful trade.
Disclaimer:
The information posted on Trading View is for informative purposes and is not intended to constitute advice in any form, including but not limited to investment, accounting, tax, legal or regulatory advice. The information therefore has no regard to the specific investment objectives, financial situation or particular needs of any specific recipient. Opinions expressed are our current opinions as of the date appearing on Trading View only. All illustrations, forecasts or hypothetical data are for illustrative purposes only. The Society of Technical Analysts Ltd does not make representation that the information provided is appropriate for use in all jurisdictions or by all Investors or other potential Investors. Parties are therefore responsible for compliance with applicable local laws and regulations. The Society of Technical Analysts will not be held liable for any loss or damage resulting directly or indirectly from the use of any information on this site.

Hitting a bottom on MATIC?...I don't really trade Crypto's however this one stood out to me as a potential opportunity on the weekly time scale.
MATIC has been trending down since late 2021 but it has always shown a bounce around the $0.30 zone, ultimately creating a very large descending triangle coupled with a MACD that has been diverging up.
Could we see a rally ahead towards $1.00+? well that remains to be seen but I liked the setup and took the opportunity. Should be interesting in how this develops and thus, I'll be keeping an eye on this one.
I'm also checking out DOGE and XRP.
As always, Good Luck & Trade Safe.

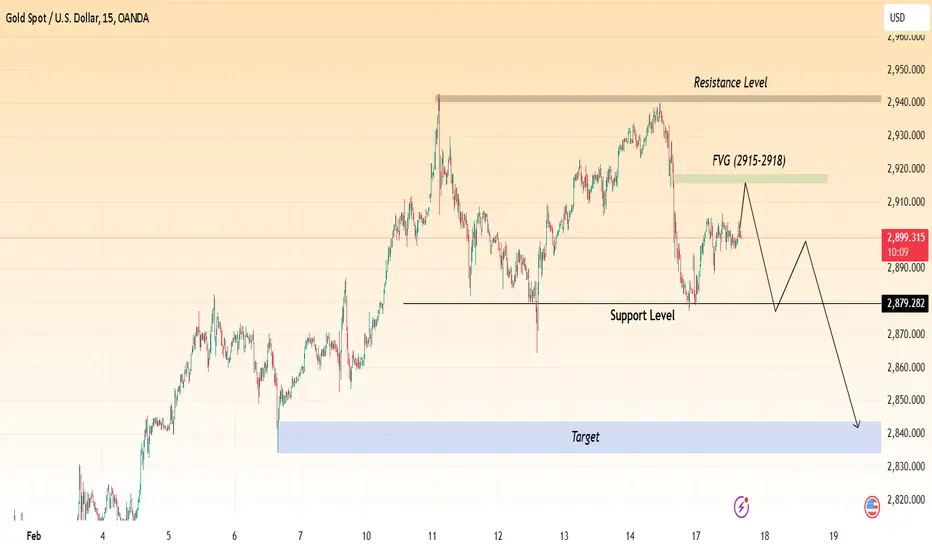
XAUUSD 15-Minute Chart Analysis! 2840!Overview:
Gold is currently trading around $2,900, showing a potential bearish setup based on key technical levels. The chart highlights an important Fair Value Gap (FVG), support and resistance levels, and a possible price movement scenario.
Key Levels:
🔸 Resistance Zone: $2,940 - $2,950
A strong supply zone where price previously reversed.
If price reaches this level, sellers might step in.
🔸 Fair Value Gap (FVG: $2,915 - $2,918)
A price imbalance that could act as a short-term resistance.
If price taps into this zone, it may reject downward.
🔸 Support Level: $2,879
A key horizontal level that has acted as support before.
If price holds here, a bounce is possible.
A break below could trigger further downside movement.
🔸 Target Zone: $2,840 - $2,830
A demand zone where buyers could re-enter.
Projected Price Movement:
📉 Bearish Scenario (Main Outlook):
1️⃣ Price moves into FVG ($2,915 - $2,918) and rejects.
2️⃣ Drops towards support at $2,879 for a retest.
3️⃣ A break below $2,879 confirms further downside.
4️⃣ Targeting the $2,840 - $2,830 zone.
📈 Bullish Invalidations:
If price breaks and holds above $2,920, it could push higher toward $2,940 - $2,950 resistance.
A breakout above $2,950 would shift bias to bullish.
How to Use This on TradingView:
✅ Look for bearish signals (rejection wicks, strong red candles) near FVG before shorting.
✅ Watch for a breakdown below $2,879 to confirm further downside.
✅ If price holds above $2,920, reconsider bearish bias.
EURUSD → Pending a breakout of resistanceFX:EURUSD is trying to take a chance amid the dollar correction. The price is forming a retest of consolidation resistance for a breakout and further growth
After an attempt to break the downtrend resistance, the price moves into consolidation and forms a range of 1.053 - 1.021. Inside this set-up a local channel (consolidation) is formed and the price tests the resistance at 1.038. The market is still trying to confirm the change of trend and get stronger on the background of the dollar correction.
The fundamental background is complicated due to the tariff war and economic crisis....
Resistance levels: 1.038, 1.053
Support levels: 1.033, 1.021
A breakthrough of the resistance at 1.038 and price consolidation above this area may trigger further growth within the distribution of the accumulated potential
Regards R. Linda!

SBICARD – Descending Triangle Breakout 920 to 1100+ TargetSBICARD has been trading within a descending triangle pattern for an extended period, with lower highs and a strong horizontal support. This pattern is typically bearish but can lead to bullish breakouts when resistance is breached, as seen in this case.
Breakout Confirmation & Key Levels
Resistance Breakout:
The stock has successfully broken above the descending trendline resistance, indicating a potential trend reversal.
Buying Zone:
Above ₹800 – A sustained move above this level confirms the breakout.
Stop-Loss Level:
Below ₹750 – Any close below this level could invalidate the bullish setup.
Target Levels:
Initial Target: ₹920+
Projected Target: ₹1100+ (based on pattern height projection)

BITCOIN → Down to $90,000. Downside risks are risingBINANCE:BTCUSD feels the change of mood and continues to form set-ups hinting at a possible continuation of the correction. Another retest of the 90K risk zone is possible.
On the medium-term timeframe bitcoin failed to hold near ATH, in the upper consolidation range and entered the local selling zone, under the level of 99800. A negative note is felt in the cryptocurrency market, as well as a change in sentiment. Altcoins continue to break through bottom after bottom without any positive prospects. Bitcoin at this time is most likely resentful of the US governing apparatus due to the fact that no promises from Trump have been kept so far, and the price is moving into a protracted correction in the local perspective
Briefly, here's what's going on:
Expectations: Bitcoin reserve, cryptocurrency market support, transparent regulation, pumping the market ...
Reality: new scam coins created before the US election that sucked all liquidity, market manipulation, trade war with almost every country on the planet, dumping the market into the abyss.
Support levels: 95.8 (trigger), 91300, 90K
Resistance levels: 100.2, 102.67
Technically, the situation is that bitcoin may continue its decline and test 90K again, from which the risks around 90K will grow.
At the moment, the price is in consolidation between 95.8 - 100.2. A pre-breakdown consolidation is forming near the support, foreshadowing the support breakdown and further fall to 90K. But, due to the dependence of the asset before the actions of politicians in the U.S., the price may shake out to 100.2 before further falling
Regards R. Linda!

OMUSDT → Consolidation in a triangle before the rallyBINANCE:OMUSDT is a paranormal coin in this case, as it is one of the few projects that shows bullish dynamics while all altcoins are finding bottom after bottom.
Perhaps the situation partly depends on BINANCE:BTCUSD . If it starts to fall even deeper, nothing and no one will help here. But locally bitcoin is forming a resistance breakout and if the bulls hold this trend, the BINANCE:OMUSDT.P coin may have a bullish driver that can support the bullish movement.
At the moment, the focus is on the triangle (wedge) resistance and the base of the 5.6756 pattern. Two bullish scenarios should be considered: Growth after a resistance breakout or growth after a false breakdown of support.
Resistance levels: 5.9821, 6.30
Support levels: 5.75, 5.6756
At the moment, a consolidation within the triangle boundaries is being formed. But when the resistance is broken, the market may move to the realization phase and the impulse may be quite sharp. Ahead, beyond 6.3, there is no resistance...
Regards R. Linda!

BITCOIN → The price is getting ready to drop to 100K - 97KBINANCE:BTCUSD is facing strong resistance. The price is being pushed away from the 105-107K zone as much as possible, forming a defense conglomerate. But, this resistance cannot overshadow the global bullish situation yet
A controversial situation is forming on H1-H4: a descending channel and a symmetrical triangle. And everything depends on what part of the market sees which figure. The primary reaction to the triangle support may be accompanied by a rebound, but based on the situation with the resistance, we can assume that the rebound from the triangle will not be deep and the price will try to go down.
If we look at the descending channel, the price is held back from falling by the support at 101.600.
Yes, technically, it is the support of 101.600 that plays the main role now. The main question is whether this level will hold the price or not.
Fundamentally, the situation is debatable, as the situation mainly depends on America, on how Trump and officials will use rhetoric regarding cryptocurrencies. It could be a bubble, a scam to win an election, or empty talk. Or it could be an actual strategy
Resistance levels: 103.4K, 105.8K
Support levels: 101.6K, 99.6K
Emphasis on 101.6. In the short term, I expect a breakdown and price consolidation below the level followed by a drop to 100-97K
BUT! Since there is a symmetrical triangle on the chart, a false breakdown of 101.6 may lead to a small upward bounce before a further fall to 100K
Regards R. Linda!

USDCHF → The bullish trend may get its continuationOANDA:USDCHF is entering the realization phase after a prolonged correction. A favorable background is created by the uptrend and rising dollar
The technical outlook on the daily timeframe is very good. The price after breaking the trend resistance tested the previously broken line. The currency pair after the false breakout managed to consolidate above the key point, marking an interim bottom and further prospects.
Technically, the focus is on the resistance at 0.911, if the bulls can overcome this area and consolidate above this level, the currency pair will be able to realize a rise to 0.918 - 0.93.
Resistance levels: 0.911
Support levels: 0.90555
Before breaking the resistance, the currency pair could test 0.90555 due to the liquidity generated below this area. But, the trigger that can provoke further growth is 0.911
Regards MARKET ANALYZER
