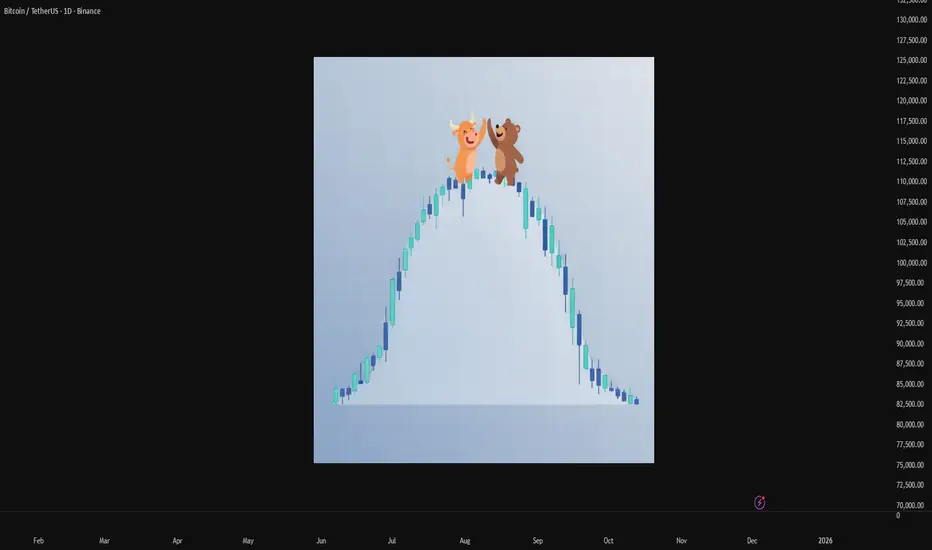
The Bell Curve: Understanding Normal Distribution in TradingMost traders have seen the “bell curve” at some point, but very few actually use it when they think about risk and returns.
If you really understand the normal distribution, you’re already thinking more like a risk manager than a gambler.
1. What is the normal distribution?
The normal distribution is a probability distribution that describes how values tend to cluster around an average.
If you plotted a huge number of outcomes (for example, daily returns or P&L per trade), the shape you’d get would often look like a symmetric bell :
- Most observations are close to the center.
- As you move away from the center in either direction, outcomes become less frequent.
- Extreme gains and losses are possible, but they’re relatively rare.
Mathematically, a normal distribution is usually written as N(μ, σ):
μ (mu) is the mean – the average outcome.
σ (sigma) is the standard deviation – a measure of how widely the outcomes are spread around that mean.
In trading terms:
If your returns roughly follow a normal distribution, you should expect many small wins and losses clustered near zero, and only occasional large moves in either direction.
2. Mean (μ): the “drift” of your system
The mean is the point at the center of the distribution. On a chart of returns, this is where the bell is highest.
If μ > 0, the bell is shifted slightly to the right → your system is profitable on average.
If μ < 0, it’s shifted to the left → your system slowly loses money over time.
For a trading strategy, μ is basically your edge. It doesn’t need to be huge. Even a small positive mean return, if it’s consistent and combined with disciplined risk management, can compound strongly over the long run.
3. Standard deviation (σ): volatility in one number
The standard deviation controls how wide or narrow the bell curve is.
- A small σ gives a tall, narrow bell → outcomes are tightly clustered around the mean.
- A large σ gives a short, wide bell → outcomes are more spread out, with bigger swings away from the mean.
Think of σ as a statistical way to describe volatility:
- For an asset: how much its price typically moves relative to its average change.
- For your strategy: how much your returns or daily P&L fluctuate.
Two systems can have the same mean return but very different σ:
- System A: μ = 0.2%, σ = 0.5% → relatively smooth ride.
- System B: μ = 0.2%, σ = 2% → same edge, but a wild equity curve and deeper drawdowns.
Same average, totally different emotional and risk profile.
4. The 68–95–99.7 rule
One of the most useful features of the normal distribution is how predictable it is. Roughly:
- About 68.2% of observations lie within ±1σ of the mean.
- About 95.4% lie within ±2σ.
- About 99.7% lie within ±3σ.
So if daily returns of an asset were approximately normal with:
- Mean μ = 0.1%
- Standard deviation σ = 1%
Then under that model you’d expect:
- Roughly 68% of days between –0.9% and +1.1%
- Roughly 95% of days between –1.9% and +2.1%
- Only about 0.3% of days beyond ±3%
Anything far outside that ±3σ range is, in theory, a very rare event. In practice, that’s often the kind of day everyone remembers.
5. Why this matters for traders
Even with all its limitations, the normal distribution is a powerful framework for thinking about risk:
Position sizing
If you know (or estimate) the standard deviation of your returns, you can form an idea of what “normal” daily or weekly swings look like, and size positions so those swings are survivable.
Stop-loss logic
Stops that sit right in the middle of the usual noise (within about ±1σ) will get hit constantly.
Stops closer to the ±2σ–3σ region are more aligned with “something unusual is happening, I want to be out.”
Expectation management
Most days and most trades will fall inside the “boring” part of the bell curve.
Understanding that prevents you from overtrading while you wait for the edges of the distribution – the bigger opportunities.
6. The catch: markets are not perfectly normal
Real markets often break the textbook assumptions:
- Returns tend to have fat tails → extreme moves happen more often than a normal distribution would predict.
- Distributions are often skewed → one side (usually the downside) has more frequent or more severe extreme events.
That means:
- A move that looks like a “5σ event” under a normal model might actually be something that happens every few years.
- Risk models based strictly on normal assumptions usually underestimate crash risk.
- Strategies like option selling can look very safe when you only think in terms of a normal distribution, but they are very sensitive to those fat tails.
So the normal distribution should be treated as a baseline model, not as reality itself.
7. Quick recap
The normal distribution is the classic bell curve that describes how values cluster around an average.
It’s parameterized by μ (mean) and σ (standard deviation).
Roughly 68% / 95% / 99.7% of observations lie within 1σ / 2σ / 3σ of the mean in a perfectly normal world.
Markets only approximate this; they usually show fat tails and skew, so extreme events are more common than the simple model suggests.
Even with those limitations, it’s a very useful tool for thinking about returns, drawdowns, and the range of outcomes you should be prepared for.
Deviation
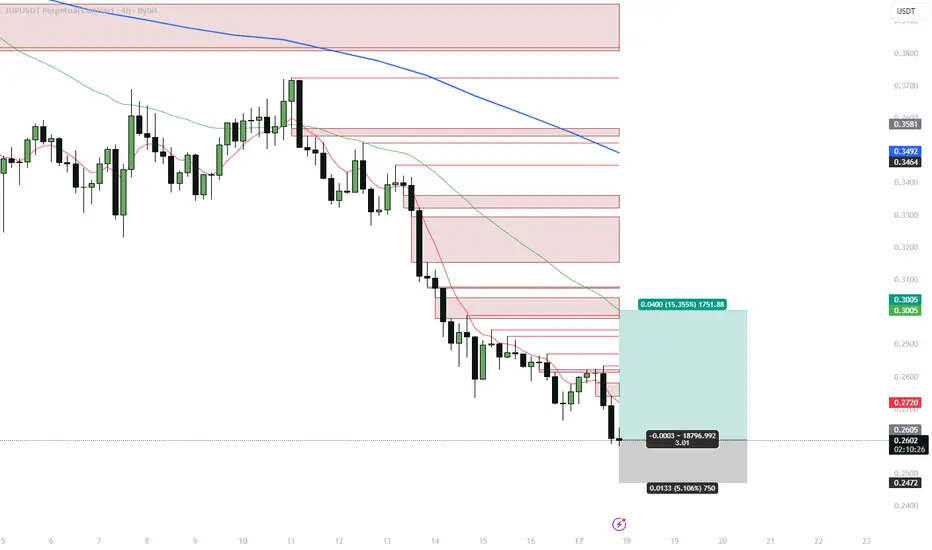
JUP 4H – Deviation long from lower rangeJUPUSDT (Bybit) is trading near the lower end of its autumn range after a clean 4H downtrend from the 0.33–0.34 area. My 4H EMA deviation system has just printed a long signal as price extends away from the higher-timeframe averages.
Technical setup (#4h)
Price is below the 4H, 1D and 3D EMAs, with Dev% on multiple TFs showing strong downside extension (high single-digit / low double-digit % below the mean).
We’ve just tagged a new local low around 0.25–0.26 with several multi-TF exhaustion markers firing near the lower ATR band.
Overhead, the first liquidity pocket and resistance cluster sits around 0.26–0.28, with a larger supply/FVG zone and EMA confluence around 0.30–0.31.
I treat this move as a late leg of the existing selloff and a potential mean-reversion opportunity back into the 4H EMA ribbon and prior supply.
Strategy stats (this 4H deviation system)
Backtest/forward sample: 33 trades, all longs
Win rate: ~69.7% (23 wins / 10 losses)
Avg PnL per trade: ~+4.1%
Avg winning trade: ~+10.0%
Avg losing trade: ~−9.6%
Avg bars in trade: ~34 bars on #4h (≈ 5–6 days), with losers typically lasting longer than winners
The system is built to catch oversold 4H swings with a relatively high hit rate and symmetric win/loss size, so sticking to invalidation levels is crucial.
Trade plan (swing 3–7 days)
Entry: around 0.26 (current long triggered in this area).
Main target: 0.300–0.305 — previous 4H supply zone and confluence with the EMA band.
Stop / invalidation: below 0.247. A 4H close under this level would mean the current demand failed and opens the door toward deeper supports around 0.23–0.22.
This setup offers roughly 3:1 R:R from entry to the 0.30–0.305 target.
Fundamental snapshot (Jupiter)
Jupiter is the main DEX aggregator and perps venue on Solana. Over the last 30 days:
Protocol fees / revenue are roughly $78.8M / $19.0M, showing a robust on-chain business across spot + perps.
Governance approved a burn of ~130M JUP (~4% of circulating supply) from the Litterbox Trust (vote passed on 4 Nov 2025).
Token unlocks continue on a scheduled basis (e.g. ~53.47M JUP on 28 Oct 2025), keeping some overhang in the short term.
November 2025: launch of the Jupiter ICO / launchpad platform, adding another product line on top of swaps and perps.
Saros DLMM integration is aimed at deeper liquidity for JUP and ecosystem pairs.
Net read: cash-flow-positive DeFi infra with upcoming product catalysts, but short-term price still sensitive to unlocks and derivatives positioning — a good environment for volatile swings and mean-reversion trades.
Alternative scenario
If unlock / derivative selling pressure accelerates and JUP starts closing 4H candles below 0.247, I’ll consider this idea invalid and look for a new deviation long lower in the 0.23–0.22 zone rather than averaging down.
Not financial advice — this is my structured 4H EMA deviation long on JUP, combining system stats with current Jupiter fundamentals.
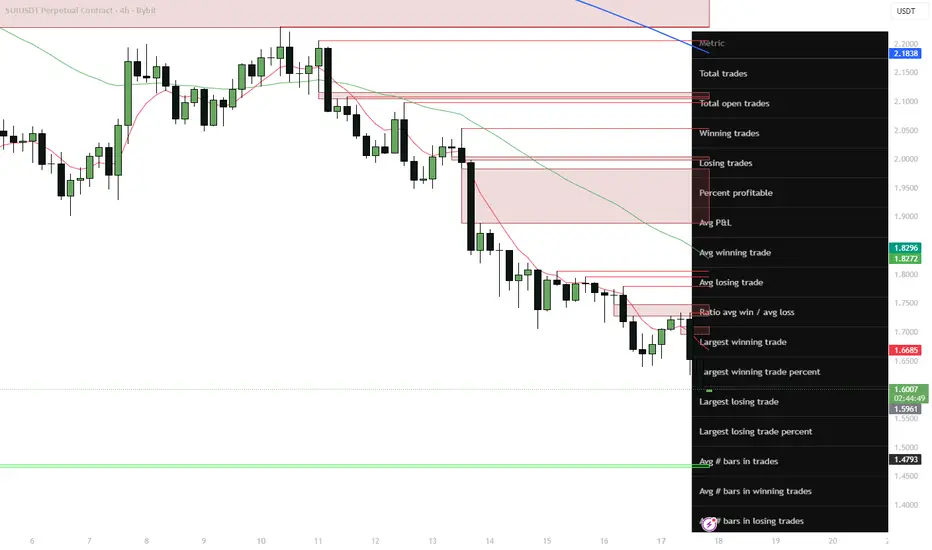
SUI 4H — Deviation long into unlock risk (mean-reversion setup)Got a fresh long signal from my 4H EMA deviation strategy on SUIUSDT (Bybit).
After a persistent downtrend from the 2.3–2.0 area, price has flushed into my lower deviation / demand zone and is now extended from the main EMAs on several timeframes.
On the chart (#4h):
– Price is trading well below the 4H and 1D EMAs, Dev% on multiple TFs shows strong extension away from the mean.
– We just printed another local low with a cluster of my multi-TF “exhaustion” signals, right on the lower ATR band.
– Above price sit the first liquidity pockets around 1.66–1.69 and then a larger supply/FVG zone near 1.75–1.83, aligned with the 4H EMA ribbon.
– I treat this move as a liquidation / unlock front-run leg inside a still-resilient higher-TF range for SUI.
Strategy stats (for this 4H deviation system)
31 trades, all longs:
– Winrate ≈ 83.9% (26W / 5L)
– Avg win ≈ +12.5%, avg loss ≈ −6.6% → avg R:R ≈ 2.37
– Avg holding time ≈ 24 bars on #4h (about 4 days)
So the system is designed to take oversold 4H swings and ride the mean-reversion back into the EMA band / supply zones over 2–5 days.
Trade plan (swing 2–5 days)
– Entry: around 1.60–1.62 (current long triggered near 1.61).
– Main target: 1.75–1.77 — first 4H supply zone and mid of the previous distribution block.
– Extended target: 1.82–1.83 — upper boundary of the 4H supply cluster and confluence with higher EMA/ATR levels.
– Invalidation: 4H close below 1.48. That break would mean the current demand zone failed and I step aside.
This gives an R:R of roughly 1:2 from entry to the extended target.
Fundamental snapshot
SUI is still holding in the upper part of its yearly range despite the recent correction. Over the last 30 days:
– TVL around ~$3.03B (≈$1.64B bridged, ~$1.39B native), with strong DEX volume (~$383.5M/day) and perps volume (~$144.3M/day).
– Narrative tailwinds: upcoming USDsui native stablecoin from Bridge (Stripe-backed), institutional rails via Crypto.com custody/liquidity, and the Mysticeti v2 core upgrade from Mysten Labs.
– Headwinds: notable November unlocks (~$146.6M pool), TVL pullback of ~15% from the October peak and sector-wide risk-off in L1/alt space.
Net read: structurally positive fundamentals and growing ecosystem, but short-term risk is higher due to unlocks and derivatives positioning — ideal conditions for sharp but tradeable mean-reversion moves.
Alternative scenario
If unlock selling and risk-off pressure continue and SUI starts closing 4H candles below 1.48, I’ll treat this as a deeper leg toward the next demand around 1.40–1.35 and will wait for a new deviation signal rather than averaging down.
Not financial advice — just a structured 4H deviation long based on my system stats and current SUI fundamentals.
SYRUP 4H — Deviation long (Maple Finance)SYRUP (Maple Finance) printed a strong flush on the 4H chart and is now trading in my first demand / deviation zone after breaking down from the 0.42–0.45 range.
Fundamentals remain constructive:
– AUM > $5B in Q3, up ~66% QoQ.
– Q3 revenue around $4M with an October ATH of ~$2.16M.
– 25% of protocol revenue is allocated to SYRUP buybacks and staker rewards (MIP-018/019), directly linking the token to cash flows.
So we have a fundamentally supported DeFi credit token going through a short-term deleveraging move.
On the 4H chart:
– Price is trading below both 4H and 1D EMAs, with Dev% showing clear oversold conditions vs the mean.
– The last leg down came with a vertical selling cluster into the lower ATR band.
– Above price, the key liquidity zones are 0.422–0.423 (broken support + EMA area) and 0.44–0.445 (supply cluster / range high).
I treat this as a potential mean-reversion setup rather than a fresh downtrend start.
Trade plan (swing 1–5 days)
– Long area: 0.395–0.405, with optional partial add on a spike toward 0.38.
– Main target: 0.422–0.423 — retest of broken support and the 4H EMA region.
– Extended target: 0.44–0.445 — upper supply zone and range high.
– Invalidaton: 4H closes below 0.355. Stop goes under this level; if it breaks and holds, the setup is done and I wait for a new base lower (0.334–0.31).
This gives an approximate R:R of ~1:2 toward the main target and higher if the extended target is hit.
Alternative scenario
If DeFi risk keeps unwinding and 0.355 fails to hold, I expect price to explore the 0.334–0.31 area, where a new accumulation zone may form. In that case this long idea is invalid and I’ll re-map the structure before looking for the next entry.
Not financial advice — just my 4H EMA deviation swing framework combined with current fundamentals on Maple Finance.

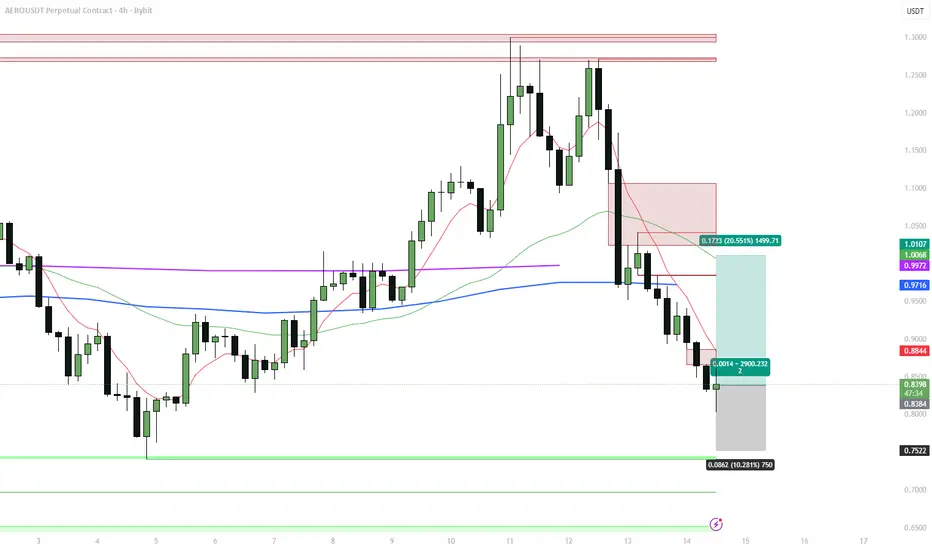
AEROUSDT 4H – EMA Deviation Long on Base Liquidity Engine1. Setup
Aerodrome is still the main liquidity flywheel on Base and is now set to merge with Velodrome into a single AERO token that will also live on Ethereum and Circle’s ARC. After the post-news flush, price on Bybit perps sits around 0.84–0.85, below the 4H EMA band and inside my demand + deviation zone.
I’m taking a 4H EMA Deviation long with a swing horizon of ~1–3 days.
2. Technical context (4H)
The local trend topped near 1.10–1.12, where multiple higher-TF order blocks sit. From there we got a clean breakdown through the 4H EMA ribbon and a series of lower lows into the green demand cluster around 0.82–0.84.
Current trade levels on the chart:
Entry: 0.842
Stop: 0.758 (below demand and the last capitulation wick)
Target: 1.014–1.02 (4H EMA re-test + prior consolidation / supply)
That’s roughly +20.5% upside vs −10.3% downside, R:R ≈ 2:1.
The 4H deviation sits above its average “stretched” reading, so the setup fits my mean-reversion rules rather than chasing trend.
3. Strategy statistics – 4H EMA Dev Long (AERO)
Backtest on this pair / timeframe: 26 trades, long only.
Winrate: 80.77%
Avg PnL per trade: +8.24%
Avg winner: +10.98%
Avg loser: −3.28% → win/loss size ratio ≈ 3.34
Largest winner: +25.17%, largest loser: −5.67%
Avg duration: 24 bars, winners around 21 bars, losers ~36 bars
Historically, losers are shallow but drag out longer; if this bounce doesn’t materialise within a typical 20–24 bar window, I’d rather cut than sit through slow bleed.
4. Fundamentals & narrative
Active positives right now:
Merge with Velodrome into one protocol and token (“AERO”) launching on Ethereum + Circle’s ARC. Existing Aerodrome holders are set to receive 94.5% of the new supply – strong alignment for current AERO holders.
Aerodrome controls ~53% of Base’s ~$4.7B DeFi TVL via ve(3,3) mechanics. About 45% of AERO is locked with an average remaining lock of 2.8 years, and protocols compete for veAERO via $2–4M weekly bribes, generating 35–45% APR from real fees, not emissions.
Narrative kicker: deposit tokens from JPMorgan reportedly already operating on Base, with the chain framed as a “default banking L2”. If that flow scales, first-order liquidity beneficiaries are AERO, lending, and major DEX routes on Base.
Expired but still relevant context:
Programmatic buybacks via the Public Goods Fund – over 150M AERO acquired and 4y-locked across PGF, Flight School, Relay.
Aerodrome crossed into deflation in September 2025, with cumulative $400M+ fees and a model where 100% of DEX revenue goes to veAERO lockers.
Large strategic lockers include Coinbase and Animoca, strengthening the “institutional Base” story.
Score: BBB+ / Positive, with key risks in narrative overextension (Base banking thesis needs confirmation), merge execution, and general market beta.
5. Trade plan & invalidation
Idea: play a mean-reversion bounce from 4H demand + EMA deviation back into the 1.00+ supply zone, while the Base / merge narrative is still hot and fee flows stay strong.
If price closes 4H below 0.758 and can’t quickly reclaim the EMA ribbon, I treat the setup as invalid and step aside – that would indicate a deeper reset of the whole move from 0.70. If we tag 1.00–1.02, I’ll realise most of the position there and only trail a small runner in case the merge and Base catalysts trigger a new leg to fresh highs.
Not financial advice – just documenting a systematic EMA Deviation long on one of the key Base liquidity primitives.
PLUMEUSDT 4H – EMA Deviation Long on RWA + USDC CatalystSetup
BYBIT:PLUMEUSDT just printed a fresh 4H EMA Deviation long signal after a sharp flush below the EMA stack. Price is trading around 0.038–0.039, with all key timeframes (15m, 1H, 4H, 1D, 3D) in “Below / Oversold” state on my EMA Dev dashboard. Current 4H deviation is ~28%, above the historical oversold average (~26%), which fits my rules for a mean-reversion long.
I am looking for a bounce back into the 4H EMA band and the nearest supply zone, where the previous distribution leg started.
Technical context
The downtrend from 0.055–0.056 pushed price under the 4H and 1D EMAs and into the lower ATR corridor. The last impulsive candle washed out local longs and expanded deviation to one of the highest readings in the current sample.
Key levels on the chart:
• Entry zone: 0.038–0.039 (current 4H demand / max negative deviation)
• First target: 0.0485–0.0490 (4H EMA cluster + local supply)
• Optional second target: 0.055–0.056 (prior breakdown area / 1D EMA region)
• Invalidation: sustained 4H close below the spike low around 0.034–0.035
As usual with this strategy, I’m not trying to catch the exact bottom – the edge comes from entering when deviation is stretched and closing into the EMA / resistance band.
Strategy stats (PLUME, 4H EMA Dev long)
Backtest sample: 20 trades, long only.
Winrate: 75%.
Avg PnL per trade: +3.75%, avg winner +8.15%, avg loser −9.45% (win/loss ratio ~0.81).
Largest winner +17.4%, largest loser −15.4%.
Losing trades tend to last longer (≈62 bars) than winners (≈25 bars), so if price sits under EMAs too long without mean reversion, I prefer to cut rather than “marinate” in drawdown.
Given the current ~28% negative deviation, the upside to the 4H EMA/supply (~+25–28%) is larger than the historical average winner, while downside to invalidation is kept near the typical loss profile.
Fundamentals & narrative
Plume is positioning as an RWA chain with a focus on compliant tokenized assets:
CCTP V2 and native USDC are now live on Plume, enabling smoother cross-chain liquidity flows.
Nest Protocol is relaunching on Plume using Pendle-style mechanics with TVL in the hundreds of millions, supporting the yield/RWA narrative.
There is active collaboration with Circle (CCTP + USDC workshop) and a growing stack of institutional RWA products (WisdomTree funds, Galaxy allocation, prior SEC transfer-agent registration, etc.), although some of those catalysts are already “spent” in the short term.
Main overhang: an upcoming unlock of ~239.65M PLUME (~2.4% of supply) on 21 December, which can cap the upside if spot demand doesn’t keep up. My fundamental score here is around BBB+ – constructive RWA + USDC story, but with clear unlock risk.
Trade plan
Base case: fade the current oversold deviation on 4H, ride the move back into 0.048–0.049, and optionally trail a small remainder toward 0.055–0.056 if momentum and flows improve.
If price fails to bounce and closes 4H below 0.034–0.035, I consider the EMA Dev setup invalid for now and step aside until a new deviation cluster forms.
Not financial advice – this is a systematic mean-reversion long based on my EMA Deviation framework plus the current RWA / USDC catalysts on Plume.

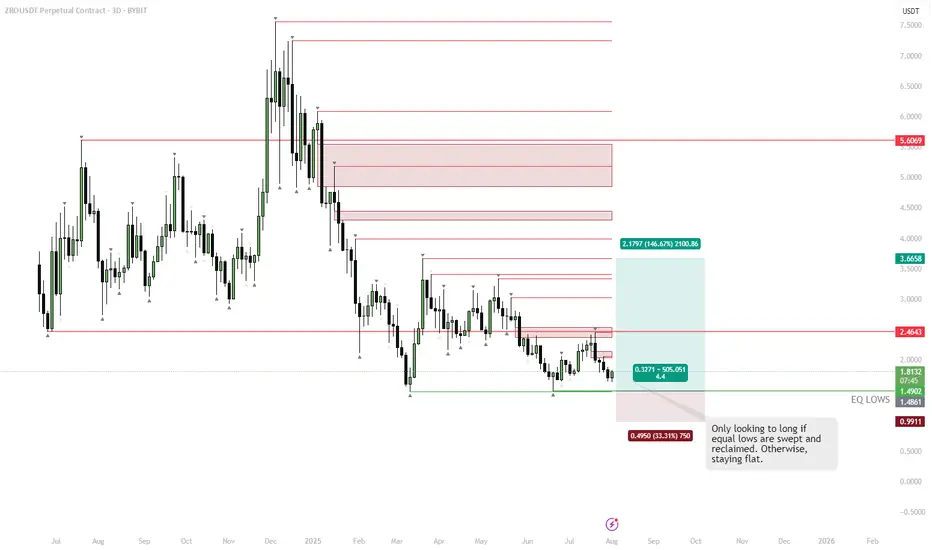
ZRO – Best SetupPrice is consolidating near key equal lows around $1.48–1.50. Liquidity likely sits below these lows, making a sweep into that zone attractive for larger players. Chasing longs here is risky without confirmation.
Plan:
• Wait for a clean sweep below the equal lows
• Look for a strong reclaim of the range back above $1.50 (failed breakdown)
• Entry trigger is confirmation of buyers stepping in after the sweep
If these conditions are met, targeting $2.46 and higher makes sense. No sweep/reclaim = no trade.
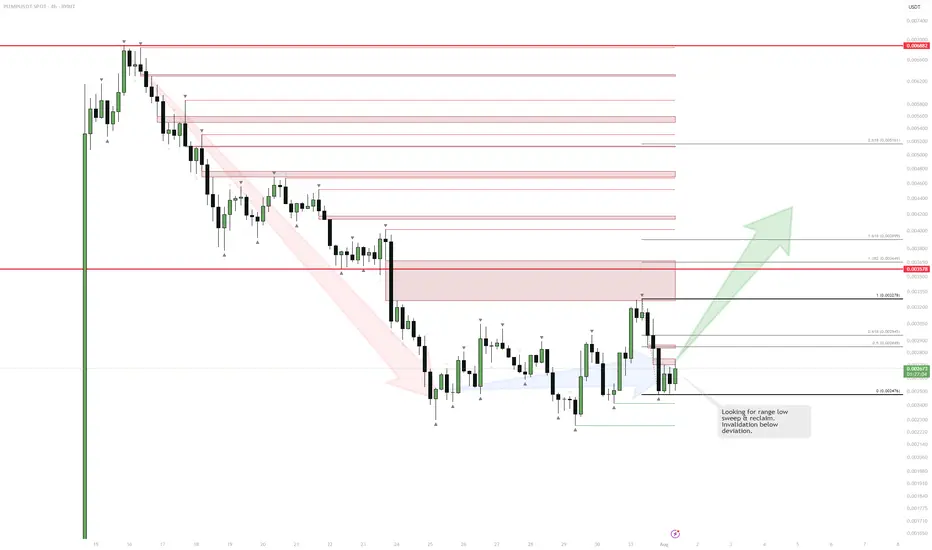
PUMP | Watching for Base ConfirmationThe sharp downtrend is showing signs of exhaustion as price starts to consolidate and build a potential range.
If we see a sweep and reclaim of the range low, that would confirm the start of a new accumulation phase and signal a potential reversal.
The invalidation for any long attempt is a confirmed breakdown below the deviation or the origin of the reclaim.
Plan:
Wait for a clean sweep and reclaim of the range low to trigger a long entry.
Target resistance levels above, with stops set below the reclaim origin.
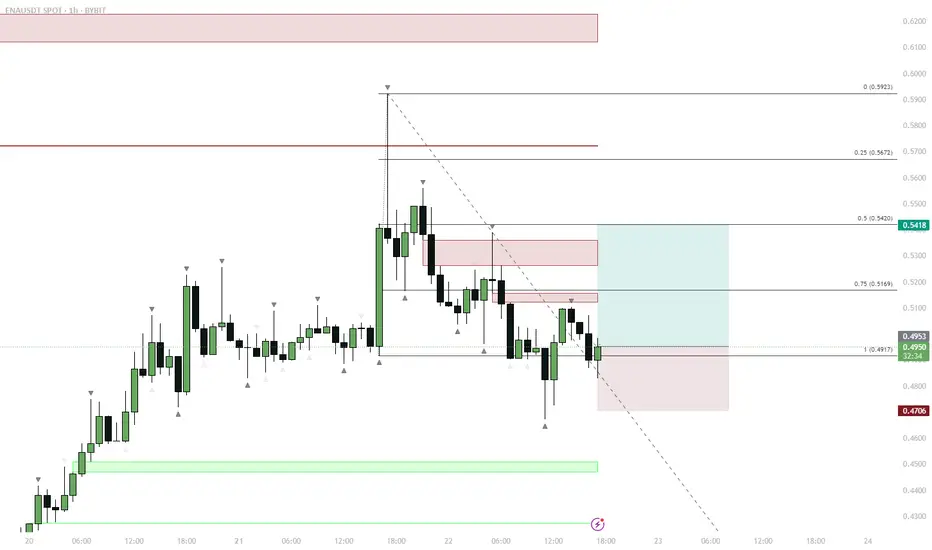
ENA — Range Deviation & Reclaim: LTF Long Setup
ENA traded in a tight LTF range, then deviated below support, forming a sweep/liquidity grab.
Price quickly reclaimed the range low and retested the FVG (Fair Value Gap) below the range.
This reclaim/flip is a classic bullish reversal setup after a sweep.
Entry on the retest of FVG and previous support, targeting a move back to mid-range and then range highs.
Invalidation below the deviation low (stop).
Price action shows a textbook range deviation and reclaim setup. ENA swept liquidity below the range, trapped shorts, and reclaimed support, forming a bullish reversal signal. The retest of the FVG provided a high-probability entry for a move back to the range highs. This play relies on the principle that deviation and reclaim below a range often leads to a reversal as trapped sellers are forced to cover.
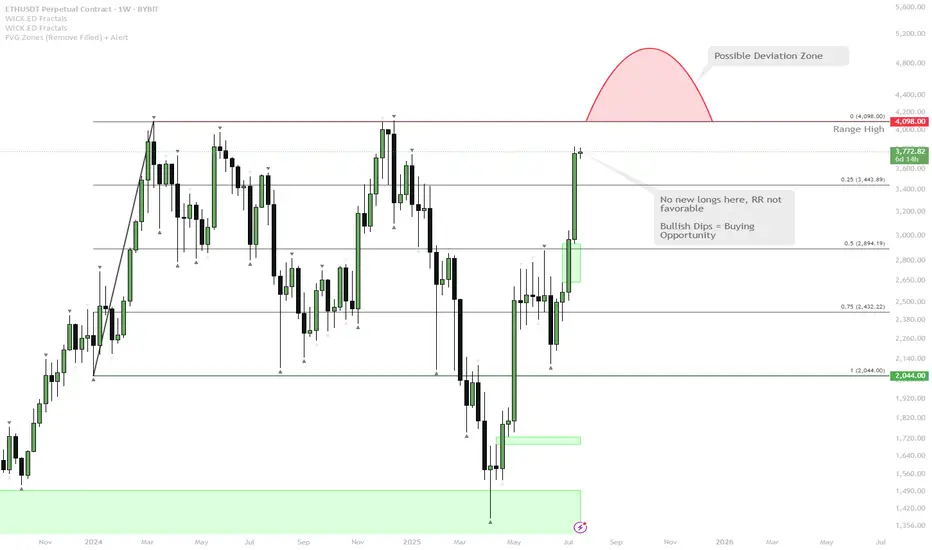
ETH Approaching Major Resistance — Watch for Range High Deviatio
ETH has rallied strongly and is now testing the range highs around $4,100.
The most likely scenario is a direct tap or wick above the range highs — this is a classic spot where the majority expects continuation, but also where deviations (fakeouts) frequently occur.
If price closes above and holds, it could trigger further upside. However, the risk/reward (RR) for fresh longs here is not attractive after such an extended move.
A deviation above range high (quick push above, then close back inside) is possible and would be a bearish signal in the short term.
After this wave, any deep dips in ETH will likely be a high-conviction buy, given the strong bullish momentum.
ETH is showing extremely bullish momentum as it approaches a major weekly resistance at the range high. The obvious play here is a sweep or break of this level, but with the move being so extended, a deviation or fakeout becomes increasingly likely. While momentum is still up, waiting for a dip or failed breakout (deviation) is a better risk/reward play than chasing longs here. Any meaningful pullback will likely present an excellent buying opportunity given the macro strength.
Two zones to long the SPX500Hello Traders, there are 2 zones that you can enter market.
the first one is between 5980 and 5950. If it coincides with Bollinger lower band, it could go up more sharply.
in that case top of red bearish channel could be considered as the 1st tp.
The 2nd option available after breaking the top zone, in reverse to 6132 we could enter the market again. Remember that again Bollinger band could help us to confirm the long trade. 6240 could be used as TP, as well as the higher band of Bollinger band is a good place to take profit.

10% PUMP Incoming If...Keeping an eye on $GRASS here. Once level is #reclaimed, 10% pump to next #resistance more likely.
Calculate Your Risk/Reward so you don't lose more than 1% of your account per trade.
Every day the charts provide new information. You have to adjust or get REKT.
Love it or hate it, hit that thumbs up and share your thoughts below!
This is not financial advice. This is for educational purposes only.

BIGTIME/USDT: LOW RISK, HIGH REWARD TRADE SETUP!!Hey everyone!
If you're enjoying this analysis, please give it a thumbs up and follow!
BIGTIME is showing strong potential! It’s forming a descending triangle and has created a confirmed deviation. Currently, it’s bouncing off the lower trendline of the triangle, presenting a solid buying opportunity. Consider entering here and adding more on dips.
Entry range: CMP and accumulate up to $0.106
Targets: $0.121 / $0.132 / $0.149 / $0.175 / $0.20 / $0.222
Stop Loss (SL): $0.0965
Leverage: 2x - 4x
What do you think of BIGTIME's current price action? Are you spotting a bullish setup? Share your thoughts and analysis in the comments below!

FTM/USDT LTF RANGELocally, I'm considering the formation of a sideways range between the 1-hour order block (OB), with targets below for a partial and full fill of the 4-hour fair value gap (FVG) imbalance, followed by a growth reaction. If there is consolidation above the local support level (SUP), I anticipate a sweep of the upper liquidity pools, a cover of the 4-hour order block (OB), and then a downward price movement to capture the lower liquidity pools.

Mishtann Foods Correction Almost OverFailed to break out and hold, became a deviation and we back in the multi year range. Think correction is nearly complete, we will test the 200 weekly ema and then I think we bounce from there. lets see what the reaction is like at that point.

NFP/USDT: READY FOR AN ATH! 6X FROM HERE!!Hey everyone!
If you're enjoying this analysis, a thumbs up and follow would be greatly appreciated!
NFP looks good here. Forming a falling wedge-like structure in the daily time frame confirms its deviation below the trendline and gets back inside the wedge which is a bullish scenario. Buy some now and add more in the dip.
Entry range:- $0.28-$0.31
Targets:- $0.43/$0.58/$0.76/$1.12/$1.44/$1.84
SL:- $0.20
What are your thoughts on NFP's current price action? Do you see a bullish pattern? Share your analysis in the comments below!

FIL/USDT READY FOR AN ATH!Hey everyone!
If you're enjoying this analysis, a thumbs up and follow would be greatly appreciated!
FIL looks good here. Forming a bull flag-like structure in the daily time frame and confirming, it's deviation.
Also, fundamentally it is a solid coin. Buy some here and add more in red days.
Entry range:- $4.0-$4.6
Targets:- $5.2/$6.4/$8.1/$9.8
Invalidation: Daily close below $4
What are your thoughts on FIL's current price action? Do you see a bullish pattern? Share your analysis in the comments below!

DOT/USDT: Potential Breakout from Falling Wedge?Hey everyone!
If you're enjoying this analysis, a thumbs up and follow would be greatly appreciated!
DOT/USDT looks good in the daily time frame. Forming a falling wedge-like structure here and trying to break it out. A successful breakout will take the price to bear ATH. Buy some here and add more in the dip.
Entry zone:- $6.04-$6.48
Targets:- $7.4/$8.8/$10.5
SL:- $5.7
What are your thoughts on DOT's current price action? Do you see a bullish pattern? Share your analysis in the comments below!

BTC run commencesBTCUSD has dipped of recent days after been range bound for several months.
It has seen a lot of selling pressure over the last week, while the bears have had some control. However, bears haven't been strong enough and price has failed to break through a key support level around 60,5 that has kept this rally in strong bull territory.
Mt Gox news should have given bears enough ammunition to break this level, but was stopped by bull market indicator at the 200 ema.
As long as the 200 ema holds we remain in strong bull territory and this deviation at a key support level and rejection at 200 ema confirms for me that prices want to go higher.
RSI has dipped into oversold territory, coinciding with the bounce.
Invalidation currently sits at 57,3 while we target the mid 80's with partial profits to be taken around ATH.

Predicted Reversal at -5 Deviation!Time & Price 👁
NY PM Session offered beautiful reversal at -5 deviation which beautifuly overlapped with Discount of Dealing Range and H1 BISI (Buyside Imbalance Sellside Inefficiency)
Also notice how bodies stayed ABOVE -4 Deviation! It's not random.

#BTC: Upward Trend Emerging? Breakout from Falling Wedge PatternHello everyone! If you enjoy this content, please consider giving it a like and following for more updates.
Great recovery so far! After a quick dip to $56k, Bitcoin has shown some resilience.
As you can see on the chart, the price surged above the crucial resistance level of $62k, potentially confirming a bullish reversal or deviation. Additionally, the breakout from the falling wedge pattern adds further bullish technical momentum.
Based on this pattern, we could potentially see a price increase towards the previous high of $73,400. However, it's important to note that this is just a possibility.
Invalidation of this bullish scenario: A daily close below the $62k level would weaken the current bullish momentum. ⬇️
What are your thoughts? Share your technical analysis and insights in the comments below!

Standard deviation projection based off manipulation legThis clear setup shows where price is projected to go based off of the manipulation leg. Price disrespects and pushes through the reversal zone. Price comes back and retests the zone and continues up to the projected -4 area.

YFI Huge Fakeout ! Yearn Finance (YFI) has orchestrated a strategic move, executing a feigned breakout from a descending triangle—a bullish pattern that saw a swift sweep of the $14,000 level. In this analysis, we unravel the narrative behind YFI's tactical retreat, its implications, and the anticipated journey back into accumulation.
Chart Analysis: The Intricate Dance of YFI
YFI's recent price action presents a nuanced storyline on the charts, characterized by a false breakout and a subsequent retreat into a potential accumulation zone.
Key Observations:
Feigned Breakout from Descending Triangle:
YFI exhibited a false breakout from the descending triangle, creating an illusion of bearish momentum.
The rapid sweep of the $14,000 level marked a calculated move to trigger liquidity.
Retreat into Accumulation:
Following the feigned breakout, YFI is retracing back into what appears to be an accumulation zone.
Accumulation zones are often strategic areas where institutions and savvy traders gather positions.
Critical Levels: YFI's Recharge at $14,000
Strategic Retreat and Accumulation:
The retreat from the false breakout aims to accumulate positions at a key level.
$14,000 emerges as a critical zone for replenishing liquidity and preparing for the next move.
Potential Scenarios: YFI's Journey Back to Prominence
Accumulation and Strategic Reentry:
The retreat into the accumulation zone sets the stage for strategic reentry.
Savvy traders may position themselves within this zone, anticipating a renewed bullish surge.
False Breakout as a Tactical Move:
YFI's false breakout could be interpreted as a tactical move to shake out weak hands.
The subsequent accumulation phase may serve as preparation for a more sustained bullish advance.
Trading Strategy: Navigating YFI's Tactical Landscape
For traders considering YFI in their strategy:
Accumulation Zone Entry: Assess entry opportunities within the identified accumulation zone.
Monitoring $14,000 Level: Keep a close eye on the $14,000 level for potential confirmation of strategic moves.
Risk Management: Implement risk management strategies to navigate the inherent volatility.
Conclusion: YFI's Strategic Maneuver and the Road Ahead
As YFI retraces from its feigned breakout, the narrative suggests a strategic accumulation phase underway. Traders are poised for potential bullish movements as YFI recharges at the $14,000 level, highlighting the intricate dance between feints and strategic positioning in the crypto arena.
🚀 YFI Analysis | 🛡️ False Breakout Tactics | 🔄 Retreat into Accumulation
❗See related ideas below❗
Share your insights and analyses on YFI's tactical retreat in the comments, contributing to the collective intelligence of the crypto community. The journey through false breakouts and strategic retreats adds layers of complexity to the YFI saga. 🌐📈🚀
