USDT.D Daily | Explosive Surge from 4% –Altcoins Bloodbath Ahead🔹 Overview
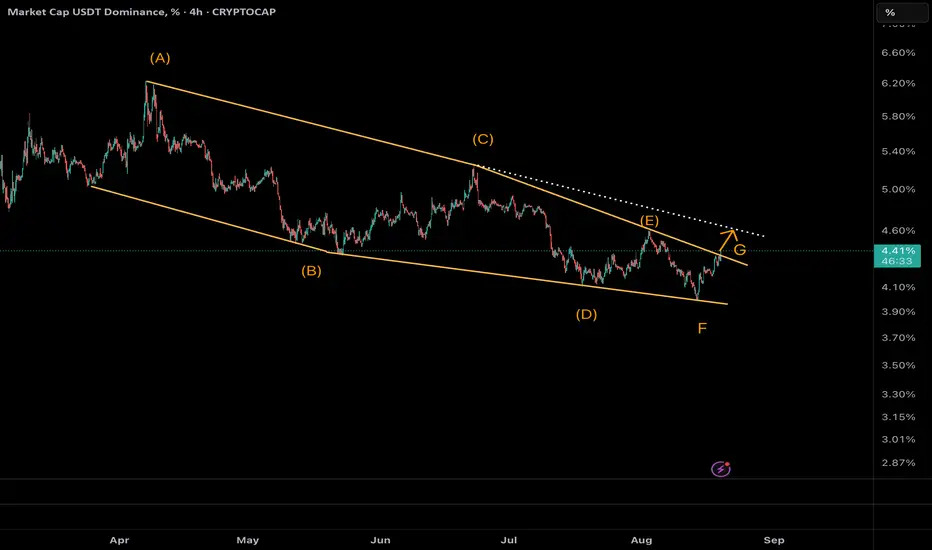
USDT Dominance (USDT.D) has completed a 7-wave Diametric correction inside the descending yellow channel. Now, Wave G is accelerating with strong momentum.
, dominance is at 4.33%, breaking the channel trendline. This confirms the end of the correction phase and signals the start of a dominance rally.
Our prior forecast from the 4% floor is playing out exactly—capital is flooding into stables as risk-off sentiment crushes Altcoins.
⸻
🔹 Wave Structure (NeoWave)
• Diametric unfolded as A-B-C-D-E-F-G.
• Symmetry holds: large A/C/E/G vs. small B/D/F.
• Trendline break = pattern completion.
Monowave count (~55–70) confirms the structure’s legitimacy.
⸻
🔹 Technical Setup
• Current support: 4.28% (brown line).
• Target 1: 4.6% (Fib 1.618 extension + trendline).
• Target 2: 5% (channel midline).
• RSI bullish divergence + rising volume confirm strength.
⸻
🔹 Market Implications
This breakout means:
⚠️ Altcoin Bloodbath incoming.
USDT dominance rally = liquidity moving away from alts. BTC/ETH may stabilize, but alts risk heavy drawdowns.
⸻
🔹 Trade Idea (Bullish USDT.D)
• Entry: Long USDT.D (or short alts) above 4.33% on BOS confirmation (daily).
• Targets: TP1 = 4.6%, TP2 = 5%.
• Stop Loss: Below 4.28%.
• Risk: 1–2% per trade. Trail stops if midline breaks.
⸻
🔥 Get ready for a stablecoin takeover & brutal altcoin flush.
Diametric
USDT Dominance – Precision Repeats: Final Wave F or Wave G Awake🔸 Market Structure:
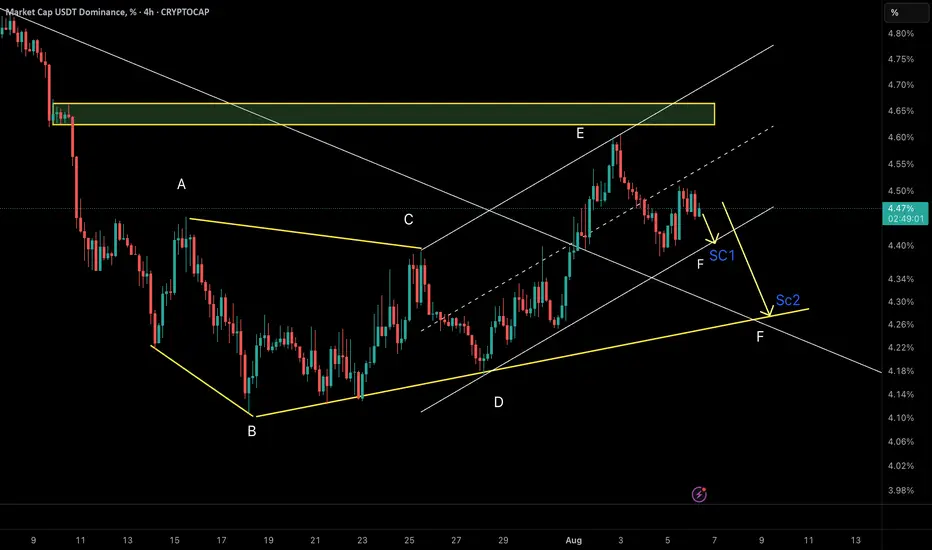
Following the previous analysis, which precisely reached both projected targets, Tether Dominance continues unfolding its Diametric formation. After completing Wave E, price action has decisively shifted into Wave F, progressing toward the final stages of this structure.
⸻
🔸 Key Observations:
• The prior scenario anticipated a corrective decline, and price perfectly respected both the 4.40% and 4.28% targets before stabilizing.
• Currently, price is testing the ascending trendline and mid-range of the Diametric.
• Momentum remains corrective but has yet to show clear exhaustion.
⸻
🔹 Scenario 1 (Sc1) – Shallow Wave F Completion (~4.22%):
• Support around the minor ascending trendline.
• May trigger an early bounce if buyers step in.
• Less balanced geometrically for a clean Diametric conclusion.
🔹 Scenario 2 (Sc2) – Extended Wave F Completion (~4.12%):
• Aligns with the lower boundary of the Diametric.
• Provides better proportion and symmetry to finalize Wave F.
• Coincides with prior demand zone and the last reaction pivot.
• Statistically, this remains the higher probability path.
⸻
🎯 Expected Path:
Wave F is approaching maturity, and a deeper test near 4.12% remains likely before any sustainable reversal. Upon confirmation, this could trigger the start of Wave G upward, historically associated with altcoin weakness.
⸻
📌 Summary:
After executing the prior analysis with precision, USDT Dominance has advanced into the final legs of Wave F within the Diametric. Monitoring price behavior near 4.12% will be critical. A bounce here could catalyze Wave G and renewed pressure on altcoins. Should short-term support at 4.22% fail convincingly, deeper retracement becomes even more probable.
⸻
✅ Action Plan:
Closely track the reaction zones at 4.22% and 4.12%. A strong reversal signal (e.g., bullish divergence) could confirm the transition to Wave G.
USDT Dominance – Diagonal Ending? | Wave F in Progress🔸 Market Structure:
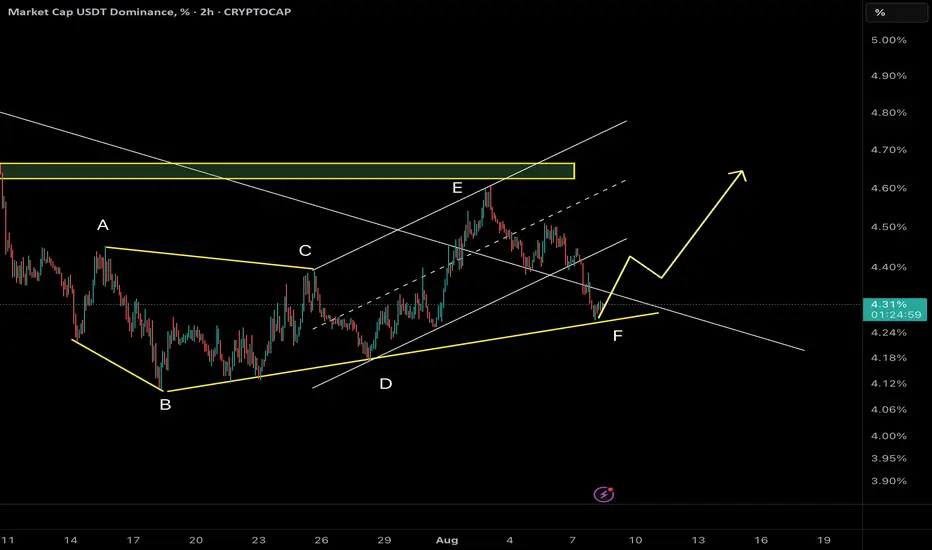
Tether dominance is currently unfolding in a contracting diagonal (Diametric) formation, and we are now in wave F of the structure. Diagonals typically alternate in direction and converge toward a terminal point.
⸻
🔸 Key Observations:
• Price has rejected from the top of wave E
• Wave F is now unfolding as a corrective move down
• Two potential targets are identified for wave F completion
⸻
🔹 Scenario 1 (Sc1): 4.40%
• Short-term ascending trendline support
• Possibility of a shallow correction before another bounce
• Less ideal in terms of geometric balance of the diametric
🔹 Scenario 2 (Sc2): 4.28%
• Aligns with the lower boundary of the diametric pattern
• Converges near previous demand/resistance flip zone
• Better symmetry and structure for a completed wave F
• This scenario is currently more probable
⸻
🎯 Expected Path:
Wave F likely targets 4.28% before any significant bounce, aligning with a complete structure.
⸻
📌 Summary:
USDT dominance is likely in the final stages of a Diametric pattern. We’re watching for signs of completion around 4.28%, which aligns better structurally. A bounce from 4.40% is possible, but less favored unless strong bullish evidence appears.
Doge(based on NEo wave)this G wave of broken diametric is a bow-tie diametric .
I have my confirmation to buy it on G wave of bow-tie diametric and my stop loss is E wave.

First scenario for GOLDScenario 1:
Gold is forming a diametric bow tie pattern and we are currently in wave (e) of this pattern.
The diametric pattern can end at $2200 and then we expect the price to rise above $2400.

Mana Bullish DiametricWe will see if this happens, should launch very soon if this is correct... invalidated if it really goes any lower than here and if it takes much more time.
Not advice.

COMPUSDTafter more than one year downtrend and completing a complete Diametric wave pattern, I expect a Expansion in price for targets mentioned in the chart.

SNX 1DA beautiful diametric pattern has completed and now we expect to see a price to rise in the next few months to 6$

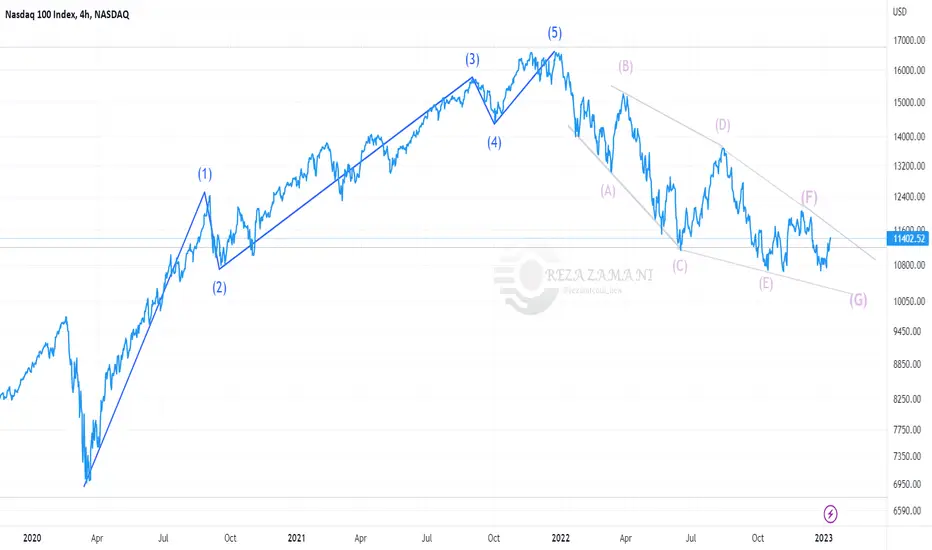
NAZDAQ is correcting in diametric waveHello
NAZDAQ is in a diametric wave and now is correcting as wave G
What do you think?
USDT Diametric chartHello
Today, i'm going to present you the USDT diametric chart you may never seen elsewhere
Please boost this post and share your ideas
regards
reza

AUDUSD is a symmetrical in wave CHello
AUDUSD has completed Wave A as a diametric and now on the way to wave G of a symmetrical wave
What do you think?
Regards
Reza

SPY diametric chartHey Guys
I just found out that SPY has a diametric chart and we're covering wave G
Please let me know what you think
Regards
Reza

XAGUSD I expect Silver to form a correction in Daily TF, as Wave G of this Diametric and then we shall see a very strong move above 30$. Will be looking for sell positions, with RSI trendline trigger or 4h Trendline forming in the chart.
I'll try to update this if Wave G of this Diametric forms.

Bitcoin SHORT 3X is now going to HIGHHello friends
It's the time to have a bull run for BITCOIN SHORT 3X from these levels
What do you think?
Please write it to me

GBPUSD Analysis and Wave AnalysisGBPUSD Analysis and Wave Analysis
Pattern Diametric in Wave E Triangle Pattern

EURUSD symmetrical diametric chartHello
This is another diametric charts i've analyzed
What do you think about it. please write to me and share your idea
regards
reza

bitcoin bowtie diametric chart patternHey Guys
This the bowtie diametric analysis of bitcoin's 4H chart i'm publishing
This wave is going down is wave G
please don't hesitate to share your ideas
regards Reza

S&P 500 Index _ LongDaily chart of S&P 500 shows that there is a good chance that a Diametric pattern is forming and we are currently in the middle of Wave F of this correction. Targets for Wave F is clear in the chart. After that I expect another leg down for S&P to reach Strong support zone.

BTC Rising Wedge Breaking Down to 10k (Neowave/Elliott wave)Bitcoin at this timeframe appears to have formed into a flat with a terminal impulse ( rising wedge ) for wave-c. We're now breaking down from that wedge and should see a complete retracement of wave-c in less than 50% of the time it took to form. This will confirm the terminal action for wave-c and confirm that we are heading down to the next major support around 10k. If 10k is unable to hold the next support for wave-E is 6k.

BNBUSD WAVE And Pattern Analysis The correctional structure, especially the three waves, whether in descending or ascending and pulse correction, indicates the formation of a diametric pattern.
This post is just a personal idea and analysis should not be the criterion for buying or selling
The last specified pattern is currently in a flat pattern. The structure is in high time and the whole chart is in the form of a diametric pattern. You can see the ascent from this area, but lower levels can be achieved

ENV Wave AND PATTERN Analyzing Be sure to stick to Stop Lost and TAkE Profit. This is an idea and not a bargain offer
The structure of the diametric wave is forming in the B wave, or it is in the X-wave construction stage, or the biametric wave is not yet complete, and the F and g waves remain.

AUDUSD WAVE AND PATTERN ANALYSIS TRENDThis post is just a personal idea and analysis should not be the criterion for buying or selling
It seems to be in the g-wave and based on confirmation from other currency pairs such as eurusd, which has a negative correlation with this currency pair and the euro is bullish, this currency pair will probably fall to the specified range in the long run.
It may form in the same diametric microwave
The range I consider for the target is 0.47780
In the rectangles on the chart, the patterns formed in the past in microwaves are labeled in different time cycles and can be used for teaching and learning.
On the chart, I tried to segment as much as possible the educational tips related to the classic Elliott and Elliott in neowave style in the rectangles I drew and the formation patterns in different time cycles. I hope my efforts will be useful for educational materials.
My prediction is that the price will reach this level in the next 4 to 5 years

NVIDIA WAVE AND PATTERN ANALYSIS The correctional structure, especially the three waves, whether in descending or ascending and pulse correction, indicates the formation of a diametric pattern. For the formation of wave b, which is another sign of diametric wave formation in wave a and g, in 1999 and 2019, respectively, we see diametric waves in their microwaves.
In the case of the formation of this structure, we will see a deep decline in many companies listed on the US stock exchange, which will last for several years and we are at the beginning of a possible major recession.
This post is just a personal idea and analysis should not be the criterion for buying or selling
