Spotify diamond topSpotify is showing mixed signals with the formation of a diamond top which is indicative of a bearish reversal, evident on the chart. Also, formation of an island top which are a quite reliable bearish reversal chart pattern. The uncertainty in this chart may be evident to investors which choose to capitalise on this or sit out.
Personally I use Spotify myself..
Diamondpattern

INFY Parabolic trendINFY has formed a parabolic upward trend with multiple bottom points, including a diamond bottom. Uptrend can be seen to be a strong trend with a regression analysis of .84. Looks overwhelmingly bullish.

Ark diamond topArk diamond top formation, the 'diamond forms after an upward price trend. Breakout is upward' results in a short-term bullish continuation. Very consistent in a bull market with 21/23 Performance rank however in a bear market quite inconsistent with a rank of 2/19.
A

BOEING DIAMOND TOPBoeing forming a diamond top, it's a rather rare pattern but can be profitable if it plays out.

More bad news looming- diamond Pattern set up now or earnings?I bought Dec 27th 280/300/320 for .60 last Friday due to $BA not acting right - news came that they are halting production. I have been trying to enter long trades but yet news never gets any better - so I decided to switch it up and buy a put fly. The trade was trading at 3.25 this AM - I left my position on. I will cover half if stock closes green tomorrow and possibly enter a short term call fly targeting the 350 area.
Let me know what you think?
-- I strictly place options trades.

Silver LongHere we have a classic by textbook diamond formation, sign of an equal power between bulls and bears,
Long term the price will follow the direction of the break out in which case that direction points upwards.
The macro scale of the price action also shows a bullish divergence inside a descending channel that price has been consolidating for the last couple of months since that high at 18.67 on September 23rd .
Oscillators a bit noisy on the 4H but the divergence comes through on this time frame connecting the lows at 16.835 and 16.635 and 16.49 we can clearly see a bullish divergence on the MACD and a bullish divergence on the 16.635 and 2649 on the RSI - which also gives Bulls the upper hand for the long term. Switching on the Daily the same divergence comes through pretty clear.
Happy Trading , Volatile markets ahead, keep safe : )

$PLX Long to .50-1+ in 2020? *Speculative*Speculative long on PLX. Accelerated path to approval from FDA. From TA standpoint - charts tried to make a diamond a couple of times, but failed. Will third time be successful to push higher?
Opened for 2k shares at .24

BTC (Y19.P2.E11).v3.Something to watch out forPotentially a diamond formation taking place.
Quotes from 3 sources.
1) This can be a reversal or a continuation. where break up is 70% chance, and the chance of a break down is 30%.
2)
How much has #Bitcoin rallied as a result of its Halvings to date?
Halving 1:
+13,378%
Halving 2:
+12,160%
3)
The market has a way of inflicting pain on late entrants, always.
It does not care about your plans.
Keep an eye out for the signs of total negativity and complacency by bears.
Diamond bottom formation reference > www.profitf.com

N

#bitcoin - continues falling to it´s support (3D)Good Sunday morning traders,
last week I have been saying, that there is space down to minimum $ 8165. Looking at this still very valid potential diamond bottom pattern just sitting
on the so important Yearly Pivot. So the big question is, where this is going to break. Considering the fact we are on top of the P-Y and it´s position, the odds
are better to break this upwards, I am expecting a rather strong move within the next 2 weeks, until then possibly ranging in the lower $8k´s waiting for buy-orders
to kick in.
What would be very typical Father Bitcoin is a break-down and strong stop-run to take out the shorts and heading back up to form a low. (Or the other way around)
I am refusing to set targets for either direction at the moment, simply because Bitcoin has been a bad boy recently.
Anything else stays the same. As usual I have marked you the important upcoming supports / resistances. (Also have a close look at the cloud!)
I am still scalping by the way. Not ready to take a more steady position just yet. :)
Happy trading.
Neru
p.s. I´d be very happy about a like and comment! Thanks!!


#bitcoin - #diamondbottom #chartpattern , 3DDear Traders,
obviously this is just an idea and nothing that can be traded by now. For this I have taken out one of my former charts, where I tried to show you the stages that are probably awaiting us.
Currently I am still not bearish mid to long term. This drop was caused by a broken key-level around the Monthly Pivot and we are now starting to approach the first zone of possible support (yellow area).
At this point I am starting to see a possible diamond bottom pattern forming out. It is very early, so no forecasts can be based on this.
Anyhow the old trend line is around this support-area as well and likely some orders are going to be hit soon.
What I would not like mid-term is another break below the Yearly-Pivot. We are still in a very neutral zone, where anything can happen.
Warm regards,
Neru

EOSBTC Diamond Pattern| Breakout Imminent !Hello Traders!
Today’s Chart update will be on EOS/BTC, we have a potential diamond pattern coming into its apex, suggesting that a break in either direction is imminent…
Points to consider
- Trends is overall bearish
- Local support and resistances are posed by the diamond formation
- Structural resistance in confluence with diamond bull break
- Stochastics trading neutral
- RSI approaching apex zone
- EMA’s neutral, no clear direction
- Volume declining
- VPVR decreasing in transactions in both bull and bearish direction of the diamond pattern
EOS macro trend is considered to be bearish, putting in consecutive lower highs as it entered into to current diamond pattern. Local resistance and support of the diamond pattern are converging, coming closer to its apex; a break will be imminent in the near future.
Structural resistance is in confluence with the technical bull break target of the diamond pattern. A bear break target will however post new yearly lows for EOS, a break in either direction is imminent, we just need to wait for confirmation.
The Stochastics is currently trading neutral, momentum is stored both ways for the bulls and bears, we don’t have a clear direction as of yet. The RSI is however approaching its apex; a break will come to fruition which will be in confluence with the actual price break from the diamond pattern.
EMA’s are quite neutral with no clear direction; price is clearly trading through it. A break will establish either support and or resistance for the EMA’s, this will obviously be in confluence with a bull and or bear break.
Volume is declining, low volume suggests that a breakout is coming; we need to see an influx of volume with follow through to avoid a false breakout. The VPVR is quite interesting, volume of transactions have decreased both ways, this signals low levels of resistance posed by the VPVR when price breaks its apex…
Overall, IMO, a break from this pattern in either direction is very close, with concessive targets. We have volume declining as price comes closer to its apex, an influx of volume is more likely to come to fruition which will signal the break from the pattern.
What are your thoughts on this diamond pattern?
Please leave a like and comment,
And remember,
“Accepting losses is the most important single investment device to insure safety of capital.” – Gerald M. Loeb
E


Ethereum Falling Wedge Breakout into Diamond PatternBullish Convergence is forming on ETH on the Daily Time Frame. On top of that you are nearing the apex of the Diamond Shape pattern after a falling wedge breakout. All near areas of presumable value. On top of the bullish signs I have spotted, you are also showing significantly lower amounts of selling volume compared to the last major impulse down. A breakout of this wedge can lead to amazing gains. It seems impossible now, but common retraces from the very swing top are depicted on my chart inside the pink box. Those are presumable areas where price action may reverse if we ever got to those areas ;)
Twitter: twitter.com
If you want to be a loving supporter of me and my "ChArtworks"
$BTC: 35tmT7MAQXZm7rr1KzZMWNRpN2iyrnSB4z
$LTC: LVfCT9fu4dYyFAo5cW5xLrzHZHWFoG85hn
$ETH: 0x390d207b9bde62f2806caddfb94809de61da50d9
$x42: XZXm43FJcZHEVNs9dh8mdfzWyY6VfmJvPc
Donations are never required but they are greatly appreciated! Your Supportive comments and follows are just good enough too :D <3
Join the best Crypto and Technical Analysis Community in the world!
Discord: discord.gg
(Mitch Ray's Channel) Amazing community and I highly recommend checking out Mitch Ray if you haven't yet!

BTC - A possible diamond patternI wanted to try and figure out what pattern this recent price action was forming, and I realised that there seems to be a sort of diamond shape.
- Diamonds can form as both 'tops' and 'bottoms', so the only way to know is to wait for a clear break of the shape.
Where BTC is right now ($7970) it looks like it needs to hold the bottom support and create a large wick, showing some defence from bulls in that region.
My only concern about this shape is that bitcoin has been creating higher lows since the 27th of September. So this might suggest a possible channel or rising wedge of some kind, although the shape does not seem clear as of now.
What are your thoughts? Is this a potential diamond pattern?

Bitcoin Diamond Pattern with Bullish Convergence?Good morning ladies and gents! I have spotted a Scuffed Diamond Pattern. The measured move of this to the up and downside is about a 3.82%. It's only a matter of time until we breakout. We are approaching the apex of this pattern. It looks like a long ways away, but keep in mind, this is the 1 hour time frame. I would use the 4 hour, but you have already seen the bullish divergence that has been forming. The bullish Convergence on bitcoin is new. This usually means impending price action reversal. This has been a downtrend on the smaller time frames which means a reversal would be to the upside. A measured move of this to the upside is about $8300-$8400 area which also coincides with our wedge profit taking levels between the 50% and 61.8% retrace. A measured move of this to the downside brings you to around $7600 which would be about the bottom of the wedge formation again.
I hope you all have a wonderful rest of your day and night! Hopefully this was of help as the price action seems to be a bit slow right now.
Twitter: twitter.com
If you want to be a loving supporter of me and my "ChArtworks"
$BTC: 35tmT7MAQXZm7rr1KzZMWNRpN2iyrnSB4z
$LTC: LVfCT9fu4dYyFAo5cW5xLrzHZHWFoG85hn
$ETH: 0x390d207b9bde62f2806caddfb94809de61da50d9
$x42: XZXm43FJcZHEVNs9dh8mdfzWyY6VfmJvPc
Donations are never required but they are seriously very appreciative! Your Supportive comments and follows are just good enough too :D <3
Join the best Crypto and Technical Analysis Community in the world!
Discord: discord.gg
(Mitch Ray's Channel) Amazing community and I highly recommend checking out Mitch Ray if you haven't yet!

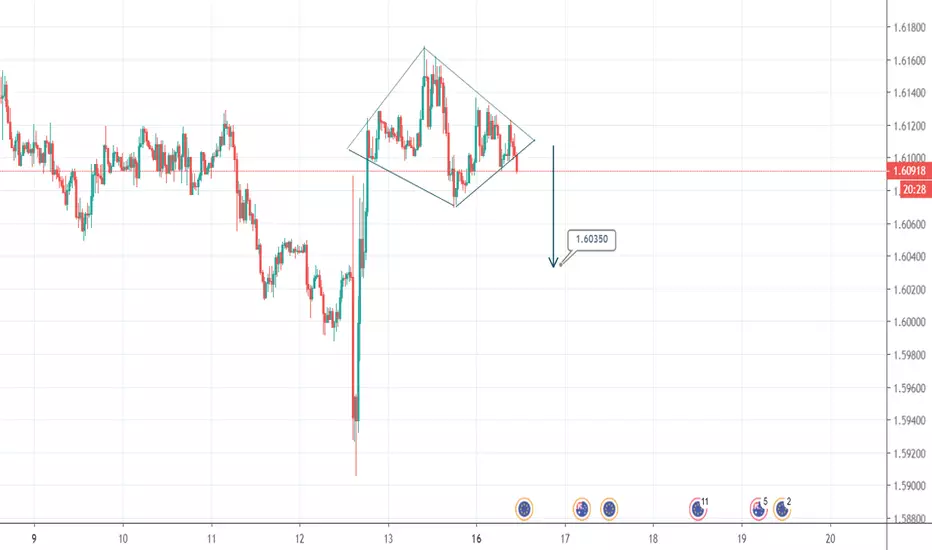
EURCADDaily: Double bottom reversal forming at the confirmed support area. Long with the breaking of the neckline
LTF: Diamond pattern forming. It might be a confirmation pullback or it is just a fakeout. Sell with the break of the support

Gold. A Hidden/Gem/Diamond, Sell~1508, SL@3 Oct '19 Hi, Tp~14301) Risk max 2% of your a/c in any trade
2) Look for min 3:1 risk/reward ratio setup e.g Sl 100 pips TP 300 pips
3) Repeat step 1) & 2)

Potential Diamond pattern-Head of a possible Head and Shoulders My current opinion (to be invalidated if there are signals that contradict my current view). On daily charts, we could probably see an ultimate outburst to the top next week before a progressive collapse (on November 2019?) of the US (and therefore worldwide) equity markets. If this happens, then we would have a perfect Diamond pattern which would be potentially the Head of a Head and Shoulders' pattern. I'd pay attention to the monthly diagonal supports, in addition to everything you know (whether it is linked to data analysis, indicators, patterns, momentum, volatility, intermarket analysis etc.).
If this, which could appear to be too good to be true for long-term short-sellers, really happens, then maybe we could see the "Trump rally" become erased(Fundamental new could be linked to raise in corporate taxes again? Punishing the FANG etc?). Borrowing could become more expensive (increasing interest rates). This would go the same for the European Quantitative Easing. We would then be back to 2014-2015, where I think every equity markets started to become a Central Bank-engineered "price bubble".
Volume could decrease towards the formation of the potential second shoulder, then spike while the neckline is being cut. The RSI could start going lower and lower until oversold territory. But this would be a positive sign for shorts.