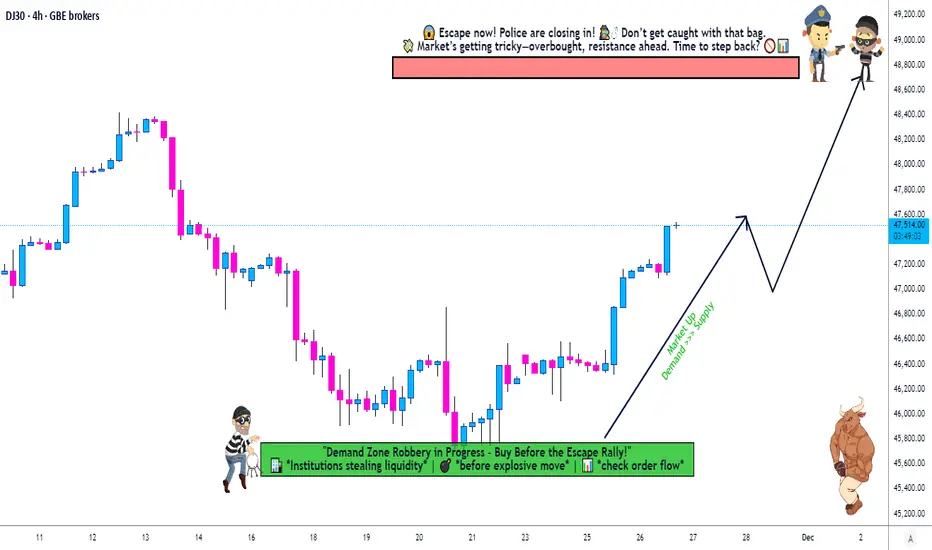
Is US30 Setting Up a Major Bullish Reversal? Layer Plan Inside🚀 US30 BULLISH SWING LAYER STRATEGY | "The Thief" Entries 🚀
BROTHERS & SISTERS OF THE MARKET! 👋 Welcome back, Thief OG's! 🦸♂️🦸♀️ A powerful Bullish setup is forming on the US30 (DOW JONES), and I'm sharing my layered entry plan to strategically position for the next leg up.
📈 Asset: US30 (Dow Jones Industrial Average)
⚡ Bias: Bullish | Style: Swing Trade
🎯 The Strategic Plan (The "Thief" Method)
This isn't a gamble; it's a calculated siege. We use a "Thief" Layering Strategy to scale into the position, reducing average entry cost and managing risk. We don't chase price; we let price come to us!
⚔️ Trade Execution Details
✅ ENTRIES (Buy Limit Layers):
We are setting multiple buy orders at key support levels. This is the core of the "Thief" method:
▶️ Layer 1: 46,400
▶️ Layer 2: 46,600
▶️ Layer 3: 46,800
▶️ Layer 4: 47,000
💡 Pro Tip: You can INCREASE or ADJUST these layers based on your capital and risk appetite.
❌ STOP LOSS (RISK MANAGEMENT):
A consolidated stop loss is placed below a major support zone to protect our capital.
➡️ SL: 46,200 (or lower based on your personal risk tolerance)
⚠️ Disclaimer (PLEASE READ): I am NOT a financial advisor. This SL is a suggestion. You MUST adjust your Stop Loss based on your own risk management strategy. Protect your capital at all costs!
🎯 PROFIT TARGET:
We are targeting a significant resistance zone where the market might see a pullback.
🎯 TP: 48,800
Rationale: This area aligns with a confluence of factors including Moving Average resistance and a potential overbought trap. The goal is to "escape with profits" before a potential reversal.
🤑 Take Note: You are free to take profits earlier! If you're in profit, you can never be wrong for taking money off the table.
🔍 Market Analysis & Key Drivers
Bullish Structure: The overall trend structure on higher timeframes remains intact.
Layered Advantage: This strategy smooths out the entry, preventing a single, potentially poor, entry point.
Risk Defined: Our maximum risk is clearly defined from the start.
🌐 Related Pairs & Correlations to Watch
Diversify your view! The US30 doesn't move in a vacuum. Keep these key assets on your watchlist:
SP:SPX (S&P 500): 🟢 High Positive Correlation. The SPX is the broader market leader. A strong SPX often pulls the DOW higher. This is your #1 confirmation.
NASDAQ:NDX (Nasdaq 100): 🟢 Positive Correlation. Tech strength can fuel overall market sentiment, but watch for divergence.
TVC:DXY (US Dollar Index): 🔴 Generally Inverse Correlation. A strengthening dollar can be a headwind for US equities. If DXY rallies sharply, be cautious.
/ES (S&P 500 Futures): 🟢 High Positive Correlation. Tracks the SPX almost tick-for-tick. Great for real-time sentiment.
✅ Conclusion
This "Thief" layered strategy provides a disciplined, low-stress approach to catching a potential US30 upswing. Remember, the market is about probabilities, not certainties.
👑 Your Capital, Your Rules. Trade Safe!
📌 Hashtags for Maximum Visibility:
#TradingView #US30 #DOW #TradingStrategy #SwingTrading #Stocks #Investing #Finance #Bullish #LayerStrategy #RiskManagement #ThiefStrategy #MarketAnalysis #SPX #DXY
👉 LIKE & FOLLOW if you found this idea helpful! Your support keeps the research coming! 💪
Djianalysis
Stocks Fall Pre-Bell as Traders Await Fed Meeting MinutesUS stock futures were mostly steady overnight Monday as Wall Street looked to regroup after a tech-led slide to begin the final stretch of 2025.
Futures tied to the Dow Jones Industrial Average futures (YM=F), the S&P 500 (ES=F), and the tech-heavy Nasdaq (NQ=F) all hovered around the flatline.
The major Wall Street indexes fell modestly Monday, as Nvidia (NVDA) and Tesla (TSLA) led megacaps lower amid a small rotation out of tech stocks. Traders are reassessing — and perhaps taking profits before the end of the year.
Tuesday brings the release of the minutes from the Federal Reserve's December meeting, at which it cut interest rates for a third straight time but signaled it may pause those cuts in the months ahead. The minutes will serve as one of the final potential market-moving catalysts of 2025, with only a reading on weekly initial jobless claims — on Wednesday morning — remaining on the calendar before the new year.
The central bank's meeting readout could add fresh insight for investors looking for clues on the Fed's next move in January, with the divisions that have gripped the central bank in 2025 likely to continue into the new year. Around 84% of bets are on the Fed standing pat at current interest rate levels next month, though traders about equally split on what the committee will do in March.
The Dow Jones (DJI) is down 0.51% moving in a bearish symmetrical triangle pattern. If the stocks keep tanking the DJI index will be approaching the $40k zone. With the RSI at 58, there are high chances that DJ:DJI might consolidate and go dipper to the $40k zone.

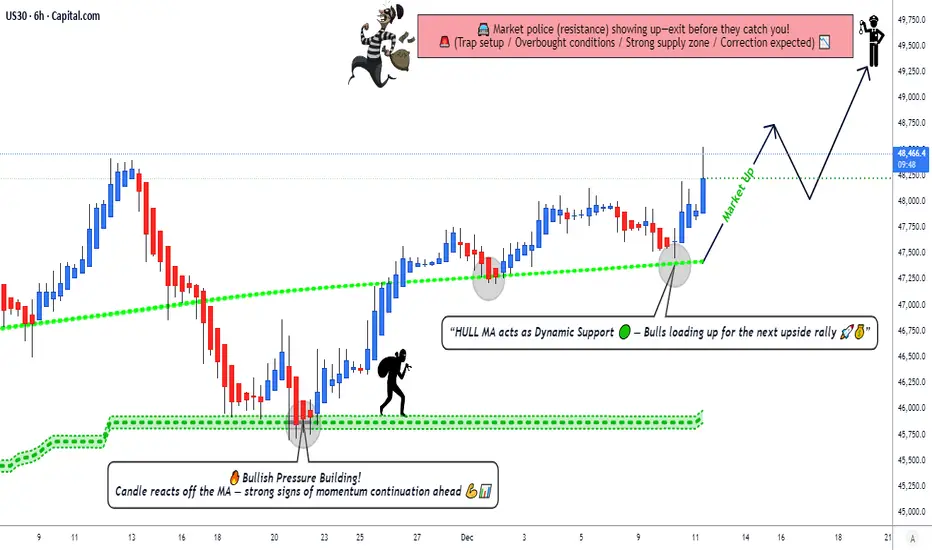
US30 Momentum Rebuild: Breakout Retest Signals Potential Upside📈 DJI30 / US30 – Dow Jones Industrial Average Trade Opportunity Guide
🏛️ Market Context
The index is showing strong accumulation pressure, with buyers stepping back in as volatility narrows. Momentum tools and trend metrics continue to lean toward the upside, creating a setup where disciplined layering becomes highly effective for precision entries.
🔥 Trade Plan – Bullish Strategy in Play
✅ Technical Confirmation
KIJUN MA accumulation indicates steady buy-side pressure building beneath price.
HULL Moving Average breakout completed with a clean pullback + retest, confirming trend continuation strength.
Market structure remains constructive with higher lows forming consistently.
🎯 Entry Plan (Layering Method Included)
Any price level can be used, but this plan uses Thief Layering Strategy for controlled scaling:
💠 Buy Limit Layers:
47,000
47,250
47,500
47,750
48,000
(Traders can add more layers depending on personal risk and capital allocation style.)
🛡️ Stop Loss (SL)
Thief SL → 46,750
Dear Ladies & Gentlemen (Thief OGs): Please adjust according to personal strategy and risk. This SL is an example, not a fixed rule. Trade with your own management principles.
🎯 Target (TP)
Main Target → 49,500
The market is approaching major moving-average resistance + overbought zones + potential trap regions. It’s wise to secure profits as the index reaches upper supply levels.
Again, Ladies & Gentlemen (Thief OGs): TP is flexible. Manage your profit bookings based on your personal approach.
🌍 Related Pairs to Watch & Correlations
1️⃣ SP:SPX / S&P 500
Often moves in high correlation with US30.
Strong bullish momentum here typically supports US30 upside.
Watch for divergence → if SPX stalls while US30 pushes, upside may weaken.
2️⃣ NASDAQ:NDX / NAS100 (Nasdaq 100)
Tracks tech sentiment, which influences overall US risk appetite.
If NAS100 shows weakness while Dow is rising, expect mixed flows → Dow may slow down but still hold structure.
3️⃣ TVC:VIX (Volatility Index)
Inverse correlation to US30.
Falling VIX = stronger risk-on behavior, supporting bullish Dow positions.
Sudden VIX spikes signal caution on existing long positions.
4️⃣ TVC:DXY (US Dollar Index)
Strong Dollar sometimes suppresses equity momentum.
If DXY drops, US30 tends to gain strength as liquidity flows to equities.
5️⃣ CBOT_MINI:YM1! (Dow Futures)
The closest real-time mirror of US30 price action.
Useful for re-entry timing during pullbacks and session gaps.
🧭 Final Notes
Stay disciplined with your own SL/TP logic, manage exposure through layered entries, and monitor correlation assets for confirmation. This is a flexible play designed for DAY & Swing traders who thrive in momentum-driven environments.
Can the Dow Jones Continue Its Bullish Momentum This Week?🚀 US30/DJI Dow Jones - Bullish Pullback Opportunity 📈
Professional Market Blueprint | Swing Trade Setup
📊 TRADE OVERVIEW
Asset: US30/DJI - Dow Jones Industrial Average Index
Timeframe: Swing Trade (4H-Daily)
Bias: 🟢 BULLISH - Hull MA Pullback Strategy
Confirmation: Heikin Ashi Reversal Candle Pattern
🎯 ENTRY STRATEGY - "LAYERING METHOD" 🎯
Approach: Multiple limit orders (Professional Risk Distribution)
Layer Entry Points:
Layer 1: 46,600 🔵
Layer 2: 46,800 🔵
Layer 3: 47,000 🔵
Layer 4: 47,200 🔵
💡 Tip: Adjust additional layers based on your risk tolerance and account size
🛑 RISK MANAGEMENT
Stop Loss: 46,400
⚠️ DISCLAIMER: This is a reference level only. You manage your own risk. Adjust SL according to your strategy and risk profile.
Take Profit Target: 48,800
📌 Rationale: Moving Average resistance + Overbought zone + Trap detection
⚠️ DISCLAIMER: This is a reference level only. You manage your own risk. Take profits at your own discretion.
📈 TECHNICAL CONFLUENCE
✅ Hull Moving Average - Bullish alignment & pullback structure
✅ Heikin Ashi Reversal - Confirmation candle pattern at entry zones
✅ Moving Average Resistance - Strong rejection level near TP
✅ Overbought Divergence - Potential trap for trap traders
✅ Risk/Reward Ratio - Favorable 1:3+ setup potential
🔗 RELATED PAIRS TO WATCH - CORRELATION ANALYSIS
📍 AMEX:SPY - S&P 500 ETF (Positive Correlation - 0.92)
US30 follows broad market sentiment. SPY strength = DJI bullish momentum.
📍 NASDAQ:QQQ - Nasdaq-100 ETF (Positive Correlation - 0.85)
Tech sector performance impacts overall market. Monitor for divergence signals.
📍 AMEX:IWM - Russell 2000 (Small Cap) (Positive Correlation - 0.88)
Small-cap rotations precede index moves. Early trend confirmation signal.
📍 AMEX:GLD - Gold Spot Price (Inverse Correlation - -0.45)
Risk-on sentiment (bullish DJI) = weaker gold. Inverse hedge setup.
📍 TVC:VIX - Volatility Index (Inverse Correlation - -0.70)
Rising VIX = market fear = DJI pullback risk. Monitor at entry zones.
📍 TVC:US10Y Yield (Negative Correlation - -0.55)
Rising yields pressure equities. Check yield strength before entries.
📍 TVC:DXY - US Dollar Index (Weak Negative - -0.30)
Stronger dollar = export headwinds. Minor impact, secondary indicator.
⚡ KEY TRADING RULES
🔴 BEFORE ENTRY:
Confirm Hull MA slope is positive
Wait for Heikin Ashi reversal candle close
Check VIX & SPY alignment
Ensure no major economic events
🟢 AT ENTRY:
Use layering strategy (don't chase)
Build position gradually across 4 layers
Scale risk based on account size
Document entry price & time
🟡 DURING TRADE:
Trail stop loss after +1% profit
Monitor related pairs for divergence
Close 50% at +2% for risk-free trade
Let remainder run to target
🔵 EXIT PLAN:
Target: 48,800 (reference level)
Or: Exit on Heikin Ashi reversal signal
Or: Close on MA resistance rejection
Never hold into major news events

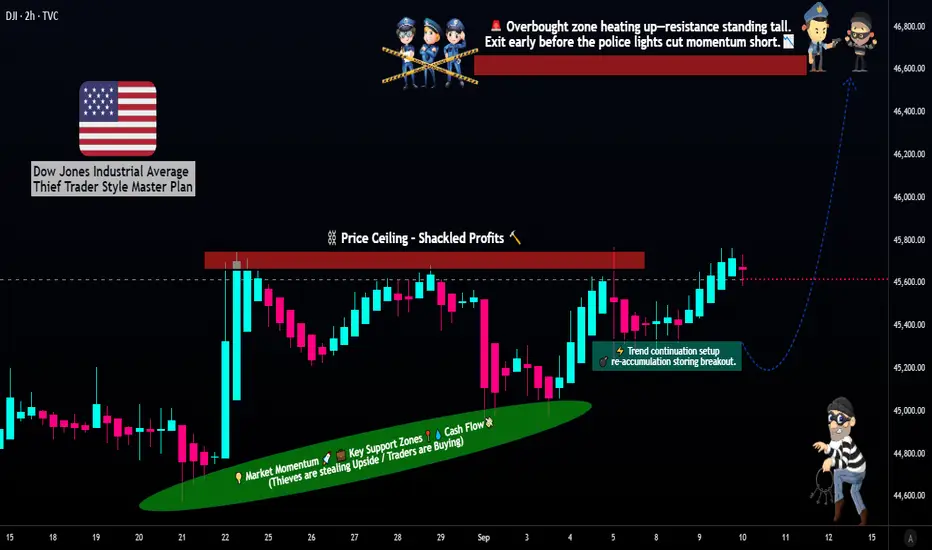
Can the DJIA Maintain Its Momentum? A Strategic Long Setup📈 DJIA Money-Making Plan: Thief Strategy (Swing/Day Trade) 🕵️♂️
🚀 Swing/Day Trade Setup for Dow Jones Industrial Average (DJIA) CFD
Join the "Thief OG" crew with this bullish plan to navigate the market with precision! Using a layered limit order strategy, this setup targets smart entries and calculated exits while keeping risk management first. Let’s dive into the plan! 💥
📊 Trade Plan Overview
Asset: Dow Jones Industrial Average (DJIA) CFD 💰
Direction: Bullish 🐂
Current Price (Sep 10, 2025): 45,711 🟢 (+0.43% from previous close)
Strategy: Thief Layered Limit Order Strategy 🕵️♂️
Place multiple buy limit orders at key levels to "steal" entries during pullbacks.
Suggested Entry Levels: $45,400, $45,500, $45,600, $45,700 (or customize based on your analysis).
Note: You can add more layers or adjust levels to suit your risk appetite. Flexibility is key! 🔧
Stop Loss (SL): $45,100 (Thief OG’s starting point).
Important: Adjust your SL based on your strategy and risk tolerance. This is a suggestion, not a rule! ⚠️
Target Price (TP): $46,600 (Escape before the "police barricade"!).
Note: Set your own TP based on your goals. Take profits at your discretion—don’t follow blindly! 💸
Risk Disclaimer: Dear Traders (Thief OG’s), this plan is a guide, not a guarantee. Always trade at your own risk and adjust SL/TP to your strategy. Protect your capital! 🛡️
🧠 Why This Plan? Thief Strategy + Market Insights
The "Thief" strategy uses layered limit orders to capitalize on pullbacks in a bullish trend, backed by solid market data. Here’s why this setup shines:
Thief Technical Strategy 🕵️♂️:
Layered Entries: Multiple buy limit orders ($45,400–$45,700) allow you to scale into the trade during dips, maximizing entry precision.
Risk Management: Suggested SL at $45,100 protects against unexpected reversals. Customize to your comfort level.
Profit Potential: Target $46,600 aligns with resistance levels and recent momentum. Exit strategically to lock in gains.
Fundamental & Macro Score: 7/10 (Solid Foundation) 🟢
Earnings Growth: Expected 7-10% for 2025, driven by strong corporate balance sheets.
Sector Strength: 10/11 S&P sectors up YTD, with tech and industrials leading.
Macro Environment:
Cooling inflation (CPI ~3.1% YoY).
Fed rate cuts expected, supporting growth.
Mild headwinds from tariffs and global trade risks.
Resilient labor market (unemployment 4.3%) and consumer spending fuel upside.
Trader Sentiment Outlook 😊:
Retail: 51% Bullish 🟢 | 34% Bearish 🔴 | 15% Neutral ⚪
Optimism driven by dip-buying in tech and industrials.
Institutional: 45% Bullish 🟢 | 40% Bearish 🔴 | 15% Neutral ⚪
Cautious positivity, focusing on corporate fundamentals amid policy uncertainties.
Overall Mood: Mildly positive, but stay alert for volatility from trade talks or inflation data.
Fear & Greed Index: 51 (Neutral) ⚖️
Balanced emotions: Not too scared, not too greedy.
Steady momentum, but watch for volatility spikes with upcoming data (e.g., inflation reports).
Market Outlook: Bullish 🚀
Bullish trend intact with no recession signals.
Expect modest single-digit % gains, led by earnings.
Stay cautious of pullbacks from policy news, but avoid shorting for now.
🔗 Related Pairs to Watch (in USD)
S&P 500 CFD ( SP:SPX ): Tracks broader market trends, often moves in tandem with DJIA.
NASDAQ 100 CFD ( NASDAQ:NDX ): Tech-heavy index, great for confirming bullish momentum.
FX:USDJPY : Currency pair sensitive to U.S. economic data and Fed policy.
OANDA:XAUUSD (Gold): Safe-haven asset; monitor for risk-off moves if sentiment shifts.
📝 Final Notes
This DJIA setup combines the tactical "Thief" layered entry strategy with robust market data to guide your trades. Stay disciplined, manage risk, and adapt the plan to your style. Let’s make smart moves together! 💪
✨ “If you find value in my analysis, a 👍 and 🚀 boost is much appreciated — it helps me share more setups with the community!”
#TradingView #DJIA #SwingTrading #DayTrading #ThiefStrategy #Bullish #TechnicalAnalysis #MarketAnalysis
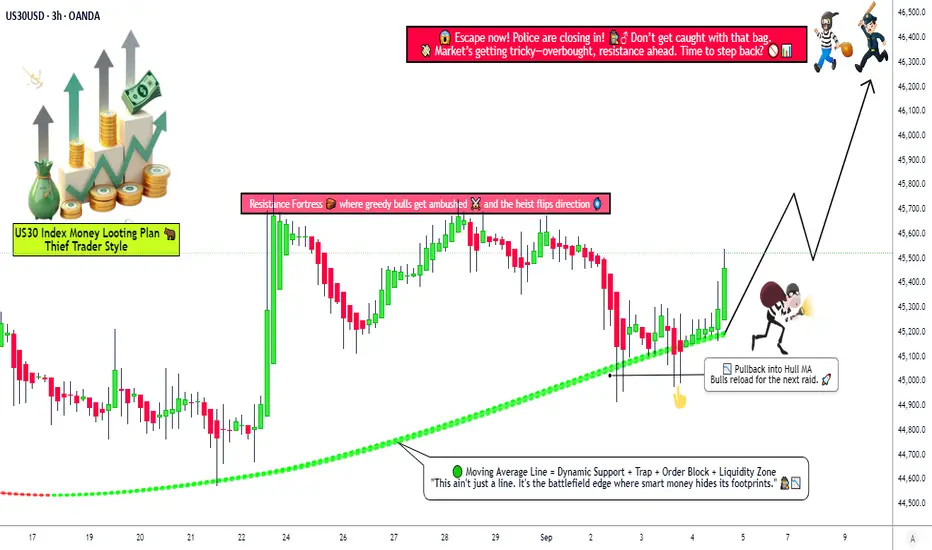
Dow Jones Bullish Strategy! Can the Market Break Higher?🚀 US30 Index Money-Making Plan (Swing / Day Trade) 📊
🧠 Trading Plan & Strategy (Thief Layer Style)
🚀 Approach: Bullish Hull Moving Average pullback plan — “bulls reloaded” for the next wave.
🎯 Entry (Layering Strategy): Multiple buy-limit layers → 45,200 • 45,300 • 45,400 • 45,500 (flexible to add more based on your own plan).
🛡️ Stop Loss: Reference point at 45,000. Adjust SL responsibly to match your personal risk tolerance & style.
💰 Target: Potential resistance zone (the “police barricade”) sits near 46,300. That’s where traders may consider taking profits.
📢 Note: This is an illustrative plan based on technicals — every trader should adapt TP/SL to their own strategy and risk appetite.
📊 US30 Market Report – September 4, 2025
📈 Current Price Snapshot
Trading near 45,000 points, up 0.05% today.
Strong monthly performance (+2.4%) and robust yearly gains (+17%).
Market showing resilience despite trade tensions.
😊 Retail Traders’ Sentiment
60% long vs 40% short → Tilted bullish.
Optimism driven by hopes for earnings growth & Fed rate cuts.
Caution remains due to tariff risks.
🏦 Institutional Traders’ Outlook
Cautiously bullish positioning.
Demand for equities continues, but with moderated exposure.
Buybacks + foreign inflows supporting price action.
🌡️ Overall Investor Mood
Neutral to positive tone.
Economic resilience balanced against policy uncertainty.
Healthy breadth across sectors, not just tech.
😨 Fear & Greed Index
Currently at 52 (Neutral).
Suggests balance — no extremes dominating.
Neutral setups often precede steady gains.
💹 Fundamental Score → 8/10
Strong corporate earnings (+12–13% growth projected next year).
Balance sheets remain solid.
AI & tech themes boosting key components.
Tariffs still a drag, but diversified exposure helps.
🌍 Macro Score → 7/10
US GDP growth cooling to 1.5%, but global rebound supports outlook.
Inflation ~2.9%; Fed rate cuts expected later.
Labor market stable, policy clarity could add upside.
🐂 Overall Market Outlook: Bullish Bias 📈
If support at 45,000 holds, potential move higher toward 46,000+.
Drivers: Strong earnings, Fed easing, broad rally.
Watch: Trade news headlines remain a key risk factor.
🔎 Why This Plan?
Hull MA pullback indicates momentum continuation.
Layered entries provide flexibility & better risk distribution.
Market sentiment + fundamentals align with bullish bias.
Resistance at 46,300 offers a clear take-profit zone.
📌 Related Pairs to Watch
CAPITALCOM:US30
FOREXCOM:SPX500
EIGHTCAP:NDQ100
TVC:VIX
TVC:DXY
✨ “If you find value in my analysis, a 👍 and 🚀 boost is much appreciated — it helps me share more setups with the community!”
#US30 #DowJones #Indices #SwingTrading #DayTrading #TechnicalAnalysis #StockMarket #TradingPlan #HullMA #LayeringStrategy
DJI Looking BullishDJ:DJI made a inverted head and shoulder. Looks like it may achieve a target of 53000.
But for that it has to sustain above 45100. Else this level will work as resistance.
Lets wait and watch what happens. If this pattern fails or we will new high for DJI.
Thanks
This post is just my perception and for study purpose only.
I will not be held responsible for loss in the stock market.

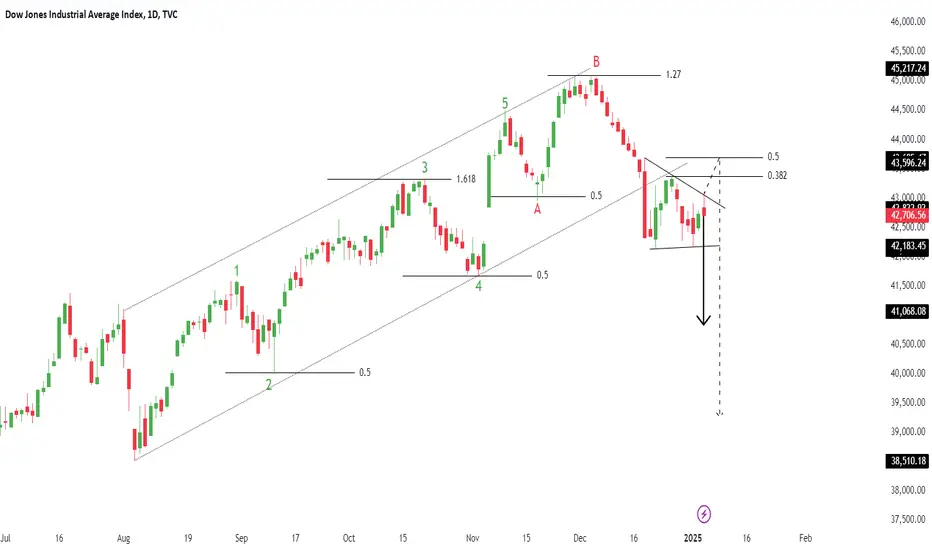
Anticipating DJIOn the daily timeframe, the current position of the Dow Jones Industrial Average (DJI) is projected to follow one of three possible scenarios:
Scenario 1 (Black Label):
DJI is currently in the process of forming Wave iv of Wave , implying that any short-term rebound is likely to be limited. The index may test the resistance area between 43,953–44,142, but remains vulnerable to further downside correction thereafter.
Scenario 2 (Red Label):
In this scenario, Wave 4 is considered complete, allowing DJI to resume its upward momentum. A breakout would signal the start of Wave 5, targeting the 45,324–46,465 range for a potential new higher high.
Scenario 3 (Blue Label):
Here, DJI is assumed to be in the midst of Wave 4 of Wave (5). A corrective move is expected first, potentially revisiting the support zone around 42,262–43,028, before continuing its bullish trend to form a new higher high.

Dow Jones -> A breakout rally of +40%!🐂Dow Jones ( TVC:DJI ) will create new highs:
🔎Analysis summary:
Since the April lows, the Dow Jones already rallied about +25%. This was simply the expected rejection away from a strong confluence of support. Now, the Dow Jones is sitting at the previous all time highs and about to break out, leading to a massive rally.
📝Levels to watch:
$45.000, $60.000
🙏🏻#LONGTERMVISION
Philip - Swing Trader

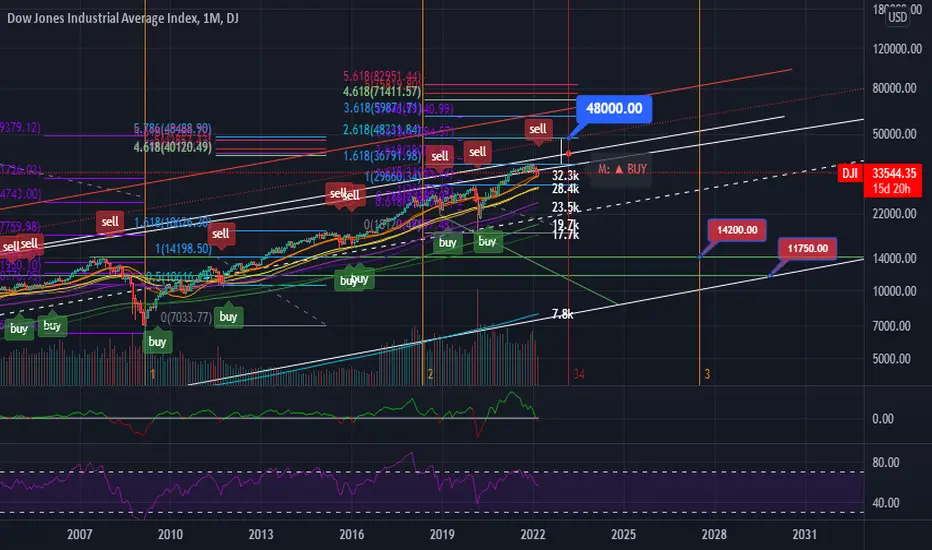
Dow Jones (DJI) Logarithmic Macro Outlook Log target: 48k
The dotted red line is adjusted for inflation. The stock market cycles are lengthening. Continued downside till EOM followed by a final melt-up rally that will bring the end of grand wave 5.
ETA: Q1 '23.
DJI SELLING BIAShello guys,
this is how i gonna act. upcoming months we can see downside in dow jones.
please keep in mind that trading is a risky so act wisely!

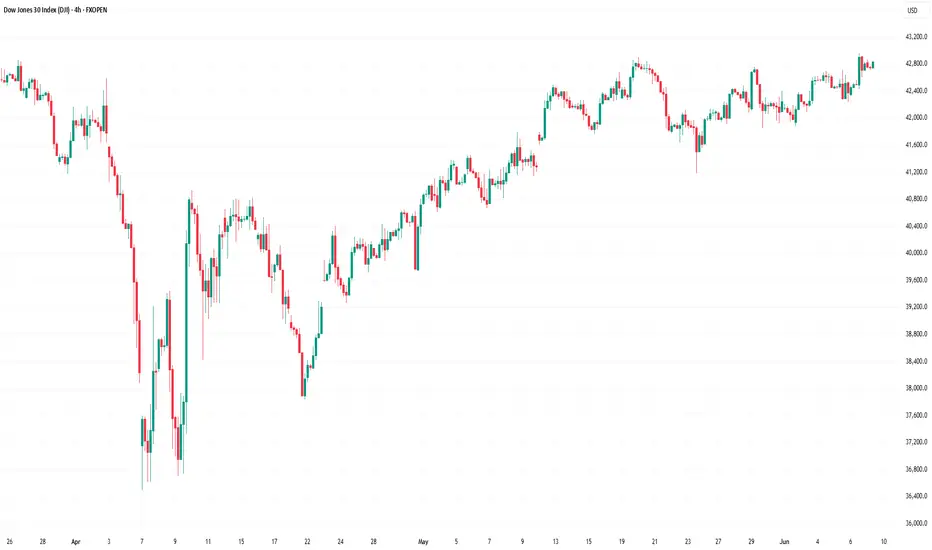
Dow Jones Index Rises Towards Key ResistanceDow Jones Index Rises Towards Key Resistance
On Friday, the Dow Jones Industrial Average (Wall Street 30 mini on FXOpen) climbed above the 42,950 level — a high not seen since early March.
The index has gained around 1.6% since the beginning of June.
Why Is the Dow Jones Rising?
→ Friday’s US jobs report helped ease concerns about the country’s economic outlook. According to ForexFactory, Non-Farm Employment Change came in at +139K, beating the forecast of +126K.
→ On Thursday, Donald Trump and Chinese President Xi Jinping held a call, easing tariff tensions. Market participants also welcomed news that officials may hold trade negotiations in London on 9 June.
Could the DJIA (Wall Street 30 mini on FXOpen) Rally Continue?
Technical Analysis of the Dow Jones Chart
The chart suggests that the 42,950 level is acting as a significant resistance. The price has repeatedly reversed from the 42,660–42,950 area (as shown by the arrows).
At the same time:
→ Friday’s move above 42,950 triggered selling pressure, forming a candlestick with a long upper shadow;
→ This may have been a false bullish breakout of the May high;
→ The price remains within an ascending channel (shown in blue), but the bounces off the lower boundary appear weak.
Given this setup, it is reasonable to assume that intensified bearish activity near 42,950 on the USA30 could lead to a breakout below the channel’s lower boundary.
Additional pressure on the Dow Jones Industrial Average (Wall Street 30 mini on FXOpen) may come from developments in California, where protests have erupted against immigrant deportations, with President Donald Trump and Governor Gavin Newsom trading accusations.
This article represents the opinion of the Companies operating under the FXOpen brand only. It is not to be construed as an offer, solicitation, or recommendation with respect to products and services provided by the Companies operating under the FXOpen brand, nor is it to be considered financial advice.
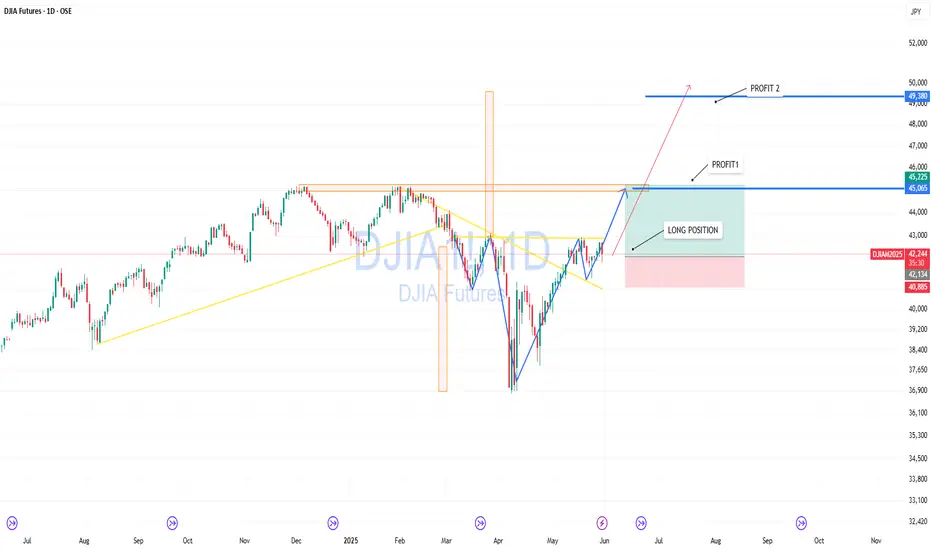
DJIA — Setting Up for Breakout and New ImpulseThe Dow Jones Index is approaching a critical resistance zone. After a deep V-shaped recovery and clear bullish structure, price is preparing for a breakout.
Chart shows a clean long entry with a stop below the recent consolidation. A break and hold above 45,000 could lead to a move toward 46,000, and if momentum holds — up to 49,300.
Partial profit-taking levels:
— Target 1: 45,225
— Target 2: 49,380
Fundamentally, US equity markets remain strong, and DJIA may play catch-up after lagging during the last correction.
"US30/DJI30" Index CFD Market Heist Plan (Scalping/Day Trade)🌟Hi! Hola! Ola! Bonjour! Hallo! Marhaba!🌟
Dear Money Makers & Robbers, 🤑 💰💸✈️
Based on 🔥Thief Trading style technical and fundamental analysis🔥, here is our master plan to heist the "US30/DJI30" Index CFD Market. Please adhere to the strategy I've outlined in the chart, which emphasizes long entry. Our aim is to escape near the high-risk MA Zone. Risky level, overbought market, consolidation, trend reversal, trap at the level where traders and bearish robbers are stronger. 🏆💸"Take profit and treat yourself, traders. You deserve it!💪🏆🎉
Entry 📈 : "The heist is on! Wait for the MA breakout (40800) then make your move - Bullish profits await!"
however I advise to Place Buy stop orders above the Moving average (or) Place buy limit orders within a 15 or 30 minute timeframe most recent or swing, low or high level for Pullback entries.
📌I strongly advise you to set an "alert (Alarm)" on your chart so you can see when the breakout entry occurs.
Stop Loss 🛑: "🔊 Yo, listen up! 🗣️ If you're lookin' to get in on a buy stop order, don't even think about settin' that stop loss till after the breakout 🚀. You feel me? Now, if you're smart, you'll place that stop loss where I told you to 📍, but if you're a rebel, you can put it wherever you like 🤪 - just don't say I didn't warn you ⚠️. You're playin' with fire 🔥, and it's your risk, not mine 👊."
📍 Thief SL placed at the recent/swing low level Using the 1H timeframe (39200) Day trade basis.
📍 SL is based on your risk of the trade, lot size and how many multiple orders you have to take.
🏴☠️Target 🎯: 42700 (or) Escape Before the Target
🧲Scalpers, take note 👀 : only scalp on the Long side. If you have a lot of money, you can go straight away; if not, you can join swing traders and carry out the robbery plan. Use trailing SL to safeguard your money 💰.
💰💵💴💸"US30/DJI30" Index CFD Market Heist Plan (Day / Scalping Trade) is currently experiencing a bullishness🐂.., driven by several key factors.👇👇👇
📰🗞️Get & Read the Fundamental, Macro, COT Report, Quantitative Analysis, Sentimental Outlook, Intermarket Analysis, Future trend targets... go ahead to check 👉👉👉🔗🔗
⚠️Trading Alert : News Releases and Position Management 📰 🗞️ 🚫🚏
As a reminder, news releases can have a significant impact on market prices and volatility. To minimize potential losses and protect your running positions,
we recommend the following:
Avoid taking new trades during news releases
Use trailing stop-loss orders to protect your running positions and lock in profits
💖Supporting our robbery plan 💥Hit the Boost Button💥 will enable us to effortlessly make and steal money 💰💵. Boost the strength of our robbery team. Every day in this market make money with ease by using the Thief Trading Style.🏆💪🤝❤️🎉🚀
I'll see you soon with another heist plan, so stay tuned 🤑🐱👤🤗🤩

Warning Signs Flashing: Dow Jones Breaks Key SupportThe Dow Jones Index has officially broken its rising trendline support, signaling a possible shift in the medium-term trend. After losing this key ascending structure, price is now hovering near the psychological support zone of 40,000, which has historically acted as both resistance and support.
This level is crucial. If it holds, we could see a temporary bounce or consolidation. However, if the 40K zone fails to provide support, the index may head toward the next major support area around 38,000, aligned with the longer-term trendline support.
Do like and follow us
THANK YOU

Dow Jones Testing Key Support – Bounce or Crash Ahead?The Dow Jones Industrial Average (DJIA) is currently testing a key rising trendline support, which has been a strong foundation for its uptrend since 2023. Holding this level could signal a continuation of the bullish momentum, while a breakdown may lead to a deeper correction. If the price fails to hold above this trendline, the next significant support lies around 41,000-40,000, a zone that previously acted as resistance and is now a psychological support level. In case of further weakness, the long-term trendline support around 38,000-39,000 could come into play, aligning with the Ichimoku cloud support.
For the bullish scenario to remain valid, DJIA needs to sustain above the rising trendline and reclaim recent highs. However, if sellers gain control and push prices lower, a broader pullback could unfold. Overall, the market remains in an uptrend as long as key support levels hold, but price action in the coming weeks will determine whether the index continues upward or undergoes a deeper correction.
Do like, comment and follow

It's over for DOW JONES?#dowjones #DJI index has been forming a bearish double top and the first hard declination from this levels will probably confirm the trend reversal of DJ:DJI .Take care.

DJI ( US30 )The Dow Jones Industrial Average breaking above a resistance zone near 44,900 - 44,950, marked by arrows indicating previous rejection points. A successful breakout suggests bullish momentum with potential for further upside towards the marked target area.

DJIA Breakout Incoming? Bulls Eye 48,000+Dow Jones Industrial Average (DJIA) Analysis – Bullish Continuation?
The DJIA remains in a strong uptrend, respecting the rising channel structure.
Recent price action shows a successful retest of key Fibonacci support, followed by a bullish bounce, signaling a potential continuation toward new highs.

DJI - 1590 Points and Running!This is a long trade setup on the Dow Jones Industrial Average (DJI) on the 15-minute timeframe. The trade was initiated on January 14th, 2025, and has shown a significant upward move since then. As of today, the position is currently sitting at a substantial profit of 1590 points.
Trade Confirmation Rules:
The Risological Dotted Trend Line turned green, indicating a bullish trend or a change in trend direction.
The Risological Options Trading Indicator turned green with a bullish crossover, suggesting favorable conditions for long options positions.

DJI - ACCURATE TREND CAUGHTDow Jones Industrial (DJI) Accurate Trend Caught Using Risological Options Trading Indicator .
After a one sided 1100 points (SHORT side)
We are now seeing a Bullish reversal in the market, with 350+ points open P&L so far, and running.
The past two weeks have been painful for many traders and investors worldwide.
Share your personal experiences below.
All the best.

DJI Short Trade Nets $2100 Dip: A 4.7% Market Move!Dow Jones Industrial (DJI): $2100 Drop Captured
On December 11, 2024, the Risological Options Trading Indicator provided a clear signal to initiate a short trade on the Dow Jones Industrial (DJI). This trade capitalized on a significant bearish move, capturing an impressive $2100 dip, equating to a massive 4.7% decline from the entry point.
The trade was identified using the Risological Options Trading Indicator, which accurately captured the strong bearish momentum. The red overlay in the histogram confirms increasing selling pressure, coinciding with the downward trajectory.
This setup highlights how the Risological Options Trading Indicator leverages market structure to pinpoint high-probability trades. The captured $2100 move reinforces its precision in navigating even the most volatile markets.
All the best!
Namaste.

DJIDJI - Dow Jones Index
Break of Structure
Symmetrical Triangle as an Corrective Pattern in Short Time Frame
Demand Zone
Fibonacci Level - 38.20% / 50.00%
Completed " 12345 " Impulsive Waves and " AB " Corrective Waves