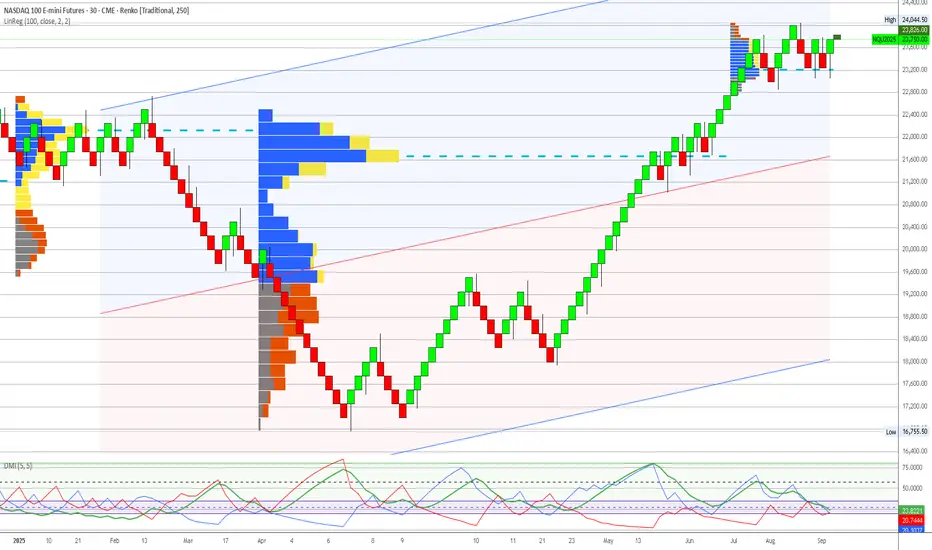
Nasdaq 100 (NQ) - Technical Analysis Report - 20250908Analysis Date: September 8, 2025
Current Price: 23,671
Market Session: Post-Market Analysis
---
Executive Summary
Nasdaq 100 presents a moderately extended equity position requiring defensive management, but with meaningful institutional support structure revealed through 3-quarter volume profile analysis. While trading above recent institutional accumulation, the presence of multiple quarterly POCs creates a more robust support framework than initially assessed. This positioning requires cautious defensive strategies rather than emergency liquidation, with clear institutional reference levels for risk management.
---
Quarterly Volume Profile Analysis
3-Quarter Institutional Positioning Intelligence
The 3-quarter volume profile (Q1-Q3 2025) reveals a complex but supportive institutional positioning pattern across multiple price ranges:
Multi-Quarter Institutional Activity Zones:
Q1 2025: Heavy blue institutional accumulation at 21,800-22,200 range
Q2 2025: Substantial blue volume during correction at 19,800-20,500 range
Q3 2025: Fresh institutional activity developing at 22,000-22,400 levels
Current price (23,671) moderately extended above most recent institutional positioning
Comprehensive Support Structure:
Primary Support: 22,000-22,400 (Q1/Q3 institutional convergence zone)
Secondary Support: 20,200-20,500 (Q2 correction accumulation)
Extended Support: 19,500-20,000 (historical institutional floor)
Current Extension: 6-8% above primary institutional zones (manageable vs. catastrophic)
Institutional Pattern Analysis:
21,800-22,200: Q1 original institutional positioning validates current levels
19,800-20,500: Q2 correction buying shows institutional conviction during weakness
22,000-22,400: Q3 re-engagement demonstrates continued institutional participation
Above 23,000: Moderate extension requiring defensive positioning
Price Structure Context
Historical Pattern Recognition:
The 3-quarter analysis reveals continuous institutional engagement rather than abandonment, indicating healthy market structure with multiple layers of smart money support. This pattern suggests institutional rotation and repositioning rather than wholesale exit from technology exposure.
Revised Risk Assessment:
Moderate Extension: 6-8% above institutional levels vs. previously assessed 18%+
Multiple Support Layers: Three quarterly POCs provide robust institutional framework
Institutional Continuity: Ongoing smart money participation throughout 2025
Risk Definition: Clear institutional boundaries at multiple levels for defensive management
Sector Composition and Market Leadership
Technology Sector Positioning:
Artificial intelligence leadership driving institutional reallocation
Mega-cap concentration providing stability and institutional interest
Innovation premium supporting elevated valuation multiples
Defensive technology characteristics during uncertain economic cycles
---
Execution Chart Technical Analysis
Current Technical Configuration - MIXED SIGNALS
DEMA Analysis - MOMENTUM CONCERNS:
Black Line (Fast DEMA 12): Currently at 23,671
Orange Line (Slow DEMA 20): Currently at 23,597
Configuration: Bullish but showing momentum deceleration
Trend Bias: Technical momentum weakening despite continued bullish bias
DMI/ADX Assessment - TREND MATURITY:
ADX Level: Declining from previous highs, indicating mature trend phase
+DI vs -DI: +DI maintaining slight edge but margin narrowing
Momentum Direction: Signs of trend maturation after extended advance
Trend Strength: Weakening ADX suggests institutional repositioning phase
Stochastic Analysis - OVERBOUGHT BUT NOT EXTREME:
Tactical Stochastic (5,3,3): Overbought with some negative divergence
Strategic Stochastic (50,3,3): Extended levels but within historical norms
Divergence Analysis: Moderate negative divergences suggesting consolidation need
Support and Resistance Levels
Critical Technical Levels:
Current Resistance: 24,000 (psychological and technical barrier)
Immediate Support: 23,400 (DEMA cluster support)
Key Support: 22,800 (recent consolidation boundary)
Major Support: 22,200 (Q1/Q3 institutional convergence)
Critical Support: 20,500 (Q2 institutional accumulation)
Ultimate Support: 19,500-20,000 (historical institutional floor)
---
Trading Scenarios and Setup Criteria
Scenario 1: Defensive Profit-Taking Setup (PRIMARY)
Recommended Position Management:
Systematic reduction of existing positions by 50-75%
Profit-taking priority given moderate extension above institutional levels
Maintain small tactical exposure with tight risk management
Capital reallocation to higher-conviction institutional accumulation opportunities
Profit-Taking Protocol:
Primary Action: Reduce positions by 50-75% at current levels
Secondary Reduction: Complete exit on failure to hold 22,500 support
Stop Management: Trail stops using 22,200 institutional support
Cash Allocation: Redirect capital to commodity opportunities with stronger institutional backing
Scenario 2: Tactical Range Trading (SECONDARY)
Range-Bound Management:
Defined range: 22,200-23,800 (institutional support to resistance)
Small position tactical trading within institutional boundaries
Quick profit-taking on bounces toward 23,500-23,800
Defensive positioning on approaches to 22,200 support
Range Parameters:
Long Zone: 22,200-22,500 (institutional support approach)
Short Zone: 23,600-23,800 (resistance approach)
Stop Distance: 400-600 points maximum
Position Size: Reduced allocation (1% account risk maximum)
Scenario 3: Breakdown Management (DEFENSIVE)
Support Violation Protocol:
Break below 22,200 requires immediate position liquidation
Institutional support violation indicates potential deeper correction
Target return to 20,200-20,500 Q2 institutional accumulation
Complete avoidance until clear institutional re-engagement
Breakdown Parameters:
Critical Level: 22,200 (institutional support)
Action Required: Immediate exit of all positions
Targets: 20,500, 20,000, 19,500 (institutional accumulation zones)
Re-entry Criteria: New institutional accumulation evidence required
---
Risk Management Protocols
Position Sizing Guidelines
Defensive Approach (Recommended):
Maximum Risk: 1.5% of account (reduced from standard due to extension)
Contract Calculation: Account Size × 0.015 ÷ (Stop Distance × $5)
Example: $100,000 account with 500-point stop = 40 contracts maximum
Rationale: Extended positioning requires conservative allocation
Stop Loss Hierarchy
Tactical Stop: 23,200 (execution chart support cluster)
Strategic Stop: 22,200 (institutional support boundary)
Emergency Stop: 20,500 (Q2 institutional accumulation violation)
Portfolio Management Framework
Defensive Positioning Strategy:
Current Holdings: Reduce exposure by 50-75%
New Positions: Limited tactical exposure only
Capital Reallocation: Redirect to institutional accumulation opportunities (NG, CL, 6E)
Monitoring Frequency: Daily assessment of institutional level respect
---
Market Context and External Factors
Technology Sector Fundamental Assessment
Supporting Factors:
Artificial intelligence revolution driving institutional reallocation
Productivity gains supporting elevated valuation multiples
Defensive growth characteristics during economic uncertainty
Innovation leadership providing competitive advantages
Risk Factors:
Interest rate sensitivity affecting growth stock premiums
Regulatory scrutiny on mega-cap technology companies
Valuation concerns at current extension levels
Economic cycle sensitivity for discretionary technology spending
Institutional Investment Trends
Smart Money Positioning:
Continued institutional engagement evidenced by Q3 volume activity
Rotation within technology rather than wholesale sector exit
Quality focus on mega-cap names with defensive characteristics
AI theme driving strategic institutional reallocation
---
Monitoring Checklist and Alert Levels
Daily Monitoring Requirements
Institutional Respect: Monitor behavior at 22,200 support boundary
DEMA Configuration: Watch for momentum deterioration or bearish crossover
Volume Analysis: Track institutional activity at current levels
Sector Rotation: Monitor technology vs defensive sector performance
Policy Impact: Federal Reserve decisions affecting growth stock valuations
Critical Alert Levels
Risk Escalation Alerts:
Break below 22,200 institutional support with volume
DEMA bearish crossover below 23,400
ADX declining below 20 with -DI gaining dominance
Technology sector rotation accelerating toward defensives
Defensive Action Triggers:
Multiple failures to break above 24,000 resistance
Volume decline on any rally attempts above 23,500
Institutional selling evidence (yellow volume) at current levels
Federal Reserve policy shifts affecting interest rate outlook
---
Strategic Outlook and Risk Assessment
Risk/Reward Analysis
Moderate Risk Profile:
Upside Potential: Limited 500-1,000 points to major resistance
Downside Risk: 1,500-3,000 points to institutional accumulation zones
Risk/Reward Ratio: Unfavorable 1:2+ downside bias
Probability Assessment: Moderate (35%) for further upside, High (65%) for correction
Portfolio Allocation Recommendation
Defensive Management Required
Nasdaq 100 requires defensive positioning due to moderate extension above institutional levels, but the presence of multiple quarterly POCs provides meaningful support structure. While not emergency territory, the asymmetric risk profile favors systematic profit-taking and capital reallocation to higher-conviction opportunities with stronger institutional backing. The 3-quarter analysis reveals ongoing institutional engagement, allowing for tactical exposure with proper risk management.
Allocation Framework:
Current Portfolio Weight: Reduce to 8-12% maximum (from higher previous levels)
Entry Method: Limited tactical positions only until institutional re-accumulation
Hold Period: Short-term tactical only, systematic profit-taking
Exit Strategy: Defensive reduction with 22,200 as critical support
---
Conclusion and Strategic Assessment
Nasdaq 100 analysis demonstrates the importance of comprehensive timeframe evaluation in institutional intelligence assessment. The 3-quarter volume profile reveals a more nuanced risk picture than initially assessed, showing continued institutional engagement across multiple price levels. While defensive positioning remains appropriate due to moderate extension, the presence of multiple institutional support layers allows for tactical exposure rather than complete avoidance. Current conditions warrant systematic profit-taking with clear institutional boundaries for risk management.
Strategic Priority: Defensive positioning with systematic profit-taking while respecting institutional support levels at 22,200 and 20,500 as critical risk management boundaries.
Next Review: Daily monitoring of institutional level respect and momentum indicators
Position Management: Systematic reduction with defensive stops at institutional boundaries
---
Important Disclaimer
Risk Warning and Educational Purpose Statement
This analysis is provided for educational and informational purposes only and does not constitute financial advice, investment recommendations, or trading signals. All trading and investment decisions are solely the responsibility of the individual trader or investor.
Key Risk Considerations:
Futures trading involves substantial risk of loss and is not suitable for all investors
Past performance does not guarantee future results
Market conditions can change rapidly, invalidating any analysis
Leverage can amplify both profits and losses significantly
Individual financial circumstances and risk tolerance vary greatly
Professional Guidance: Before making any trading decisions, consult with qualified financial advisors, conduct your own research, and ensure you fully understand the risks involved. Only trade with capital you can afford to lose.
Methodology Limitations: Volume profile analysis and technical indicators are tools for market assessment but are not infallible predictors of future price movement. Market dynamics include numerous variables that cannot be fully captured in any single analytical framework.
The views and analysis presented represent one interpretation of market data and should be considered alongside other forms of analysis and individual judgment.
DMI
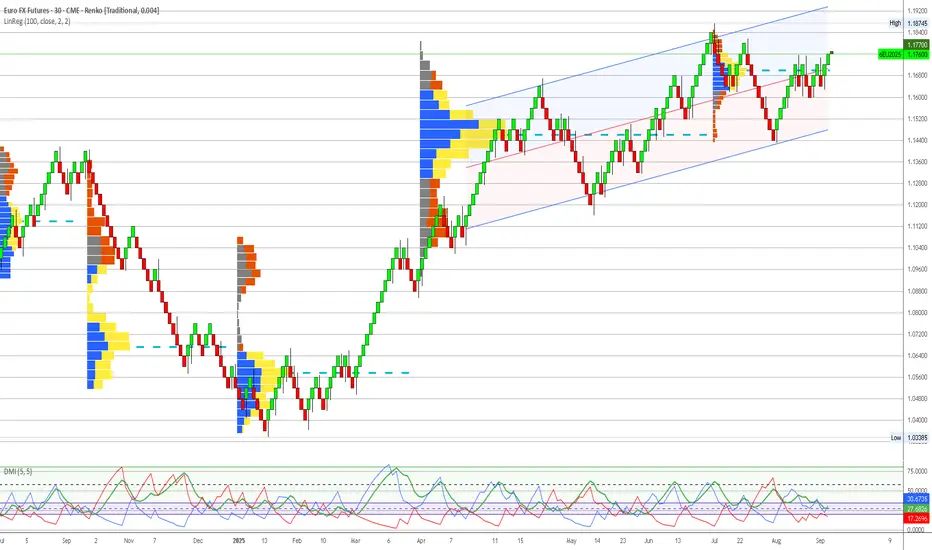
Euro Futures (6E) - Technical Analysis Report - 20250908Analysis Date: September 8, 2025
Current Price: 1.1742
Market Session: Post-Market Analysis
---
Executive Summary
Euro Futures presents the strongest technical setup among analyzed markets, with exceptional execution chart alignment despite moderate institutional positioning. The currency pair has emerged from a major bottoming pattern with validated bullish momentum signals across all timeframes. While institutional accumulation is less pronounced than in commodity markets, the technical breakout quality and central bank policy divergence create compelling risk/reward opportunities.
---
Quarterly Volume Profile Analysis
Institutional Positioning Intelligence
The quarterly volume profile (Q3 2025) reveals moderate but strategically positioned institutional activity in the Euro:
Primary Institutional Activity Zone: 1.1550-1.1700
Moderate blue volume concentration representing institutional positioning during major low formation
Current price (1.1742) trades at upper boundary of institutional accumulation zone
Volume profile shows classic bottoming pattern with accumulation at major support levels
Institutional activity concentrated around key technical support levels from previous cycles
Volume Profile Architecture:
Core Accumulation: 1.1580-1.1650 (primary institutional positioning)
Extended Support: 1.1450-1.1550 (secondary institutional interest)
Breakout Level: 1.1700-1.1750 (current resistance/breakout zone)
Void Zone: Above 1.1800 (minimal resistance, potential acceleration territory)
Resistance Structure Analysis:
1.1750-1.1800: Initial resistance with mixed volume activity
1.1850-1.1900: Moderate yellow volume indicating previous distribution
1.1950+: Historical distribution zones from earlier 2025 highs
Price Structure Context
Historical Pattern Recognition:
The current Euro setup displays textbook currency reversal characteristics following a major multi-month decline. The institutional accumulation at 1.1550-1.1700 represents strategic positioning by smart money during the formation of a significant low, typical of major currency cycle turning points.
Critical Structure Validation:
Institutional Floor: 1.1450 represents absolute lower boundary of smart money positioning
Volume Point of Control: 1.1620 shows peak institutional activity within accumulation zone
Breakout Validation: Current price above institutional accumulation confirms technical breakout
Risk Definition: Clear institutional boundaries provide precise risk management parameters
Central Bank Policy Context
Policy Divergence Supporting Euro Strength:
European Central Bank maintaining restrictive policy stance
Federal Reserve approaching policy pivot with potential dovish shift
Interest rate differential dynamics favoring Euro in medium term
Quantitative tightening policies supporting European currency fundamentals
---
Execution Chart Technical Analysis
Current Technical Configuration - EXCEPTIONAL BULLISH ALIGNMENT
DEMA Analysis - STRONGEST BULLISH SIGNAL IN ANALYZED MARKETS:
Black Line (Fast DEMA 12): Currently at 1.1742
Orange Line (Slow DEMA 20): Currently at 1.1712
Configuration: Perfect bullish crossover with expanding gap
Trend Bias: Strongest technical momentum across all analyzed markets
DMI/ADX Assessment - CONFIRMED TRENDING CONDITIONS:
ADX Level: 35+ indicating strong directional movement
+DI vs -DI: +DI clearly dominant over -DI with expanding spread
Momentum Direction: Confirming sustained bullish bias with conviction
Trend Strength: ADX rising confirms institutional and technical alignment
Stochastic Analysis - HEALTHY MOMENTUM STRUCTURE:
Tactical Stochastic (5,3,3): Bullish configuration with room for extension
Strategic Stochastic (50,3,3): Confirming longer-term bullish momentum shift
Divergence Analysis: No negative divergences, clean momentum structure throughout
Support and Resistance Levels
Immediate Technical Levels:
Current Support: 1.1710 (DEMA 20 orange line)
Key Support: 1.1680 (recent breakout consolidation)
Major Support: 1.1620 (institutional accumulation core)
Immediate Resistance: 1.1780 (near-term extension target)
Key Resistance: 1.1820 (major resistance zone)
Major Resistance: 1.1900 (significant distribution zone)
---
Trading Scenarios and Setup Criteria
Scenario 1: Continuation Long Setup (PRIMARY)
Optimal Conditions for Long Entry:
DEMA bullish maintenance: Black line remaining above orange line with gap expansion
DMI confirmation: +DI sustaining dominance over -DI with strengthening ADX
Breakout validation: Price holding above 1.1700 breakout level
Volume confirmation: Increased volume supporting upward momentum
Policy support: Central bank divergence maintaining fundamental backdrop
Entry Protocol:
Primary Entry: Current levels 1.1740-1.1760 (validated breakout zone)
Secondary Entry: 1.1710-1.1720 on any pullback to DEMA support
Position Sizing: Aggressive 2.5% account risk given exceptional technical setup
Stop Loss: Below 1.1680 (breakout failure)
Profit Targets:
Target 1: 1.1820 (first major resistance) - Take 40% profits
Target 2: 1.1900 (distribution zone approach) - Take 30% profits
Target 3: 1.1980-1.2000 (major resistance complex) - Trail remaining 30%
Scenario 2: Pullback Accumulation Setup (SECONDARY)
Conditions for Pullback Entry:
Price retracement to 1.1700-1.1720 breakout support zone
DEMA holding bullish configuration during pullback
Stochastic oversold providing tactical entry signal
Volume profile respect at breakout support levels
Pullback Setup Parameters:
Entry Range: 1.1700-1.1720 (breakout support zone)
Stop Loss: Below 1.1680 (breakout invalidation)
Targets: Same as primary scenario with enhanced risk/reward
Position Sizing: Maximum allocation given superior entry point
Scenario 3: Acceleration Breakout Setup (AGGRESSIVE)
Breakout Trading Framework:
Acceleration Level: Above 1.1800 (void zone entry)
Volume Confirmation: Significant volume expansion supporting breakout
Technical Validation: DEMA gap expansion with ADX above 40
Momentum Persistence: +DI expanding dominance over -DI
Acceleration Parameters:
Entry: 1.1805-1.1820 on confirmed acceleration
Stop: Below 1.1750 (failed acceleration)
Extended Targets: 1.1950, 1.2000, 1.2050+
Position Management: Trail stops using 0.004 structure levels
---
Risk Management Protocols
Position Sizing Guidelines
Aggressive Approach (Recommended for 6E):
Maximum Risk: 2.5% of account (increased allocation due to exceptional technical quality)
Contract Calculation: Account Size × 0.025 ÷ (Stop Distance × $12.50 per pip)
Example: $100,000 account with 60-pip stop = 33 contracts maximum
Rationale: Strongest technical setup justifies aggressive allocation
Stop Loss Hierarchy
Tactical Stop: 1.1710 (DEMA support)
Strategic Stop: 1.1680 (breakout support)
Emergency Stop: 1.1650 (institutional accumulation boundary)
Profit Management Framework
Systematic Profit Taking:
First Target (40%): Lock in profits at initial resistance zone
Second Target (30%): Capture extended move through distribution areas
Final Position (30%): Trail for potential acceleration beyond 1.2000
Trail Stop Method: Use 0.004 structure chart levels once in profit
---
Market Context and External Factors
Fundamental Catalysts Supporting Euro Strength
Central Bank Policy Dynamics:
ECB maintaining restrictive stance longer than Fed
Interest rate differential shifting in favor of Euro
Quantitative tightening supporting currency fundamentals
Inflation dynamics favoring European monetary policy
Economic Factors:
European energy security improvements reducing volatility
Manufacturing sector stabilization supporting economic outlook
Current account dynamics favoring Euro strength
Political stability improving investor confidence
Technical Market Structure
Currency Market Positioning:
Speculative positioning showing Euro oversold conditions reversing
Commercial hedger activity supporting Euro strength
Cross-currency relationships confirming Dollar weakness
Volatility patterns suggesting sustained directional move
---
Monitoring Checklist and Alert Levels
Daily Monitoring Requirements
DEMA Configuration: Maintain bullish black above orange relationship
Breakout Respect: Confirm price behavior above 1.1700 breakout level
Volume Analysis: Monitor for volume expansion on upward moves
Central Bank Events: ECB and Fed policy statements, economic data releases
Dollar Correlation: Monitor relationship with DXY and other major currency pairs
Critical Alert Levels
Bullish Escalation Alerts:
Break above 1.1800 with volume expansion
DEMA gap expansion beyond 30 pips
+DI moving above 40 with ADX persistence above 40
ECB hawkish policy statements supporting fundamental backdrop
Risk Management Alerts:
DEMA bearish crossover (black below orange)
Break below 1.1700 breakout support level
ADX declining below 25 indicating momentum loss
Fed policy pivot announcements affecting interest rate differential
---
Strategic Outlook and Conviction Assessment
Risk/Reward Analysis
Exceptional Setup Characteristics:
Risk: 60 pips to breakout support (1.1680)
Reward: 150+ pips to first major resistance (1.1900+)
Risk/Reward Ratio: 2.5:1 minimum, potential 4:1+
Probability Assessment: High (80%+) based on technical breakout quality
Portfolio Allocation Recommendation
Maximum Technical Conviction Positioning
Euro Futures represents the highest quality technical setup in the current market environment. The exceptional alignment of DEMA crossover, DMI momentum, and validated breakout above institutional accumulation creates optimal conditions for aggressive positioning. While institutional accumulation is less pronounced than in commodities, the technical execution quality and central bank policy support justify maximum allocation within risk parameters.
Allocation Framework:
Primary Portfolio Weight: 20-25% (maximum technical conviction)
Entry Method: Immediate positioning with scale-in capability on pullbacks
Hold Period: Expect 3-8 week position duration
Exit Strategy: Systematic profit-taking at technical resistance levels
---
Conclusion and Strategic Assessment
Euro Futures presents the strongest technical setup among all analyzed markets, with exceptional DEMA crossover quality and validated breakout above institutional accumulation. While the institutional positioning is less dramatic than commodity accumulation patterns, the technical execution signals are pristine and supported by favorable central bank policy dynamics. Current positioning above breakout support offers superior risk/reward characteristics with clearly defined parameters for both profit-taking and risk management.
Implementation Priority: Immediate aggressive positioning recommended - this technical setup quality represents the gold standard for momentum-based entries with institutional validation.
Next Review: Daily monitoring of DEMA configuration and breakout level respect
Position Management: Systematic profit-taking protocol with trailing stops at technical levels
---
Important Disclaimer
Risk Warning and Educational Purpose Statement
This analysis is provided for educational and informational purposes only and does not constitute financial advice, investment recommendations, or trading signals. All trading and investment decisions are solely the responsibility of the individual trader or investor.
Key Risk Considerations:
Futures trading involves substantial risk of loss and is not suitable for all investors
Past performance does not guarantee future results
Market conditions can change rapidly, invalidating any analysis
Leverage can amplify both profits and losses significantly
Individual financial circumstances and risk tolerance vary greatly
Professional Guidance: Before making any trading decisions, consult with qualified financial advisors, conduct your own research, and ensure you fully understand the risks involved. Only trade with capital you can afford to lose.
Methodology Limitations: Volume profile analysis and technical indicators are tools for market assessment but are not infallible predictors of future price movement. Market dynamics include numerous variables that cannot be fully captured in any single analytical framework.
The views and analysis presented represent one interpretation of market data and should be considered alongside other forms of analysis and individual judgment.
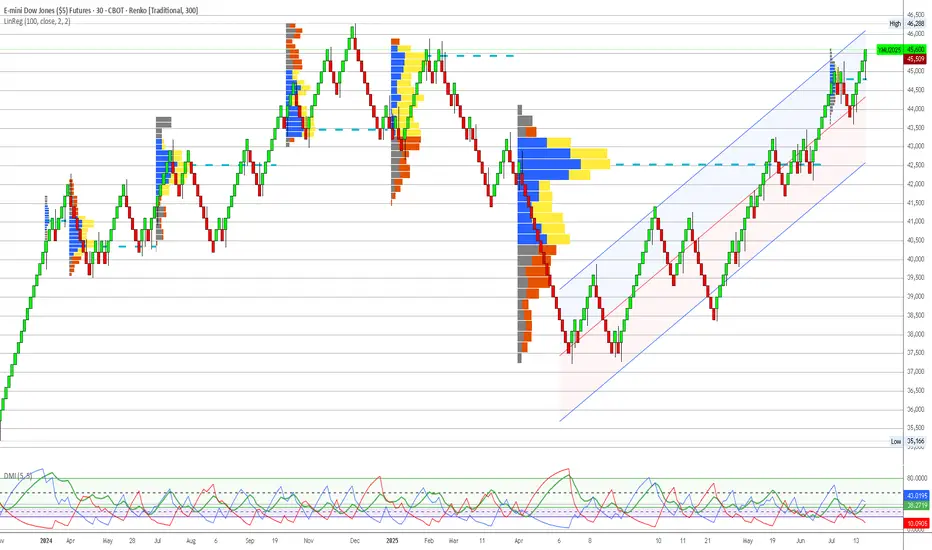
Dow Jones (YM) - Technical Analysis Report - 20250908Analysis Date: September 8, 2025
Current Price: 45,537
Market Session: Post-Market Analysis
---
Executive Summary
Dow Jones presents a moderately extended equity position with manageable risk characteristics compared to other major indices. While trading above institutional accumulation levels, the extension is less severe than S&P 500 or Nasdaq, making it the least dangerous of the equity exposures. However, institutional positioning analysis reveals limited upside potential with asymmetric risk favoring defensive strategies.
---
Quarterly Volume Profile Analysis
Institutional Positioning Intelligence
The quarterly volume profile (Q3 2025) reveals a concerning pattern typical of extended equity markets in late-cycle environments:
Primary Institutional Activity Zone: 42,000-43,500
Moderate blue volume concentration representing historical institutional positioning
Current price (45,537) trades approximately 2,000+ points above primary accumulation
Volume density significantly lighter than commodity accumulation patterns
Institutional activity appears distributed rather than concentrated
Extension Analysis:
Core Accumulation: 42,500-43,000 (peak institutional activity)
Extended Zone: 43,500-44,500 (moderate institutional interest)
Current Level: 45,537 (approximately 5-7% above institutional positioning)
Void Risk: Above 46,000 (minimal institutional support visible)
Resistance Structure Analysis:
45,800-46,200: Immediate resistance with mixed volume activity
46,500-47,000: Historical distribution zones from previous highs
47,500+: Complete institutional void representing extreme overextension
Price Structure Context
Historical Pattern Recognition:
The current Dow Jones setup displays classic late-cycle equity characteristics where price has methodically ground higher above institutional accumulation zones. Unlike the catastrophic voids seen in S&P 500 and Nasdaq, YM shows a more measured extension that may be sustainable in the near term.
Relative Risk Assessment:
Manageable Extension: 5-7% above institutional levels vs 15%+ in other indices
Blue-Chip Nature: Dow composition includes more defensive, dividend-paying companies
Institutional Memory: Historical support levels around 42,000-43,000 well-established
Risk Definition: Clear institutional boundaries provide defensive positioning reference
Sector Composition Considerations
Dow Jones Defensive Characteristics:
Utilities and consumer staples providing defensive anchor
Financial sector exposure to interest rate sensitivity
Industrial components reflecting economic cycle positioning
Technology weight lower than growth-focused indices
---
Execution Chart Technical Analysis
Current Technical Configuration - DETERIORATING MOMENTUM
DEMA Analysis - WARNING SIGNALS EMERGING:
Black Line (Fast DEMA 12): Currently at 45,537
Orange Line (Slow DEMA 20): Currently at 45,480
Configuration: Bullish but narrowing gap indicating momentum loss
Trend Bias: Technical momentum weakening despite bullish configuration
DMI/ADX Assessment - MOMENTUM DETERIORATION:
ADX Level: Declining from previous highs, currently around 25-30
+DI vs -DI: +DI losing dominance, -DI starting to gain ground
Momentum Direction: Showing signs of exhaustion after extended advance
Trend Strength: Weakening ADX suggests institutional conviction fading
Stochastic Analysis - OVERBOUGHT CONDITIONS:
Tactical Stochastic (5,3,3): Overbought territory with negative divergence
Strategic Stochastic (50,3,3): Extended levels showing momentum fatigue
Divergence Analysis: Price making new highs while momentum indicators lag
Support and Resistance Levels
Critical Technical Levels:
Current Resistance: 45,800 (near-term extension limit)
Key Resistance: 46,200 (major resistance zone)
Major Resistance: 46,800 (dangerous overextension territory)
Immediate Support: 45,200 (DEMA cluster)
Key Support: 44,500 (institutional extension boundary)
Major Support: 42,500-43,000 (primary institutional accumulation)
---
Trading Scenarios and Setup Criteria
Scenario 1: Defensive Profit-Taking Setup (PRIMARY)
Optimal Conditions for Position Reduction:
DEMA momentum loss: Gap narrowing between black and orange lines
DMI deterioration: -DI gaining on +DI with weakening ADX
Stochastic overbought: Both timeframes showing exhaustion signals
Volume analysis: Declining volume on any advance attempts
Resistance respect: Failure to break above 46,000 cleanly
Profit-Taking Protocol:
Primary Action: Reduce positions by 50-75% at current levels
Secondary Reduction: Complete exit on any bounce to 46,000+
Stop Management: Trail stops using 300-point intervals
Cash Allocation: Redirect capital to commodity opportunities
Scenario 2: Range-Trading Setup (SECONDARY)
Conditions for Tactical Range Trading:
Defined range: 44,500-45,800 (institutional boundary to resistance)
DEMA maintaining bullish bias within range
Volume profile respect at key levels
ADX below 25 indicating sideways consolidation
Range Trading Parameters:
Long Zone: 44,500-44,800 (institutional boundary approach)
Short Zone: 45,600-45,800 (resistance approach)
Stop Distance: 300-450 points maximum
Position Size: Reduced allocation (1% account risk maximum)
Scenario 3: Breakdown Short Setup (AGGRESSIVE)
Short Entry Conditions:
DEMA bearish crossover: Black line breaking below orange line
Support violation: Break below 44,500 institutional boundary
Volume confirmation: Increased volume supporting breakdown
DMI alignment: -DI gaining clear dominance over +DI
Short Setup Parameters:
Entry Range: 44,200-44,400 on confirmed breakdown
Stop Loss: Above 45,000 (failed breakdown)
Targets: 43,000, 42,500, 42,000 (institutional accumulation zones)
Risk Management: Tight stops given counter-trend positioning
---
Risk Management Protocols
Position Sizing Guidelines
Conservative Approach (Strongly Recommended):
Maximum Risk: 1% of account (reduced from standard due to extension risk)
Contract Calculation: Account Size × 0.01 ÷ (Stop Distance × $5)
Example: $100,000 account with 400-point stop = 50 contracts maximum
Rationale: Extended positioning requires defensive allocation
Stop Loss Hierarchy
Tactical Stop: 45,000 (execution chart support cluster)
Strategic Stop: 44,500 (institutional extension boundary)
Emergency Stop: 43,800 (institutional accumulation approach)
Portfolio Management Framework
Defensive Positioning Strategy:
Current Holdings: Reduce exposure by 50-75%
New Positions: Avoid until return to institutional levels
Capital Reallocation: Redirect to commodity opportunities (NG, CL)
Monitoring Frequency: Daily assessment of momentum deterioration
---
Market Context and External Factors
Fundamental Considerations Affecting Dow Performance
Economic Cycle Positioning:
Federal Reserve policy uncertainty affecting financial sector components
Industrial sector sensitivity to economic slowdown concerns
Consumer discretionary weakness impacting retail components
Utility sector providing defensive characteristics in uncertain environment
Sector Rotation Implications:
Value vs growth rotation potentially favoring Dow components
Dividend yield advantage in higher interest rate environment
Defensive sector weighting providing relative outperformance potential
International exposure through multinational components
Technical Market Structure
Relative Performance Analysis:
Outperforming S&P 500 and Nasdaq on risk-adjusted basis
Less extended from institutional levels than growth indices
Better volume profile support at key technical levels
Defensive sector composition providing downside protection
---
Monitoring Checklist and Alert Levels
Daily Monitoring Requirements
DEMA Configuration: Watch for gap narrowing or bearish crossover
Institutional Respect: Monitor behavior at 44,500 extension boundary
Volume Analysis: Track volume patterns on any advance attempts
Sector Rotation: Monitor defensive vs growth sector performance
Correlation Analysis: Track relationship with bond yields and dollar strength
Critical Alert Levels
Risk Escalation Alerts:
DEMA bearish crossover below 45,400
Break below 44,500 institutional extension boundary
Volume breakdown with accelerating selling pressure
ADX rising with -DI dominance confirming bearish momentum
Defensive Action Triggers:
Any failure to break above 46,000 on multiple attempts
Stochastic negative divergence with price at new highs
Sector rotation away from Dow components toward defensives
Federal Reserve policy announcements affecting interest rate expectations
---
Strategic Outlook and Risk Assessment
Risk/Reward Analysis
Asymmetric Risk Profile:
Upside Potential: Limited 500-800 points to dangerous overextension
Downside Risk: 2,000+ points to institutional accumulation zones
Risk/Reward Ratio: Unfavorable 1:3+ downside vs upside
Probability Assessment: Moderate (40%) for further upside, High (70%) for correction
Portfolio Allocation Recommendation
Defensive Positioning Required
Dow Jones represents the least dangerous equity exposure in current market conditions but still requires defensive management. The 5-7% extension above institutional levels, while manageable compared to other indices, suggests limited upside potential with significant correction risk. Priority should be placed on systematic profit-taking and capital reallocation to higher-conviction commodity opportunities.
Allocation Framework:
Current Portfolio Weight: Reduce to 5-8% maximum (from previous levels)
Entry Method: Avoid new positions until institutional level return
Hold Period: Short-term tactical only, exit on weakness
Exit Strategy: Systematic reduction on any bounce attempts
---
Conclusion and Strategic Assessment
Dow Jones offers the best risk profile among equity indices but remains fundamentally challenged by extension above institutional positioning. The defensive sector composition and less severe overextension provide relative safety, but the asymmetric risk profile strongly favors capital preservation over growth seeking. Current conditions warrant defensive positioning with readiness to exit entirely on any momentum deterioration.
Strategic Priority: Capital preservation and systematic risk reduction while maintaining readiness for complete exit if institutional extension boundaries are violated.
Next Review: Daily monitoring of momentum indicators and institutional level approach
Position Management: Systematic profit-taking with defensive stop management
---
Important Disclaimer
Risk Warning and Educational Purpose Statement
This analysis is provided for educational and informational purposes only and does not constitute financial advice, investment recommendations, or trading signals. All trading and investment decisions are solely the responsibility of the individual trader or investor.
Key Risk Considerations:
Futures trading involves substantial risk of loss and is not suitable for all investors
Past performance does not guarantee future results
Market conditions can change rapidly, invalidating any analysis
Leverage can amplify both profits and losses significantly
Individual financial circumstances and risk tolerance vary greatly
Professional Guidance: Before making any trading decisions, consult with qualified financial advisors, conduct your own research, and ensure you fully understand the risks involved. Only trade with capital you can afford to lose.
Methodology Limitations: Volume profile analysis and technical indicators are tools for market assessment but are not infallible predictors of future price movement. Market dynamics include numerous variables that cannot be fully captured in any single analytical framework.
The views and analysis presented represent one interpretation of market data and should be considered alongside other forms of analysis and individual judgment.
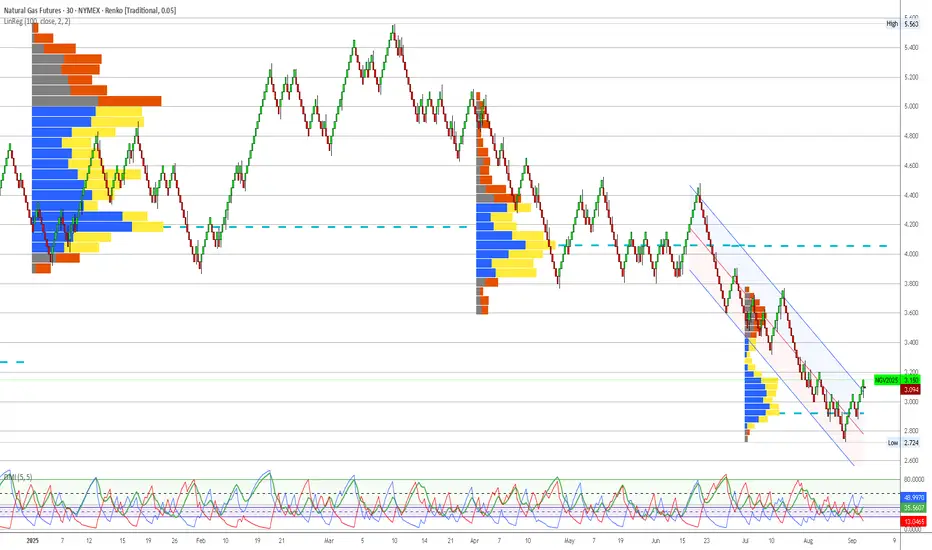
Natural Gas (NG) - Technical Analysis Report - 20250908Analysis Date: September 8, 2025
Current Price: $3.125
Market Session: Post-Market Analysis
---
Executive Summary
Natural Gas presents the highest conviction opportunity in the current market environment, with exceptional alignment between institutional positioning and technical momentum. The quarterly volume profile reveals massive institutional accumulation at current levels, while execution chart signals confirm a validated reversal pattern. This represents a classic institutional intelligence-based setup with superior risk/reward characteristics.
---
Quarterly Volume Profile Analysis
Institutional Positioning Intelligence
The quarterly volume profile (Q3 2025) displays the most compelling institutional accumulation pattern across all analyzed markets:
Primary Institutional Accumulation Zone: $2.90-$3.15
Extraordinary blue volume concentration representing massive institutional positioning
Current price ($3.125) sits in the optimal zone within this accumulation area
Volume density indicates sustained institutional commitment over extended period
Width and intensity of blue volume suggests major strategic positioning campaign
Volume Profile Architecture:
Core Accumulation: $3.00-$3.10 (heaviest institutional activity)
Extended Support: $2.90-$3.00 (secondary institutional positioning)
Breakout Level: $3.15-$3.20 (upper boundary of accumulation zone)
Void Zone: Below $2.85 (minimal institutional interest, evacuation territory)
Resistance Structure Analysis:
$3.25-$3.40: First institutional resistance with mixed volume
$3.60-$3.80: Moderate yellow volume indicating previous distribution
$4.00+: Historical distribution zones from earlier 2025 highs
Price Structure Context
Historical Pattern Recognition:
The current Natural Gas setup mirrors successful commodity reversal patterns, particularly the proven crude oil institutional accumulation model. The exceptional width and intensity of institutional volume at current levels suggests this represents a major strategic allocation by smart money participants.
Critical Structure Validation:
Institutional Floor: $2.90 represents absolute lower boundary of smart money positioning
Volume Point of Control: $3.05 shows peak institutional activity within accumulation zone
Conviction Level: Volume density indicates highest institutional commitment in analyzed market set
Risk Definition: Clear institutional boundaries provide precise risk management parameters
Seasonal and Fundamental Context
Seasonal Dynamics Supporting Institutional Positioning:
September-October: Transition into heating season demand
Storage injection season ending: Supply/demand dynamics shifting
Winter weather preparation: Industrial and residential demand increases
Power generation demand: Continued baseload electricity requirements
---
Execution Chart Technical Analysis
Current Technical Configuration - BULLISH ALIGNMENT
DEMA Analysis - CONFIRMED BULLISH SIGNAL:
Black Line (Fast DEMA 12): Currently at $3.14
Orange Line (Slow DEMA 20): Currently at $3.10
Configuration: Strong bullish crossover confirmed and expanding
Trend Bias: Technical momentum strongly bullish, aligned with institutional positioning
DMI/ADX Assessment - STRONG TRENDING CONDITIONS:
ADX Level: 44+ indicating powerful directional movement
+DI vs -DI: +DI clearly dominant over -DI
Momentum Direction: Confirming sustained bullish bias
Trend Strength: Exceptional ADX reading suggests institutional conviction
Stochastic Analysis - MOMENTUM CONFIRMATION:
Tactical Stochastic (5,3,3): Bullish configuration with room for extension
Strategic Stochastic (50,3,3): Confirming longer-term bullish momentum
Divergence Analysis: No negative divergences, clean momentum structure
Support and Resistance Levels
Immediate Technical Levels:
Current Support: $3.075 (DEMA 20 orange line)
Key Support: $3.00 (institutional accumulation core)
Major Support: $2.95 (institutional floor approach)
Immediate Resistance: $3.20 (accumulation zone breakout)
Key Resistance: $3.30 (first institutional resistance)
Major Resistance: $3.50 (significant distribution zone)
---
Trading Scenarios and Setup Criteria
Scenario 1: Continuation Long Setup (PRIMARY)
Optimal Conditions for Long Entry:
DEMA bullish maintenance: Black line remaining above orange line
DMI confirmation: +DI sustaining dominance over -DI
ADX persistence: Maintaining strong trending conditions above 40
Volume respect: Price holding above $3.00 institutional core
Momentum alignment: All timeframes confirming bullish bias
Entry Protocol:
Primary Entry: Current levels $3.10-$3.15 (within institutional accumulation)
Secondary Entry: $3.00-$3.05 on any pullback to core accumulation
Position Sizing: Full 2% account risk given exceptional setup quality
Stop Loss: Below $2.90 (institutional floor violation)
Profit Targets:
Target 1: $3.35 (first institutional resistance) - Take 40% profits
Target 2: $3.60 (major resistance zone) - Take 30% profits
Target 3: $3.80-$4.00 (distribution zone approach) - Trail remaining 30%
Scenario 2: Pullback Accumulation Setup (SECONDARY)
Conditions for Pullback Entry:
Price retracement to $3.00-$3.05 core accumulation zone
DEMA holding bullish configuration during pullback
Stochastic oversold providing tactical entry signal
Volume profile respect at institutional support levels
Pullback Setup Parameters:
Entry Range: $3.00-$3.05 (core institutional accumulation)
Stop Loss: Below $2.90 (institutional positioning violation)
Targets: Same as primary scenario with enhanced risk/reward
Position Sizing: Maximum allocation given superior entry point
Scenario 3: Breakout Acceleration Setup (AGGRESSIVE)
Breakout Trading Framework:
Breakout Level: Above $3.20 (accumulation zone upper boundary)
Volume Confirmation: Increased volume supporting breakout move
Technical Validation: DEMA gap expansion confirming momentum
Momentum Persistence: ADX remaining above 40 with +DI dominance
Breakout Parameters:
Entry: $3.22-$3.25 on confirmed breakout
Stop: Below $3.10 (failed breakout)
Accelerated Targets: $3.50, $3.75, $4.00+
Position Management: Trail stops using institutional levels
---
Risk Management Protocols
Position Sizing Guidelines
Aggressive Approach (Recommended for NG):
Maximum Risk: 2.5% of account (increased allocation due to exceptional setup quality)
Contract Calculation: Account Size × 0.025 ÷ (Stop Distance × $10)
Example: $100,000 account with $0.25 stop = 1,000 contracts maximum
Rationale: Highest conviction setup justifies maximum allocation
Stop Loss Hierarchy
Tactical Stop: $3.05 (execution chart support)
Strategic Stop: $2.95 (institutional accumulation boundary)
Emergency Stop: $2.85 (institutional floor violation)
Profit Management Framework
Systematic Profit Taking:
First Target (40%): Lock in profits at institutional resistance
Second Target (30%): Capture extended move through distribution zones
Final Position (30%): Trail for potential acceleration beyond $4.00
Trail Stop Method: Use $0.05 structure chart levels once in profit
---
Market Context and External Factors
Fundamental Catalysts Supporting Bullish Thesis
Supply/Demand Dynamics:
Storage levels approaching seasonal norms
Production discipline from major operators
Export capacity utilization supporting demand
Power generation baseload requirements
Seasonal Factors:
Heating season demand preparation (September-October)
Industrial consumption patterns shifting higher
Weather derivatives market positioning for winter volatility
LNG export commitments providing demand floor
Technical Market Structure
Commitment of Traders Alignment:
Commercial hedgers reducing short positions
Large speculators building long exposure
Small traders exhibiting contrarian pessimism (bullish indicator)
Open interest expansion confirming institutional participation
---
Monitoring Checklist and Alert Levels
Daily Monitoring Requirements
DEMA Configuration: Maintain bullish black above orange relationship
Institutional Respect: Confirm price behavior above $3.00 core zone
Volume Analysis: Monitor for any changes in accumulation patterns
External Events: EIA storage reports, weather forecasts, export data
Correlation Tracking: Monitor relationship with heating oil and power prices
Critical Alert Levels
Bullish Escalation Alerts:
Break above $3.20 with volume expansion
DEMA gap expansion indicating acceleration
+DI moving above 40 with ADX persistence above 50
Weather forecasts showing early cold patterns
Risk Management Alerts:
DEMA bearish crossover (black below orange)
Break below $3.00 institutional core support
ADX declining below 30 indicating momentum loss
Negative storage surprise significantly above expectations
---
Strategic Outlook and Conviction Assessment
Risk/Reward Analysis
Exceptional Setup Characteristics:
Risk: $0.25 to institutional floor ($2.90)
Reward: $0.50+ to first major resistance ($3.60+)
Risk/Reward Ratio: 2:1 minimum, potential 3:1+
Probability Assessment: High (75%+) based on institutional alignment
Portfolio Allocation Recommendation
Maximum Conviction Positioning
Natural Gas represents the highest quality setup in the current market environment. The exceptional alignment between institutional accumulation and technical momentum, combined with supportive seasonal factors, justifies maximum allocation within risk management parameters. This setup exemplifies institutional intelligence-based trading at its finest - clear smart money positioning validated by technical execution signals.
Allocation Framework:
Primary Portfolio Weight: 35-40% (maximum conviction)
Entry Method: Scaled entry over 2-3 trading sessions
Hold Period: Expect 2-6 week position duration
Exit Strategy: Systematic profit-taking at institutional resistance levels
---
Conclusion and Strategic Assessment
Natural Gas presents a textbook example of institutional intelligence confirmed by technical momentum. The massive quarterly accumulation zone, combined with validated execution chart signals, creates optimal conditions for systematic position building. Current positioning within the institutional sweet spot offers exceptional risk/reward characteristics with clearly defined parameters for both profit-taking and risk management.
Implementation Priority: Immediate action recommended - this setup quality rarely presents itself with such clear institutional validation and technical confirmation.
Next Review: Daily monitoring of DEMA configuration and institutional level respect
Position Management: Systematic profit-taking protocol with trailing stops at institutional levels
---
Important Disclaimer
Risk Warning and Educational Purpose Statement
This analysis is provided for educational and informational purposes only and does not constitute financial advice, investment recommendations, or trading signals. All trading and investment decisions are solely the responsibility of the individual trader or investor.
Key Risk Considerations:
Futures trading involves substantial risk of loss and is not suitable for all investors
Past performance does not guarantee future results
Market conditions can change rapidly, invalidating any analysis
Leverage can amplify both profits and losses significantly
Individual financial circumstances and risk tolerance vary greatly
Professional Guidance: Before making any trading decisions, consult with qualified financial advisors, conduct your own research, and ensure you fully understand the risks involved. Only trade with capital you can afford to lose.
Methodology Limitations: Volume profile analysis and technical indicators are tools for market assessment but are not infallible predictors of future price movement. Market dynamics include numerous variables that cannot be fully captured in any single analytical framework.
The views and analysis presented represent one interpretation of market data and should be considered alongside other forms of analysis and individual judgment.
WTI Crude Oil (CL) - Technical Analysis Report - 20250908Analysis Date : September 8, 2025
Current Price : $62.25
Market Session : Pre-Market Analysis
Executive Summary
WTI Crude Oil presents a complex trading scenario with strong institutional support at current levels offset by concerning technical deterioration on the execution timeframe. The quarterly volume profile reveals massive smart money accumulation in the $62-64 zone, yet recent DEMA bearish crossover signals potential near-term weakness. This analysis provides a comprehensive framework for navigating this conflicted setup.
Quarterly Volume Profile Analysis
Institutional Positioning Intelligence
The quarterly volume profile (Q3 2025) reveals critical institutional positioning patterns that provide strategic context for all tactical decisions:
Primary Institutional Accumulation Zone: $62.00-$64.50
Massive blue volume concentration representing institutional accumulation
Heaviest volume density occurs at $62.50-$63.50 range
Current price ($62.25) sits at the lower boundary of this critical zone
Volume profile width indicates sustained institutional interest over extended period
Secondary Support Levels:
$60.50-$61.50: Moderate blue volume representing backup institutional support
$58.00-$59.00: Minimal volume suggesting limited institutional interest
Below $58.00: Complete volume void indicating institutional evacuation zone
Resistance Structure Analysis:
$65.00-$66.50: First institutional resistance zone with mixed volume
$68.00-$70.00: Heavy yellow volume indicating institutional distribution
$70.00+: Historical distribution zone from Q2 2025 peak
Price Structure Context
Historical Pattern Recognition:
The current positioning mirrors successful institutional accumulation patterns observed in previous commodity cycles. The width and intensity of the $62-64 blue volume zone suggests this represents a major strategic positioning by institutional participants, similar to the Natural Gas accumulation pattern that preceded its successful reversal.
Critical Structure Points:
Institutional Floor: $62.00 represents the absolute lower boundary of smart money positioning
Volume Point of Control: $63.25 shows peak institutional activity
Breakout Level: $64.50 marks the upper boundary requiring institutional continuation
Void Zone: $58-60 represents dangerous territory with minimal institutional backing
Execution Chart Technical Analysis
Current Technical Configuration
DEMA Analysis - CRITICAL WARNING SIGNAL:
Black Line (Fast DEMA 12): Currently at $62.25
Orange Line (Slow DEMA 20): Currently at $62.50
Configuration: Bearish crossover confirmed (black below orange)
Trend Bias: Technical momentum now bearish despite institutional support
DMI/ADX Assessment:
ADX Level: 40+ indicating strong directional movement
+DI vs -DI: -DI gaining dominance over +DI
Momentum Direction: Confirming the DEMA bearish bias
Trend Strength: High ADX suggests this technical shift has conviction
Stochastic Analysis:
Tactical Stochastic (5,3,3): Oversold territory providing potential bounce signal
Strategic Stochastic (50,3,3): Still showing bearish momentum
Divergence: Mixed signals between timeframes creating uncertainty
Support and Resistance Levels
Immediate Technical Levels:
Current Resistance: $62.75 (DEMA 20 orange line)
Key Resistance: $63.25 (institutional volume POC)
Major Resistance: $64.00 (upper institutional boundary)
Immediate Support: $61.75 (recent swing low)
Critical Support: $61.25 (institutional floor approach)
Emergency Support: $60.50 (secondary institutional zone)
Trading Scenarios and Setup Criteria
Scenario 1: Bullish Reversal Setup
Required Conditions for Long Entry:
DEMA recrossover: Black line must cross back above orange line
DMI confirmation: +DI must regain dominance over -DI
ADX maintenance: Strong directional reading above 25-30
Volume respect: Price must hold above $62.00 institutional floor
Stochastic alignment: Both tactical and strategic stochastics showing bullish divergence
Entry Protocol:
Primary Entry: $62.50-$63.00 upon DEMA bullish recrossover
Secondary Entry: $62.00-$62.25 if institutional floor holds with technical improvement
Position Sizing: 2% account risk maximum given conflicted signals
Stop Loss: Below $61.50 (institutional support violation)
Profit Targets:
Target 1: $65.00 (first institutional resistance) - Take 50% profits
Target 2: $67.00 (major resistance zone) - Take 25% profits
Target 3: $68.50-$70.00 (distribution zone) - Trail remaining 25%
Scenario 2: Bearish Breakdown Setup
Short Entry Conditions:
DEMA bearish continuation: Black line accelerating below orange line
Volume violation: Price breaking below $62.00 institutional floor
DMI confirmation: -DI expanding lead over +DI
ADX persistence: Maintaining strong directional bias
Short Setup Parameters:
Entry Range: $61.50-$61.75 on institutional support breakdown
Stop Loss: Above $62.75 (failed breakdown)
Targets: $60.00, $58.50, $57.00 (volume void zones)
Risk Management: Tight stops given counter-institutional positioning
Scenario 3: Range-Bound Consolidation
Sideways Trading Framework:
Range Definition: $62.00-$64.50 (institutional accumulation zone)
Long Zone: $62.00-$62.50 (lower boundary)
Short Zone: $63.75-$64.50 (upper boundary)
Stop Distance: 0.5-0.75 points ($500-$750 per contract)
Profit Target: Opposite range boundary
Risk Management Protocols
Position Sizing Guidelines
Conservative Approach (Recommended):
Maximum Risk: 1.5% of account (reduced from standard 2% due to technical/institutional conflict)
Contract Calculation: Account Size × 0.015 ÷ (Stop Distance × $10)
Example: $100,000 account with $0.75 stop = 200 contracts maximum
Stop Loss Hierarchy
Tactical Stop: $61.75 (execution chart support)
Strategic Stop: $61.50 (institutional boundary approach)
Emergency Stop: $60.75 (institutional floor violation)
Time-Based Risk Controls
Monitoring Requirements:
Daily: DEMA relationship and institutional level respect
4-Hour: DMI momentum shifts and ADX strength
Hourly: Stochastic divergence patterns
Exit Timeline: 10 trading days maximum if no clear resolution
Market Context and External Factors
Fundamental Considerations
Supply/Demand Dynamics:
OPEC+ production decisions impacting supply outlook
US Strategic Petroleum Reserve policies
China demand recovery prospects
Refinery maintenance season effects (September-October)
Geopolitical Factors:
Middle East tension levels affecting risk premiums
US-Iran relations impacting supply disruption concerns
Russia-Ukraine conflict ongoing effects on global energy flows
Seasonal Patterns
September-October Considerations:
End of summer driving season typically bearish for demand
Hurricane season potential for supply disruptions
Heating oil demand preparation potentially supportive
Refinery turnaround season creating temporary supply tightness
Monitoring Checklist and Alert Levels
Daily Monitoring Requirements
DEMA Status: Track black vs orange line relationship
Institutional Respect: Confirm price behavior at $62.00 floor
Volume Analysis: Monitor any changes in accumulation patterns
External Events: EIA inventory reports, Fed policy statements
Correlation Analysis: Monitor relationship with dollar strength and equity markets
Critical Alert Levels
Bullish Alerts:
DEMA bullish recrossover above $62.50
Strong bounce from $62.00 institutional floor
+DI reclaiming dominance over -DI
Break above $64.50 with volume confirmation
Bearish Alerts:
Break below $62.00 institutional floor
DEMA gap expansion (black line diverging from orange)
Volume breakdown below secondary support at $60.50
ADX above 50 with strong -DI dominance
Conclusion and Strategic Outlook
WTI Crude Oil presents a classic conflict between institutional positioning and technical momentum. The quarterly volume profile provides unambiguous evidence of major institutional accumulation at current levels, yet execution chart technical deterioration cannot be ignored. This scenario requires heightened vigilance and reduced position sizing until technical and institutional signals realign. The institutional floor at $62.00 represents the critical decision point - respect of this level with technical improvement offers exceptional risk/reward opportunities, while violation signals potential deeper correction despite smart money positioning.
Strategic Recommendation: Defensive positioning with readiness to capitalize on either directional resolution. Prioritize capital preservation while maintaining alert status for high-probability setups upon signal alignment.
Next Review: Daily assessment of DEMA configuration and institutional level respect
Document Status: Active monitoring required - conflicted signals demanding careful attention
Important Disclaimer
Risk Warning and Educational Purpose Statement
This analysis is provided for educational and informational purposes only and does not constitute financial advice, investment recommendations, or trading signals. All trading and investment decisions are solely the responsibility of the individual trader or investor.
Key Risk Considerations:
Futures trading involves substantial risk of loss and is not suitable for all investors
Past performance does not guarantee future results
Market conditions can change rapidly, invalidating any analysis
Leverage can amplify both profits and losses significantly
Individual financial circumstances and risk tolerance vary greatly
Professional Guidance: Before making any trading decisions, consult with qualified financial advisors, conduct your own research, and ensure you fully understand the risks involved. Only trade with capital you can afford to lose.
Methodology Limitations: Volume profile analysis and technical indicators are tools for market assessment but are not infallible predictors of future price movement. Market dynamics include numerous variables that cannot be fully captured in any single analytical framework.
The views and analysis presented represent one interpretation of market data and should be considered alongside other forms of analysis and individual judgment.
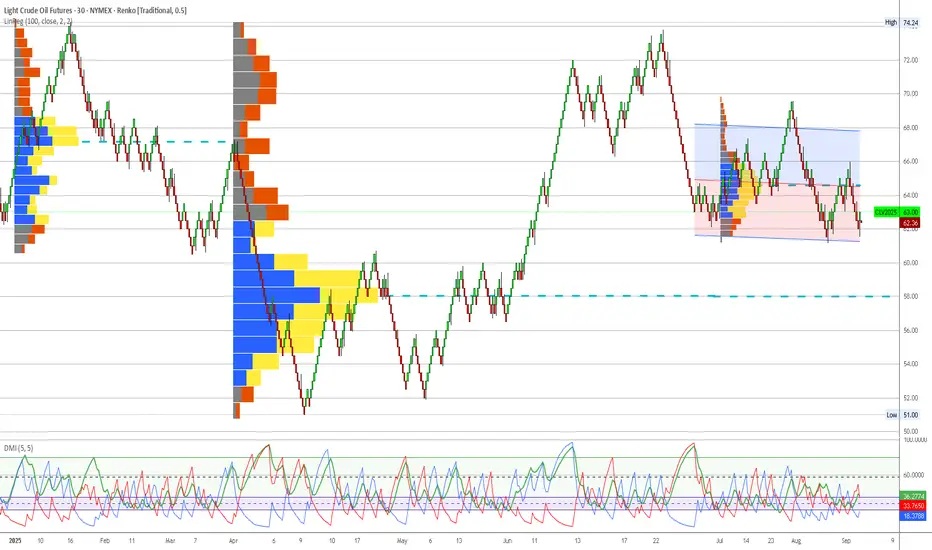
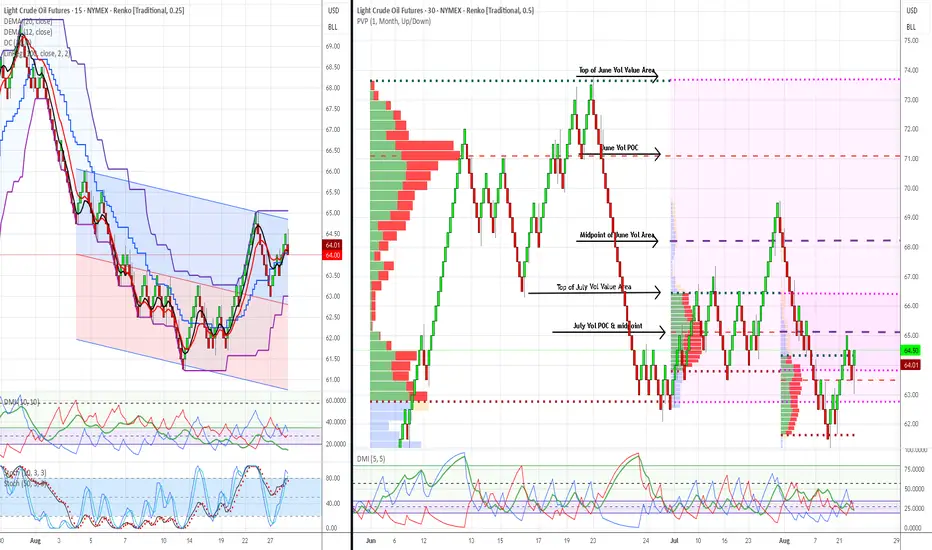
WTI Crude Oil Trading Analysis: 02-September-2025Week Ahead Plan: September 2-6, 2025
Analysis Period : August 26-30, 2025 Review | September 2-6, 2025 Outlook
Market : WTI Crude Oil Futures (CL1!)
Methodology : Dual Renko Chart System ($0.25/15min + $0.50/30min)
Current Price : $64.00 (August 30, 2025)
________________________________________
Strategic Outlook & Market Setup
Primary Scenario (70% Probability): Pullback First, Then Recovery
What to Expect : Market opens lower Tuesday ($63.00-63.50 range) due to bearish signal on short-term chart. This creates a buying opportunity if support holds.
Trading Plan:
Tuesday Opening : Expect gap down - don't panic, this was anticipated
Buy Zone : Look for entries between $62.00-63.50 (strong institutional support)
Confirmation Needed : Wait for short-term trend to flip bullish again before buying
Target : Still aiming for $66.50 but may take extra 3-5 days to get there
Secondary Scenario (25% Probability): Sideways Consolidation
What to Expect : Market trades in $63.50-64.50 range for several days while technical signals realign.
Trading Plan:
Strategy: Be patient - don't force trades in choppy conditions
Wait For: Clear breakout above $64.50 with volume
Risk: Could waste 1-2 weeks in sideways action
Low Probability Scenario (5% Probability): Immediate Continuation Up
What to Expect : Market gaps up above $64.25 and keeps rising.
Trading Plan:
Verify: Make sure both short-term and long-term signals turn bullish
Caution: Be skeptical without strong volume confirmation
Action: Can buy but use smaller position sizes until confirmed
________________________________________
Market Risk Factors & Monitoring
Critical Support Level : $62.00
Why Important: Massive institutional buying occurred here - if it breaks, the bullish case is dead
Action If Broken: Exit all long positions immediately, wait for new setup
Probability of Break: Low (15%) but must be respected
Key Events This Week :
Tuesday: ISM Services data (economic health indicator)
Wednesday: Weekly oil inventory report (could cause volatility)
Friday: Jobs report (affects overall market sentiment)
Warning Signs to Watch:
Technical: Short-term trend staying bearish for more than 3 days
Volume: Declining volume on any bounce attempts
Support: Any trading below $62.50 for extended periods
Time: No progress toward $66.50 target within 10 total trading days
Positive Signs to Look For :
Technical: Short-term trend flipping back to bullish (key confirmation)
Volume: Above-average volume on any recovery moves
Support: Strong buying interest at $62-63 zone
Momentum: Clean breakout above $64.50 with follow-through
________________________________________
Forward-Looking Adjustments
Modified Risk Management :
Position Size: Use 50% of normal position size until both timeframes align bullish
Stop Loss: Tighter stops at $62.75 (just below support zone)
Entry Patience: Don't chase - wait for pullback to support levels
Profit Taking: Be more aggressive taking profits at first target ($66.50)
Revised Entry Strategy:
Before Buying, Confirm ALL Three:
Price: Trading at or near $62-63 support zone
Technical: Short-term trend signal flips back to bullish
Volume: Above-average buying interest visible
Timeline Expectations :
Days 1-3: Expect pullback/consolidation phase
Days 4-5: Look for bullish confirmation signals
Days 6-10: Resume advance toward $66.50 target if signals align
Beyond Day 10: If no progress, reassess entire strategy
Success Metrics:
Minimum Goal: Protect capital during pullback phase
Primary Target: $66.50 within 2 weeks (revised from 1 week)
Risk Limit: Maximum 2% account loss if support fails
Time Limit: Exit strategy if no directional progress within 10 days total
Simplified Decision Framework :
Green Light to Buy: Price near $62-63 + Short-term trend bullish + Good volume Yellow Light (Wait): Mixed signals, choppy price action, low volume
Red Light (Exit): Price below $62, bearish trend continuing, time limit exceeded
________________________________________
Bottom Line : The bigger picture remains bullish, but short-term signals suggest a pullback first. Use any weakness to $62-63 as a buying opportunity, but only with proper confirmation. Be patient - the setup is still valid but timing may be delayed by a few days.
________________________________________
Document Classification : Trading Analysis
Next Update : September 6, 2025 (Weekly Review)
Risk Level : Moderate (controlled institutional setup)
This analysis represents continued validation of a systematic, institutional-grade trading methodology with demonstrated predictive accuracy and risk control capabilities. This is a view that represents possible scenarios but ultimate responsibility is with each individual trader.
Risk Disclaimer: Past performance does not guarantee future results. All trading involves risk of loss.
Bullish Energy in Natural Gas: -DMI Extreme + Wedge BreakoutThe Spark in the Gas Market
Natural gas has been quietly simmering in recent weeks, building pressure beneath a surface of consolidation. Traders watching closely will have noticed a rare alignment — one that history shows can potentially precede outsized moves. We’re talking about the convergence of two powerful signals: a -DMI yearly extreme and a falling wedge breakout.
In the past, this combination has marked moments when bearish momentum had run its course, giving way to swift and decisive bullish reversals. Now, that same alignment is flashing again, inviting a closer look at the technical landscape and the potential opportunities it presents.
Why This Setup Matters
The -DMI (Directional Movement Index) measures the strength of downward price moves. When it pushes beyond two standard deviations above its yearly linear regression channel, it signals an overextended bearish phase. Historically, these extremes have often coincided with market bottoms in Natural Gas Futures.
Layer on top a falling wedge — a bullish reversal chart pattern — and the probability of an upside move gains weight. The wedge compresses price action into a narrowing range, reflecting reduced volatility and setting the stage for a potential explosive breakout once resistance gives way. The current breakout level sits near 3.18, with technical projections aligning closely to a well-defined UFO resistance (UnFilled Orders) zone around 3.90.
The Technical Story Unfolds
Looking at the daily chart in the present, the -DMI has recently breached the +2 standard deviation boundary of its 252-period regression channel — a rare occurrence that, as said, has preceded multiple major bullish reversals in the past year. When this condition appeared, downside momentum often faded, making room for buyers to take control.
This time, the current signal aligns with a falling wedge that has been developing for weeks. Price is about to break above the wedge’s upper boundary at approximately 3.18, suggesting a potential trend reversal.
The Trade Blueprint
Direction: Long
Entry: 3.18 (confirmed breakout above wedge resistance)
Target: 3.90 (wedge projection + UFO resistance)
Stop Loss: 2.858 (below wedge and technical support floor)
Reward-to-Risk Ratio: ~2+ to 1
This structure allows traders to define risk tightly while targeting a meaningful upside move. The setup applies equally to both Natural Gas Futures (NG) and Micro Natural Gas Futures (MNG), offering flexibility in capital allocation. For smaller accounts or those wanting to reduce margin exposure, the MNG contract delivers the same tick size precision with only one-quarter of the notional value.
The Contract Advantage
Natural Gas Futures (NG) represent 10,000 MMBtu per contract, with a minimum tick size of 0.00025 — equivalent to $2.50 per tick.
Micro Natural Gas Futures (MNG) are one-tenth the size at 1,000 MMBtu per contract, with the same 0.00025 tick size equaling $0.25 per tick.
Margin requirements vary with volatility and exchange adjustments, but at the time of writing, the CME lists initial margin for NG in the range of $3,500 per contract, while MNG margins are proportionally lower at $350 per contract. This creates flexibility for traders to scale positions or manage risk without altering the technical logic of the trade. Both contracts trade nearly 24 hours per day, Sunday through Friday, offering the ability to react to global energy market shifts in real time.
Risk Management as the Safety Valve
Defining risk is the cornerstone of any trade plan. The stop loss at 2.858 is not arbitrary — it sits below both the wedge’s lower boundary and a nearby technical support level. If price were to close below this level, it would undermine the bullish thesis and call for an exit.
Using smaller MNG contracts can help align risk with account size, allowing for partial position scaling and better drawdown control. Equally important is avoiding undefined risk scenarios, particularly in a commodity as volatile as natural gas. Precision in both entries and exits reduces exposure to intraday whipsaws while maintaining the trade’s structural integrity.
Closing the Loop
The natural gas market has aligned a rare set of conditions — a -DMI yearly extreme and a falling wedge breakout — each of which has historically preceded significant upside moves on their own. Together, they offer a compelling technical case for a defined, risk-managed long position targeting the 3.90 zone.
While no setup guarantees success, this one seems to offer clarity: a well-defined entry, stop, and target, supported by historical probability and pattern structure. In volatile markets, those moments of clarity are worth paying attention to — and acting on with discipline, and always depending on the trader’s trading plan.
When charting futures, the data provided could be delayed. Traders working with the ticker symbols discussed in this idea may prefer to use CME Group real-time data plan on TradingView: www.tradingview.com - This consideration is particularly important for shorter-term traders, whereas it may be less critical for those focused on longer-term trading strategies.
General Disclaimer:
The trade ideas presented herein are solely for illustrative purposes forming a part of a case study intended to demonstrate key principles in risk management within the context of the specific market scenarios discussed. These ideas are not to be interpreted as investment recommendations or financial advice. They do not endorse or promote any specific trading strategies, financial products, or services. The information provided is based on data believed to be reliable; however, its accuracy or completeness cannot be guaranteed. Trading in financial markets involves risks, including the potential loss of principal. Each individual should conduct their own research and consult with professional financial advisors before making any investment decisions. The author or publisher of this content bears no responsibility for any actions taken based on the information provided or for any resultant financial or other losses.

KIMLUN - DMI and RSI shows BULLISH SIGNAL KIMLUN - CURRENT PRICE : RM1.31
KIMLUN is in an uptrend for medium term as the price is making higher high and higher low. Supported by positive readings in technical oscillators such as DMI (+DI is above -DI) and RSI (above 50), it increases the bullish scenario. At current price trading near SMA 20, there is possibility for price reach upper band in bollinger bands indicator. Nearest support will be RM1.24 (-5.34%) and 1st target will be RM1.41 (+7.63%).
ENTRY PRICE : RM1.30 - RM1.31
TARGET : RM1.41 and RM1.47
SUPPORT : RM1.24
Notes : On the fundamental side, KIMLUN shows a strong recovery in earnings. For FY2022, company was loss RM7.2 million. Then the company rebounded with a profit of RM7.1 million in FY2023. For FY2024, company registered strong performance of profit RM50.3 million.

End of hibernation for the bears?AMEX:SPY is at a pivotal point and could potentially be at the top of the bullish cycle that began in October 2022. If this prediction proves accurate, I think we could see a maximum low of $510 for this year. There are a couple of caveats, including one that will be a clear indicator of whether or not this wave count is accurate, which I will explain later.
On the 1000R chart ($10), this uptrend was confirmed by Supertrend and volume activity. Volume drastically increased at the start of Wave (3) in March 2023 and did not taper off until the start of Wave (4) in July 2024. This was the strongest impulse in the trend, which is common for Wave 3. You can also see the ADX line of the DMI indicator (white line) was at its highest level during that period.
Assuming Wave (5) is already complete, we can observe that the volume in Wave (3) was considerably less than Wave (5).
Other observations supporting this wave count:
- Wave (4) retracing into the territory of Wave 4 of (3)
- Alternation in corrective patterns between Wave (2) and Wave (4); flat in (2) and straight down in (4)
- Wave (5) extending to nearly 1.618 of (1)
While the points I’ve made so far suggest that the market may be on the verge of a crash, the image gets more complicated when you take a closer look on the 250R chart ($2.50). I’ll start with what I’m counting as Wave 4 of (5). The price ended at ATH in Wave 3 and then corrected in an unmistakable five wave descending wedge pattern. This can only be a fourth wave of a larger impulse, so we can conclude with a fair amount of confidence that the wave that follows will be the last.
Here is where things get interesting. The price moved from $575 on January 13th to a slightly higher ATH of $609.24 on January 24th before being rejected again. This uptrend unfolded in a typical bullish pattern and left a notable gap at $584, which is the only gap still left unfilled. The trend change is confirmed on the moving averages. Notice the serious drop in volume that followed as well.
Despite the shift in volume, there are two issues I have with this wave count that are preventing me from calling this a confirmed correction:
1. Wave 5 of (5) was awfully short and only extended roughly $2 above the end of Wave 3 of (5). This does not break any rules, but it is unusual.
2. What I have labelled as Wave B of Wave (1) or (A) of the correction made a new ATH on Friday February 14th, which should invalidate this wave count since the end of Wave 5 of (5) should be the peak.
The second point is why some may think that we are about to resume the larger bull trend, however there is a possibility that they are mistaken based off the PA on the actual index SP:SPX and futures CME_MINI:ES1! . On the SP:SPX chart, we can see that the index did not break the ATH at $6128.18 set on January 25th, and instead rejected at $6,127.24.
CME_MINI:ES1! also failed to notch a new ATH on Friday and I have observed the price action create a nearly perfect bearish butterfly pattern. Also notice how the volume is significantly lower than in the uptrend that began on January 31st.
So the question remains: are we at a tipping point or will the bulls regain control? Right now it’s unclear, but I will keep my bearish sentiment until SP:SPX makes a new ATH, which will invalidate this theory. Since only the ETF that tracks it only made a slightly higher high on low volume, I’m skeptical of the PA on AMEX:SPY at the moment. This is why I entered puts on Friday.
If the trade plays out, I expect the price to quickly move to fill the gap at $584, which is still conveniently located at what I cam considering the 1.236 extension of Wave A, which is a common target extension in flat corrections. I will keep my puts open until this idea is invalidated, as the Wave C drop will likely be caused by a news event that could come at any time. Let me know if you guys are seeing the same thing or something different. Good luck to all!

Ready for 6.5% on the 10Y T-Bill?It’s been a while since I’ve posted an Idea, however since the market may be at a pivotal point I thought I’d do a quick analysis on the $US10Y. Using elliott wave and fibonacci ratios as my base logic, I predict that we could see a 6.5% or higher 10 year T-bill in the near future.
The fib extension above is based off 1.00 of Primary waves 0-3. I’m counting that we are in the early stages of the 5th and final wave, which is commonly 61.8% of waves 0-3 in length.
My wave count is supported by the DMI indicator and the 50sma (Blue) & 100sma (yellow). The yield is still above the moving averages, signaling a continuation to the upside. Primary wave 4 was a zig zag (A-B-C) pattern in a slightly descending channel, which has a tendency to break to the upside. With inflation proving stubborn and a looming trade war providing a backdrop that is concerning to investors, it is time we get back into the mindset that the inflation battle isn’t quite over yet. Yields are rising across the world and the US is no exception.

AES Corporation - Short term view with strong supportSo first of all both price and indicators are confirming the downtrend.
Today NYSE:AES opened with a gap succeeding yesterday's equilibrium in price with doji candles.
The price is still in the middle of the regression line and in the next few days the price don't seems to be close to upper 2 SD.
In the print above the yellow line shows the support at $11.43. The image's time horizon starts at the end of 2006.
Furthermore looking at short ratio available online the value is about 2,7 from mid October as well as more than 22M short interest

Easyjet ready to fly?Easyjet records better financial statements, looking at the report is possible to read that LSE:EZJ flew about 5% increase in seats when compared with last year.
The revenue increased by 14% this mainly because of the increase of 8% in capacity. Looking over the financial indicator it's noticeable an increase in revenue and the difference compared to 13 week moving average.
The price breakout for the second time above the top of ascending triangle following for a cross over the 200ema. The yellow resistance is the strongest one that still needs to be broken.
ADX is already above DMI- and being at 19,49 can show some strength confirming the DMI+.
EFI barely dropped below zero when the price failed to cross the EMA changing direction above zero rapidly.

Gold Short Term Bearish, Medium BullishI am not a financial advisor. This is not meant to be and does not constitute financial, investment, trading, or any other types of advice or recommendation.

Example of Conditions for Starting Trading
Hello, traders.
If you "Follow", you can always get new information quickly.
Please also click "Boost".
Have a nice day today.
-------------------------------------
I will publish in advance due to an external schedule tomorrow.
Accordingly, I will take time to provide additional explanations on the ideas published today.
----------------------------------------
I will talk about the basis for indicating the direction of progress shown in the chart above.
In order to differentiate from other people's analyses, I am trying to explain the basis for indicating the support and resistance points or sections on the chart.
I think that if you understand why those points and sections were set, you will eventually be able to understand them without having to read the explanation all the way through.
For this, more support and resistance points are needed.
This is because we can select the volatility period by additionally drawing the trend line.
However, since all of these processes are displayed on the chart, there are many complaints that the chart is messy and confusing, so we are trying to reduce them as much as possible.
Therefore, there are cases where the chart is displayed in two versions.
The chart below is a chart that shows many support and resistance points and draws a trend line to select the volatility period.
Therefore, since the support and resistance points may be displayed differently, it is recommended that you refer to the points or sections that I have written.
-
The conditions for starting a transaction are simpler than they look.
However, when these conditions are met, the support and resistance points drawn on the 1M, 1W, and 1D charts must be displayed.
Therefore, even if the conditions for starting a transaction are met, if the support and resistance points are not displayed at the corresponding price, you cannot start a transaction.
Please read this carefully and thank you.
-
(It would be good to see this as an example of how to find the conditions that fit you and how to utilize them.)
Conditions for starting a transaction are
1. Buying time conditions
- When the StochRSI indicator rises in the oversold range and maintains the state of StochRSI > StochRSI EMA
- When the BW indicator forms a horizontal line at the lowest point (0)
- When the OBV indicator rises below the 0 point
- When the DMI indicator rises below the 0 point
2. Selling time conditions
- When the StochRSI indicator falls in the overbought range and maintains the state of StochRSI < StochRSI EMA
- When the BW indicator forms a horizontal line at the highest point (100)
- When the OBV indicator falls above the 0 point
- When the DMI indicator falls above the 0 point
When the above conditions are met, check whether there is support at the support and resistance points drawn near the price. Confirmation is used to proceed with the transaction.
The current price position is 60672.0-61099.25.
Therefore, you can proceed with the transaction depending on whether there is support in this section.
Since it is currently falling below 60672.0, there is nothing you can do in spot trading other than cutting losses.
In futures trading, you can enter with a sell (SHORT) position.
-
It is rare for all the conditions for starting a transaction mentioned above to be met.
Therefore, it is recommended to basically check whether the BW indicator forms a horizontal line at the lowest point (0) or highest point (100), and then proceed with the transaction by checking the movement of the StochRSI indicator.
Also, it is recommended to select a split sell section to make a profit by calculating the fluctuation range while checking the strength of the rise or fall with OBV and DMI.
-
In summary of the above,
Since the StochRSI indicator has not yet risen from the oversold zone and StochRSI < StochRSI EMA, it is recommended to check whether a reversal is occurring.
Also, you should check whether the BW indicator has fallen to the lowest point (0) and formed a horizontal line.
If the OBV and DMI indicators rise below the 0 point without meeting these conditions, you should proceed with an aggressive purchase (a transaction that requires a quick response similar to scalping or day trading).
If you do not proceed with an aggressive purchase, you should wait.
-
It is not a good idea to enter a current sell (SHORT) position in futures trading.
However, if you proceed with an aggressive transaction (scalping or day trading), you can start trading.
The reason why it is not a good condition for trading is because the price is located in the 1. purchase timing condition section among the conditions for starting a transaction mentioned above.
Therefore, the profit is small or you may even suffer a loss.
-
If you are not currently trading, I think the section where you should trade is when it rises around 61K.
Before that, it is highly likely that you will not be able to purchase because it seems like it will fall further.
I think this point, or the section where you actually trade, is the psychological volume profile section.
This psychological volume profile section is the section where psychology applies that you must trade even now.
Since this point is ultimately a low or high point, it is a section where you are likely to incur losses if you purchase.
The 61K section that I mentioned earlier is a section where it is highly likely to be a low point, so it is a section where you are likely to incur losses if you cut your loss or enter a sell (SHORT) position.
-
If it shows resistance near 60672.0, there is a possibility that a sharp decline will occur momentarily and touch 59K and then rise.
This phenomenon can be a fake or a sweep movement, so you need to be careful.
In order to avoid losses from this phenomenon, auxiliary indicators are necessary.
Since auxiliary indicators are lagging, they are unlikely to show large movements in sudden price fluctuations.
-
What I am talking about is not a method of chart analysis, but an example of how to set a standard for trading.
Therefore, I hope you do not misunderstand the above as about chart analysis.
Since chart analysis and trading are different, what you see on the chart is also different.
In order to complement this difference, what is needed is the support and resistance points drawn on the 1M, 1W, and 1D charts.
Since charts without support and resistance points are likely to be for chart analysis, there is no need to try to find a trading point on these charts.
-
Have a good time.
Thank you.
--------------------------------------------------
- Big picture
It is expected that the real uptrend will start after rising above 29K.
The section expected to be touched in the next bull market is 81K-95K.
#BTCUSD 12M
1st: 44234.54
2nd: 61383.23
3rd: 89126.41
101875.70-106275.10 (overshooting)
4th: 134018.28
151166.97-157451.83 (overshooting)
5th: 178910.15
These are points where resistance is likely to be encountered in the future. We need to see if we can break through these points.
We need to see the movement when we touch this section because I think we can create a new trend in the overshooting section.
#BTCUSD 1M
If the major uptrend continues until 2025, it is expected to start by creating a pull back pattern after rising to around 57014.33.
1st: 43833.05
2nd: 32992.55
-----------------

Next Volatility Period: Around October 5th - 10th
Hello, traders.
If you "Follow", you can always get new information quickly.
Please click "Boost" as well.
Have a nice day today.
-------------------------------------
The BW indicator is currently leveling off near the midpoint (50).
Therefore, I think it is not suitable to trade around 60672.0-61099.25.
If you want to trade around 60672.0-61099.25 depending on the support, you will need a short and quick response.
-
When the BW indicator is leveling off at the lowest point (0) or highest point (100), a BW line is created on the price chart.
I think you can trade more stably by using this BW line as a support and resistance point.
Therefore, you can wait until the next BW line is created or check whether it is supported when touching the previous BW line (61759.99) and then trade.
At this time, the StochRSI indicator is also worth looking at.
Since the StochRSI indicator creates waves in any case, I think it is an indicator worth referring to when trading.
Therefore,
- If the StochRSI indicator rises in the oversold zone and maintains the state of StochRSI > StochRSI EMA, it is a time to buy,
- If the StochRSI indicator falls in the overbought zone and maintains the state of StochRSI < StochRSI EMA, it is a time to sell.
However, you should be aware that since you cannot know the size of the fluctuation range, you may see little profit or even a loss.
To prevent this, you need the support and resistance points drawn on the 1M, 1W, and 1D charts.
Based on these support and resistance points, you should proceed with the transaction depending on whether the movement mentioned above is supported or not.
Then, since you can calculate the approximate fluctuation range, it will be a reference for deciding whether to proceed with the transaction.
Accordingly, if you display the rise and fall range based on the 60672.0-61099.25 section, it will be as shown in the chart above.
-
When a new candle is created,
- Whether it will definitely enter the oversold section
- Whether there is a change in the slope of the StochRSI indicator
- Whether the StochRSI EMA falls below the midpoint (50)
You should check whether the above is satisfied and create a response strategy according to the next movement.
-
Have a good time.
Thank you.
--------------------------------------------------
- Big picture
It is expected that the full-scale uptrend will start when it rises above 29K.
The next expected range to touch is 81K-95K.
#BTCUSD 12M
1st: 44234.54
2nd: 61383.23
3rd: 89126.41
101875.70-106275.10 (overshooting)
4th: 134018.28
151166.97-157451.83 (overshooting)
5th: 178910.15
These are points that are likely to receive resistance in the future.
We need to check if these points can be broken upward.
We need to check the movement when this range is touched because it is thought that a new trend can be created in the overshooting range.
#BTCUSD 1M
If the major uptrend continues until 2025, it is expected to start forming a pull back pattern after rising to around 57014.33.
1st: 43833.05
2nd: 32992.55
-----------------

The key is whether it can be supported at 64748.70
Hello, traders.
If you "Follow", you can always get new information quickly.
Please also click "Boost".
Have a nice day today.
-------------------------------------
There is a content about the volatility period of the StochRSI indicator in the previous idea, so please refer to it.
(BTCUSDT 1D chart)
The HA-High indicator on the 1D chart is expected to be generated at the 64748.70 point.
Accordingly, the key is whether it can rise above 64748.70 and be supported.
If not, as I mentioned in the previous idea, we need to check the support in the above section
- 63118.62.64000.0
- 60672.0-61099.25
.
Since the M-Signal of the 1D chart is passing around 63118.62.64000.0, it is an important support and resistance section,
and since the M-Signal of the 1W chart is passing around 60672.0-61099.25, it is an important support and resistance section.
However, if the decline continues, the M-Signal of the 1W chart is expected to rise around 61759.99, so this area is also an important support and resistance section.
-
(1D chart)
Since the HA-High indicator of the 1D chart has been touched, if it fails to rise above the HA-High indicator, it is likely to touch the HA-Low indicator.
Therefore, as the price falls, we need to check where the HA-Low indicator is generated.
If it is not generated, it is likely to touch around the 56204.13 point.
However, as I mentioned earlier, there is an important section, so it is not expected to fall easily.
-
The volatility period is expected to be around October 5-10 (up to October 4-11).
Therefore, the point of interest is whether it will pass the 66676.87-68249.88 section or the 56150.01-56950.56 section after this volatility period.
If not, and it moves sideways, you need to check if the M-Signal of the 1D chart > M-Signal of the 1W chart can be maintained.
If the M-Signal of the 1D chart < M-Signal of the 1W chart is maintained, there is a possibility that it will converge near the M-Signal of the 1M chart.
I will explain this in detail again when there is movement.
-
(1M chart)
This is the day when a new moon candle is created.
Therefore, I will explain this after a new candle is created.
-
Have a good time.
Thank you.
--------------------------------------------------
- Big picture
It is expected that a full-scale uptrend will start when it rises above 29K.
The next expected range to touch is 81K-95K.
#BTCUSD 12M
1st: 44234.54
2nd: 61383.23
3rd: 89126.41
101875.70-106275.10 (overshooting)
4th: 134018.28
151166.97-157451.83 (overshooting)
5th: 178910.15
These are points that are likely to receive resistance in the future.
We need to check if these points can be broken upward.
We need to check the movement when this range is touched because it is thought that a new trend can be created in the overshooting range.
#BTCUSD 1M
If the major uptrend continues until 2025, it is expected to start forming a pull back pattern after rising to around 57014.33.
1st: 43833.05
2nd: 32992.55
-----------------

Before the new month beginsHello, traders.
If you "Follow", you can always get new information quickly.
Please click "Boost" as well.
Have a nice day today.
-------------------------------------
(BTCUSDT 1M chart)
There is now one day left until a new candle is created.
The current StochRSI indicator is rising below the midpoint (50).
We need to check what the StochRSI indicator will look like when a new candle is created.
I have marked three sections as important support and resistance sections on the 1M chart.
If it falls below the second section, it is likely to turn into a downtrend, and the strong support section at this time is the third section.
-
(1W chart)
The next volatility period is the week around October 7th.
So, September 30th - October 13th.
The important sections on the 1W chart are 69648.14, 65920.71, 61099.25, and the M-Signal on the 1M chart.
The StochRSI indicator has risen above the midpoint (50).
Therefore, it is necessary to check whether it will enter the overbought zone when a new candle is created.
Since the BW line is currently formed at 69648.14, it is important to check whether there is support near this point.
If it goes up a bit more, there is a possibility that a new BW line will be created, so if a new BW line is created, we need to check whether there is support near it.
-
(1D chart)
Among the volatility periods mentioned in the 1W chart, it is expected that full-blown volatility will likely occur between October 5th and 10th.
What is important to watch as this volatility period passes is whether it can fall below 56150.01 or rise above 66676.87-68249.88.
-
It is currently located near the HA-High indicator on the 1W chart.
As I mentioned in the previous idea as an update, the StochRSI EMA indicator has never touched the 100 point.
Therefore, there is a very high possibility that the StochRSI indicator will be reset somehow.
Therefore, it is an important point to watch how the StochRSI indicator is initialized.
Since it is overheated, even if it shows a slight decline, the StochRSI indicator shows a downward trend.
In this movement, buying because the price is rising will make your psychological state unstable.
Therefore, it is necessary to check whether it can be supported at the lower point of the HA-HIgh indicator box (65441.08) ~ 65920.71.
If it falls without support,
1st: 64179.08
2nd: 61099.25
You should check whether it is supported at the 1st and 2nd points above.
When the StochRSI indicator falls in the overbought zone, there are cases where it immediately shows a downward trend and cases where it does not.
Currently, it seems that volatility is likely to occur when the StochRSI indicator is located near the midpoint (50).
At this time, I think it is important to know where it is supported.
-
If it rises above 65920.71,
1st: 67614.25
2nd: 69648.14
We need to check whether it is supported near the 1st and 2nd above.
However, depending on whether the StochRSI indicator is initialized, there is a possibility that the upward trend will continue while creating a new wave, so we need to watch the situation.
-
Have a good time.
Thank you.
--------------------------------------------------
- Big picture
It is expected that a full-scale upward trend will begin when it rises above 29K.
The section expected to be touched in the next bull market is 81K-95K.
#BTCUSD 12M
1st: 44234.54
2nd: 61383.23
3rd: 89126.41
101875.70-106275.10 (overshooting)
4th: 134018.28
151166.97-157451.83 (overshooting)
5th: 178910.15
These are points where resistance is likely to occur in the future.
We need to check if these points can be broken upward.
We need to check the movement when this section is touched because I think a new trend can be created in the overshooting section.
#BTCUSD 1M
If the major uptrend continues until 2025, it is expected to start forming a pull back pattern after rising to around 57014.33.
1st: 43833.05
2nd: 32992.55
-----------------

Next Volatility Period: Around October 11Hello, traders.
If you "Follow", you can always get new information quickly.
Please click "Boost" as well.
Have a nice day today.
-------------------------------------
It is showing sideways movement around 63118.62-64000.0.
Therefore, if it breaks out of this area,
- 65920.71-67614.25 when up
- 60672.0-61099.25 when down
You should check for support around the above area.
The StochRSI EMA is almost approaching the 100 point.
Accordingly, the possibility of volatility is increasing.
As I mentioned in the previous idea, I think we can predict the future trend depending on how the initialization of this StochRSI indicator proceeds.
-
(BTCUSDT.P 1h chart)
The section that the finger is pointing to is the section that fell below the 5EMA of the 1D chart, then touched the HA-Low indicator and rose.
When it fell below the 5EMA of the 1D chart this time, we need to check whether it touches the HA-Low indicator and rises.
The M-Signal indicator of the 1D and 1W charts is passing through the 60651.2-61149.2 section, so the key is whether it is supported around this area when falling.
When rising
1st: 65922.3
2nd: 67612.8-68215.5
You need to check whether there is support near the 1st and 2nd above.
-
It is not easy to know whether it will rise or fall right now.
However, you can predict the next support or resistance section depending on how it breaks through the support and resistance points of the 1M, 1W, and 1D charts drawn on the chart.
Therefore, I think it is a good idea to trade with a response strategy for rising and falling from the current position.
For this, you need to have your own trading strategy established.
-----------------------------------------
(USDT.D 1D chart)
USDT dominance is showing a decline in an important section.
Therefore, we need to watch whether it can fall after receiving resistance near the M-Signal indicator on the 1W, 1M chart.
I think that in order for the coin market to show an upward trend, the USDT dominance must show a downward trend.
Therefore, it is expected that we will be able to know whether the coin market can start an upward trend depending on whether the USDT dominance falls below 4.97 and is maintained or shows a downward trend.
--------------------------------------
The purpose of adding DMI and OBV is to find out the strength of the trend.
The final formula was changed accordingly.
Based on the 0 point,
- If it rises above 0, it means that the upward force is strong.
- If it falls below 0, it means that the downward force is strong.
The important thing to note here is when it touches the 2 or -2 point.
At this time, you can proceed with a transaction by checking the movement of the BW indicator and StochRSI indicator.
The trading time should be conducted depending on whether there is support at the support and resistance points drawn on the chart.
It is recommended to use the movement of the indicator only as a basis for judging whether it is supported at the support and resistance points.
-
Have a good time.
Thank you.
--------------------------------------------------
- Big picture
It is expected that the real uptrend will start when it rises above 29K.
The area expected to be touched in the next bull market is 81K-95K.
#BTCUSD 12M
1st: 44234.54
2nd: 61383.23
3rd: 89126.41
101875.70-106275.10 (overshooting)
4th: 134018.28
151166.97-157451.83 (overshooting)
5th: 178910.15
These are points where resistance is likely to occur in the future.
We need to check if these points can be broken upward.
We need to check the movement when this section is touched because I think a new trend can be created in the overshooting section.
#BTCUSD 1M
If the major uptrend continues until 2025, it is expected to start forming a pull back pattern after rising to around 57014.33.
1st: 43833.05
2nd: 32992.55
-----------------

(POLS) polkastarter This one looks good. Polkastarter had a quick fit of improvement to the price the other day. The indicators of parabolic and DMI both look good and appear to signal a future continued improvement in price, at least for now.

Bitcoin ready for more Up after Halving ?Bitcoin Daily
At time of writing, we have 1 day and 18 hours till the Halving.
And what will happen then ?
On any ordinary day, I would say we are in the perfect position to move off the bottom of the range we have been in since late Febuary, even though we have only retraced -17%..
In that Time, #BTC PA reached oversold twice and maybe about to do it again on the 4 hour charts. It never reached that on the Daily chart even though it was overbought twice in the same time period.
As you can see, we now have the MACD, Signal and RSI below the Zero line and Volume input low.
This is SO READY TO PUSH HIGHER but Will it ?
PA has been dropping down the fib circle, as it did before and does seem to be finding Support at Range Low.
BUT, the DMI ( image ) tells us something else.
The ADX shows Range strength, DI - and DI + show Range direction
The ADX ( yellow) is rising while we are in a Bearish position and this is backed up by the DI - ( red) still being Higher than the DI + which seems to be ranging Low and not taking any ground above itself.
A positive take on this is that DI- is NOT rising, DI + is low and able to Rise.
In summery, #Bitcoin is waiting for its moment.
There is no weakness here. It is like a coiled Spring, ready to go when the time is right but we do still have the possibility of a further drop, maybe a Flash dip that would be bought up so quick it may surprise you
Be ready but we could stay here for a few more weeks.
Ot move on Saturday ---->

Ascending Triangle breakout for BYON...It appears as though BYON is trading in an ascending triangle.
On the KST there has been a bullish cross.
The stock is finding support at the DMI, and has broken above the 200 DMA for the second time in two years since the downtrend from ATHs.

TNY is bouncing off of DMA. Bullish Flag...TNY appears to be trading in a bullish flag and bouncing off of the DMA which is inherently bullish.
Lots of speculation around this stock becoming involved with AB-InBev due to new BOD members.
Interesting timing considering DEA re-scheduling and federal reform in America.
Speculation is speculation, but the chart is indicating an upswing.
And the company is expanding in 3 emerging markets.
One to watch.

A Renko Trading Strategy with Multiple Indicators (update 2)Repeatable patterns. Something to watch on the 25 tick / 15 minute Renko chart for CL. This first image is late January. I’ve marked some areas of interest and where we could be in the pattern and something to watch.
This is from today’s price action.
Pay close attention to the action of the indicators between the two highlighted periods of time.
