Two-phase FOMC reaction on EURUSD explained: Where next?EURUSD experienced a classic "dovish-then-hawkish" whipsaw following the Fed's 25bp cut. The Initial dovish reaction saw the fibre surge above 1.19 to multi-year highs as the dot plot showed 50bp additional cuts vs expected 25bp in 2025. However, Powell's hawkish presser reversed gains within the hour, describing the cut as "risk management" rather than an aggressive easing cycle start.
EURSD is finding support at 1.1778 (previous high), with the price having taken out the 100% Fibonacci extension from August lows. Critical support sits at 1.1740, with a break below invalidating the bullish bias.
Bullish Scenario
Targets : 1.1830, 1.1866 (critical level), then 1.2000-1.2032
Triggers : Hold above 1.1778, break above 1.1866
Rationale : ECB-Fed divergence theme intact with ECB holding, while Fed cuts
Bearish Scenario (Potential Dead Cat Bounce)
Targets : 1.1750, 1.1730
Entry : Short at 61.8% Fibonacci retracement (~1.1832)
Stop : Above 1.1878
R:R Ratio : 3.38
Where next?
ECB pause vs Fed easing supports underlying bullish EUR/USD theme despite near-term volatility. But the next FOMC meetings are more critical as Powell emphasised a "meeting-by-meeting" approach. Current pullback is likely a retracement before a potential continuation higher, but watch for rejection at the weekly trendline resistance shy of 1.20.
This content is not directed to residents of the EU or UK. Any opinions, news, research, analyses, prices or other information contained on this website is provided as general market commentary and does not constitute investment advice. ThinkMarkets will not accept liability for any loss or damage including, without limitation, to any loss of profit which may arise directly or indirectly from use of or reliance on such information.
Dollar

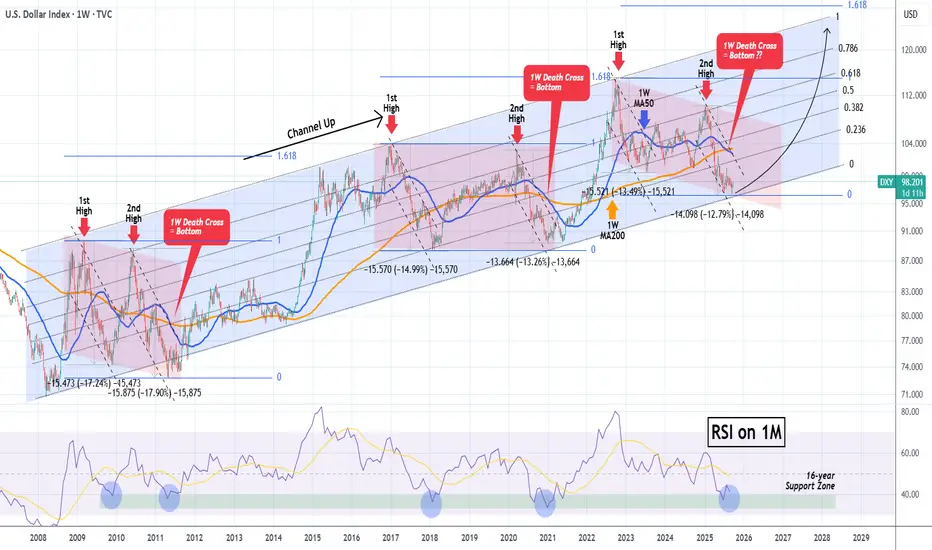
DXY Is it finally time for the Dollar to shine?The U.S. Dollar index (DXY) has been trading within a Channel Up since the March 2008 bottom during the U.S. Housing Crisis. This pattern has been showing incredible symmetry, having clear correction phases (red Channels) followed by bullish phases, where the price rallied to the 1.618 Fibonacci extension.
Right now the price has almost hit the bottom of this multi-year Channel Up, while at the same time making a new (2nd) bottom for the 2nd Bearish Leg of the (red) correction phase.
With the 1M RSI having already touched its 16-year Support Zone, which has provided the most optimal Buy Signals throughout this pattern, we expect the Dollar Index to start rising aggressively in the long-term, targeting at lest 120.000 on its way to the 1.618 Fib ext.
-------------------------------------------------------------------------------
** Please LIKE 👍, FOLLOW ✅, SHARE 🙌 and COMMENT ✍ if you enjoy this idea! Also share your ideas and charts in the comments section below! This is best way to keep it relevant, support us, keep the content here free and allow the idea to reach as many people as possible. **
-------------------------------------------------------------------------------
💸💸💸💸💸💸
👇 👇 👇 👇 👇 👇
USDJPYshort at 14863, SL 14930, TP1 14810/30, TP2 14750, as clear on D chart we are ranging approx 14650/14850, expecting W chart to start bearish on data misses, regime@fed change and cloudy eco outlook next few months, expecting stagflation to start making media rounds soon.

Gold Futures – Pullback Into H4 Supply Before Drop to Demand?Price sold off strongly from 3812 resistance and is now correcting higher. On the H4, I see a bearish supply zone between 3791.4–3769.9, which aligns with prior POC acceptance around 3790. If price pulls back into this area and fails, I expect continuation lower into the H4 demand zone at 3746.3–3735.2, which also lines up with Daily Low (DL) and Weekly High (WH) liquidity markers.
Levels to Watch:
Bearish H4 Supply: 3791.4–3769.9
Bullish H4 Demand: 3746.3–3735.2
Invalidation: Break & hold above 3795 could target 3812 liquidity.
Targets: First 3746.3, extended 3735.2.
Bias: Bearish pullback scenario into supply → downside continuation.

Macro & Technical Signals: IWM, Uranium, Dollar, Oil, ALAB, LULUIn todays video we discuss the breakdown in small caps and high beta stocks.
A macro shift could be unfolding today as we saw the dollar & oil rally all day.
Uranium & gold saw some distribution.
Financials reversed off the highs.
High Beta stocks that have rallied are softening up.
SPX has triggered a near term bearish pattern while losing the 7 day MA.

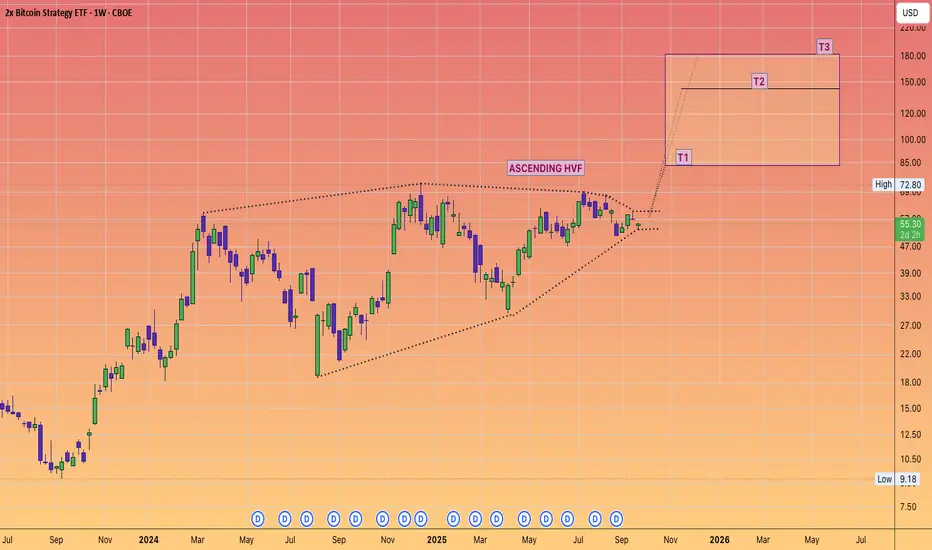
BITX to 3Xdue to it being a 2x leverage ETF
we need to respect that chart patterns can be distorted.
So when a regular Hunt Volatility Funnel usually consolidates sideways before a explosive breakout move.
A levered ETF can be distorted , so that the sideways consolidation is actually pointing UP.
Giving you a clue of where it wants to go.
I believe #Bitcoin can hit $240K
sooner than people think
roughly a 2X
So a 3X for double long #ETF is definitely achievable.
USD/JPY key levels to watchThe USD/JPY's weekly chart is the one to watch. A string of doji candles shows the market is coiling ahead of a larger move. Resistance at 148.65–150.00 remains the barrier; rejection keeps the bearish case alive with 147.00, 146.00, and 145.00 as downside levels.
By Fawad Razaqzada, market analyst with FOREX.com

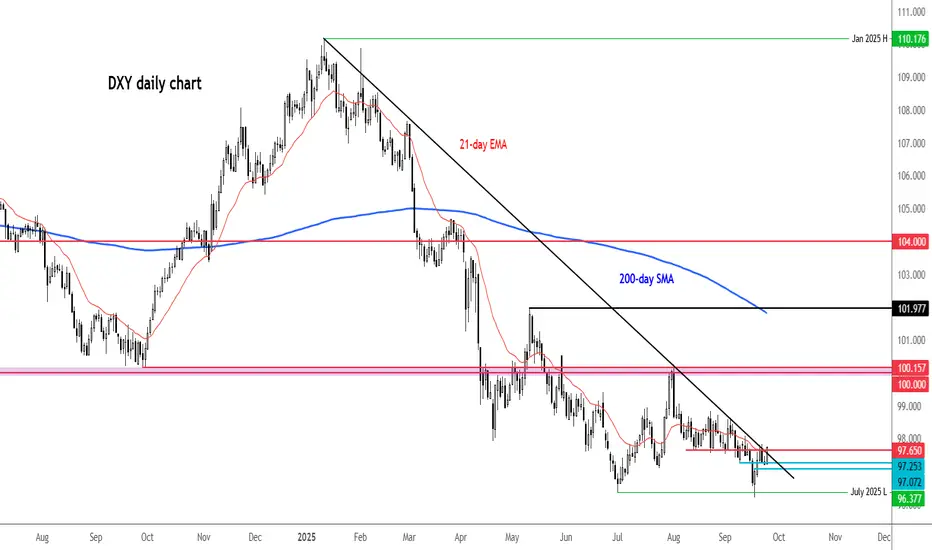
DXY testing trend resistance after Powell comments
The dollar clawed back some ground after Jerome Powell’s latest remarks, but I’m not convinced this bounce has legs. With the Fed now leaning dovish, the bias still favours more downside unless we see consistent cracks in the jobs market to justify the two cuts priced in for 2025.
Powell reiterated on Tuesday that inflation risks are skewed higher while employment risks are tilted lower, adding: “Two-sided risks mean there is no risk-free path.” Translation: he’s keeping his options open ahead of the October meeting. Fed chatter will remain front and centre, with Mary Daly up later today, jobless claims tomorrow, and the key PCE inflation reading on Friday.
The dollar index is now testing resistance around 97.60–97.80 area — a confluence of the 21-day EMA, broken support, and a trendline. Until this area breaks, it’s hard to get bullish. The broader picture of lower highs and lows still screams corrective.
By Fawad Razaqzada, market analyst with FOREX.com
EUR/USD Trend Watch – Critical Supports & ResistanceEUR/USD Update
On the low time frame, EUR/USD is moving sideways around 1.1780, holding just below the 1.1810 zone.
Key levels:
1.1810 – 1.1846 → resistance zone. A breakout and hold above would confirm bullish continuation toward 1.1922.
1.1774 → immediate support on the low time frame. Losing this level increases pressure on the main trend.
Upside scenario: If EUR/USD can reclaim 1.1810+, momentum may shift bullish, with the next target at 1.1922.
Downside risk: Failure to hold above 1.1774 opens the door for a correction toward 1.1660 and possibly 1.1568 – 1.1530 cycle support.
Cycle support: 1.1530 – 1.1568 remains the must-hold long-term zone to keep the bullish cycle alive.
📌 Summary
Above 1.1810 – 1.1846 → bullish continuation toward 1.1922.
Below 1.1774 → risk of deeper correction, watch 1.1660 next.
Cycle zone 1.1530 – 1.1568 → critical long-term support.

Looks like we might finally get some pressure released on GoldIve been looking for price to break down. it has been on a bull run for well over a week now. and all this week it has pushed up with no pullbacks at all. Looks like we might have hit the high for the week and we could be getting a pullback from here. Waiting to see if we can break the previous Daily low for more bearish pressure.

DXY Dollar Heist: Can You Escape @100?🔥 DXY Dollar Index Bank Heist Plan (Swing Trade) 🔥
Asset: DXY Dollar Index 💵Plan: Bullish 📈Thief Trading Style: Layered Limit Order Strategy 🕵️♂️
🏦 The Heist Plan 🏦
Dear Thief OG's, Ladies & Gentlemen, get ready to pull off the ultimate DXY heist! 💰 We're using the Thief Layering Strategy to stack multiple limit orders and maximize our loot. Follow the plan, adjust to your risk, and let’s escape with the cash! 🚨
📈 Entry: The Break-In
Strategy: Deploy multiple buy limit orders to layer your entries like a master thief 🕴️. Suggested levels:
98.00 💸
98.20 💸
98.40 💸
98.60 💸
Flexibility: Add more layers based on your risk appetite or market conditions 📊.
Pro Tip: Set an alert on TradingView to catch the breakout or pullback at these levels 🚨.
🛑 Stop Loss: The Escape Route
Thief SL: Set at 97.50 to protect your stash 🛡️.
Risk Management: Adjust SL based on your lot size, risk tolerance, and number of layered entries ⚖️.
Warning: Don’t get caught! This is a high-stakes heist—stick to your risk plan 🔥.
🎯 Target: The Getaway
Police Barricade: Resistance at 100.30 🚓—watch out!
Our Target: Take profits at 100.00 to escape with the loot before the market traps you 🏃♂️💨.
🧠 Why This Heist?
The DXY is showing bullish momentum based on real-time market data 📡:
Macro Factors: Strong USD demand driven by economic indicators (check COT reports, geopolitics, and intermarket analysis) 🌍.
Technical Setup: Layered entries align with swing trade pullbacks and key support zones 📉.
Scalpers 👀: Stick to quick long-side trades with trailing SL to lock in profits 💰.
⚠️ Trading Alerts: Stay Sharp!
News Releases: Avoid new trades during high-impact news to dodge volatility traps 🚫.
Position Management: Use trailing stop-loss to secure your profits and stay safe 🛡️.
💪 Boost the Heist!
Hit the Boost Button to power up our Thief Trading Style! 🚀 Every like and view strengthens our crew, helping us rob the market with precision. Let’s make money and vanish like pros! 🤑
Stay tuned for the next heist plan, Thief OG’s! 🕵️♂️🎉

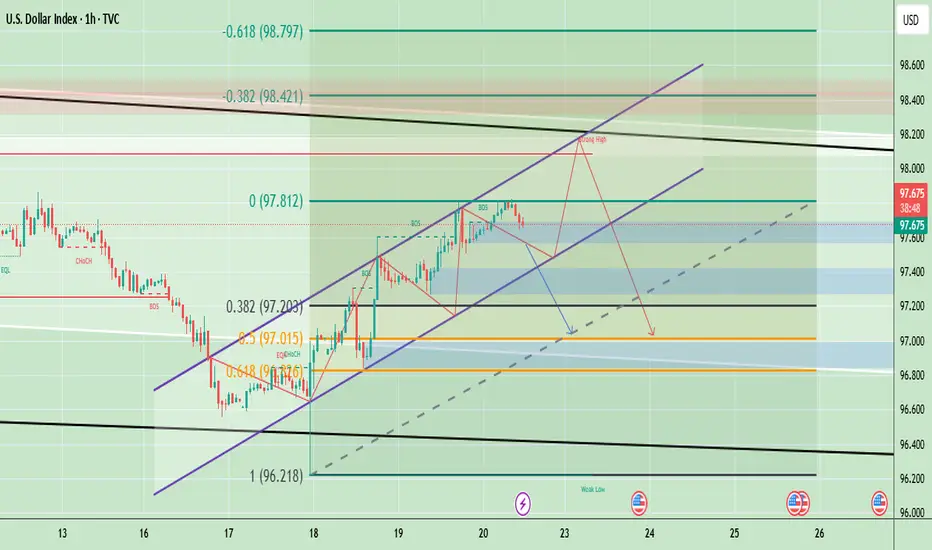
Dollar Index Resistance & Support AnalysisDXY (U.S. Dollar Index) is trading around 97.71, holding within an upward channel after bouncing from the 97.00–97.10 support zone. The structure shows a series of higher highs and higher lows, indicating short-term bullish momentum. However, the chart also highlights a potential “strong high” area near 98.20–98.40, where resistance from both Fibonacci retracement levels and channel tops converge. If DXY fails to break above this resistance, a retracement toward 97.20–97.00 is likely, with further downside risk toward 96.80 if that support breaks.
Based on the current setup, short-term upside toward 98.20–98.40 is possible, but overall bias suggests a likely pullback (downside) after testing resistance, especially if momentum weakens near the channel top.
🔴 Sell Zone (Short Setup)
- Sell Zone (Resistance area): 98.20 – 98.40
- Sell Trigger: If price tests and rejects this zone with bearish candles (reversal signals).
🟢 Buy Zone (Long Setup)
- Buy Zone (Support area): 97.20 – 97.30
- Buy Trigger: If price holds above this zone and shows bullish reversal candles (hammer, engulfing, etc.).
Note
Please risk management in trading is a Key so use your money accordingly. If you like the idea then please like and boost. Thank you and Good Luck!
Gold Futures — Extended After Bullish Surge, Watching 4 PullbackYesterday’s move pushed gold aggressively higher with almost no retrace, leaving a string of unfilled imbalances below. Price is now pressing into 3780 levels, just shy of the psychological 3800 handle.
Key Scenarios:
Bullish Continuation: If Asia/London hold above 3767, a squeeze into 3800–3810 is possible before any meaningful pullback.
Retracement Setup: A break under 3767 could trigger a retrace into 3743 → 3719 zone, aligning with prior resistance turned support.
Bigger Picture: Major 4H FVG remains untested below (around 3650–3660), which could act as a downside magnet later in the week.
Patience is key after such a vertical move — waiting to see if Tuesday gives us either continuation or that first retrace.

DOLLAR INDEX DXY WEEKLY ANALYSISDXY is trading near 97.70, attempting a rebound from the 96.90–97.00 support zone (since last week), aligned with the 0.382 Fibonacci retracement.
Prices are facing a confluence of resistance including fib level 0.786 & middle Bollinger band near 97.70 towards approaching the falling trendline resistance around 98.00–98.10, which will be a key inflection level for direction.
RSI has bounced from near-oversold (45 zone) and is pointing higher, suggesting mild bullish momentum in the short term.
On the downside, a failure to hold 97.40 (fib level 0.618) could extend weakness toward 96.90, towards the falling trendline support.
This week’s heavy US data calendar (Powell’s speech, PMIs, GDP, PCE) could provide catalysts for a breakout move.
Overall, bias is neutral-to-bullish in the short term unless 97.40 - 97.00 zone is breached decisively.

EUR/USD – Volume MapPrice is still holding a bullish lower range between 1.16595 and 1.19187.
The main volume distribution sits mid-range, and today’s action feels like absorption—market makers testing liquidity rather than chasing a breakout.
Key trigger to watch:
If sellers push into the 1.17365 volume node, it opens the door for a deeper move toward the lower end of the range.
Stay nimble; if that node holds, we could just grind sideways.
Macro side-note:
Dollar sentiment remains shaky after a 10% drop in 1H 2025 and growing chatter about fiscal risks and gold hedges.
European investors have been keeping more capital at home, which can add undercurrents of euro support even when U.S. data wobbles.
Bottom line: 1.17365 is the battleground.
Break and hold below → watch for fresh lows.
Hold and absorb → range trade continues.

Fundamental Market Analysis for September 22, 2025 GBPUSDThe latest public finance data showed that net borrowing by the public sector reached £18 billion, the highest monthly figure in five years. Economists had expected public borrowing to be significantly lower, at £12.8 billion. Analysts believe that this move threatens to exacerbate the debt burden and increase fiscal risks, which could put some pressure on the pound sterling.
On Thursday, the Bank of England voted to keep interest rates at 4.0% amid uncertain growth prospects and a weakening labor market. This decision was made after the UK central bank last cut its key interest rate by 25 basis points (bps) in August. The Bank of England reiterated that “a gradual and cautious further easing of monetary policy constraints remains appropriate.”
As for the US dollar, last week the US Federal Reserve (Fed) approved a widely expected rate cut and signaled that there would be two more cuts before the end of the year.
Traders will be focusing more on the Fed's statements later on Monday. Comments from Fed officials may provide some clues about the outlook for US interest rates.
Trading recommendation: SELL 1.3430, SL 1.3460, TP 1.3380

Gold Futures — New Week Opens Strong After Friday RallyGold closed last week bullish after sweeping liquidity below the weekly low and snapping higher into resistance. As we open into Asian session Monday, price is testing the daily high (3719).
Key Scenarios This Week:
Bullish: If buyers hold above 3719, continuation toward 3743 (weekly fair value gap high) and potentially 3767 (ATH marker) could play out.
Bearish: A failure to hold above 3719 opens the door for retracement back toward 3700 → 3685 zone (last week’s supply area).
Opening conditions look bullish, but patience is key. Waiting to see if Asia sets the tone for continuation or if NY later in the week pulls it back.

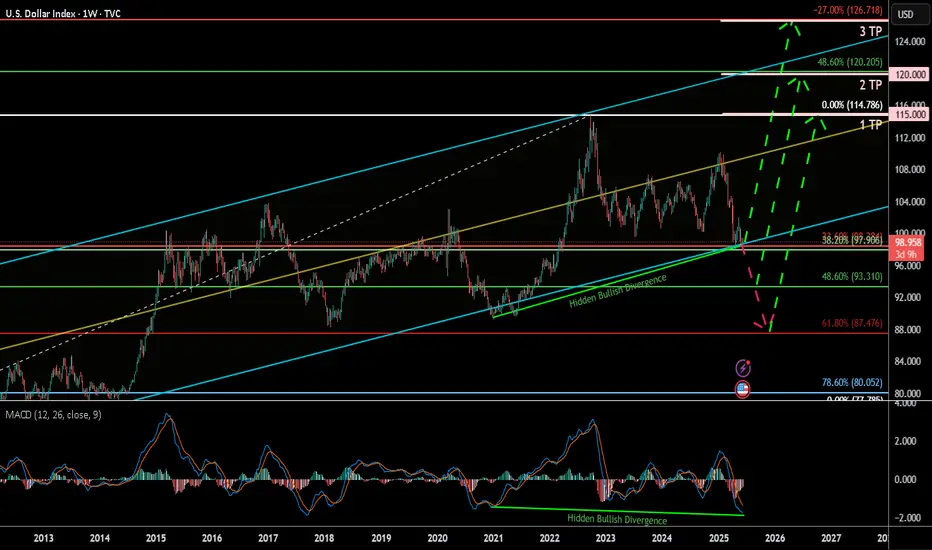
U.S. Dollar Index (DXY) Weekly 2025Summary:
The U.S. Dollar Index (DXY) has corrected down to the key 38.60% Fibonacci retracement zone and is currently showing signs of a potential bullish reversal, bolstered by a clear hidden bullish divergence on the MACD. This may signal a renewed rally toward key upside targets, especially if the 93.3–99.9 support Zone holds.
Chart Context:
Current Price: 98.864
Key Fib Support: 38.60% @ 99.906, 48.60% @ 93.310, 61.80% @ 87.476
Support Zone: 93.3–99.9 USD
Hidden Bullish Divergence: Observed both in 2021 and now again in 2025 on the MACD
Trendline Support: Long-term ascending trendline holding since 2011
Fib Extension Targets (Trend-Based):
TP1: 115.000
TP2: 120.000
TP3: 126.666
Key Technical Observations:
Fibonacci Confluence: DXY is bouncing from a strong Fib cluster between 93.310 and 99.906, historically acting as a reversal zone.
Hidden Bullish Divergence: Suggests potential upside despite price weakness.
Downtrend Retest: Price may revisit 93.3–87.4 before confirming full reversal.
Breakout Pathway: Green dashed arrows outline the likely recovery trajectory toward 114–126 range.
Indicators:
MACD: Showing hidden bullish divergence and potential signal crossover.
Trendline Support: Holding intact from 2021 low.
Fib Levels: Used for retracement and trend-based extension.
Fundamental Context:
Interest Rate Outlook: If U.S. inflation remains controlled and Fed signals future hikes or sustained high rates, DXY strength may persist.
Global Liquidity & Recession Risk: If risk aversion returns, the dollar may rise as a safe haven.
Geopolitical Risks: Conflicts, trade tensions, or BRICS dedollarization efforts may create volatility.
Our Recent research suggests the Fed may maintain higher-for-longer rates due to resilient labor markets and sticky core inflation. This supports bullish USD bias unless macro shifts rapidly.
Why DXY Could Continue Strengthening:
Robust U.S. economic performance & monetary policy divergence
U.S. GDP growth (~2.7% in 2024) outpaces developed peers (~1.7%), supporting stronger USD
The Fed maintains restrictive rates (4.25–4.50%), while the ECB pivots to easing, widening the policy and yield gap .
Inflation resilience and Fed hawkishness
Labor markets remain tight, keeping inflation “sticky” and delaying expected rate cuts; market-implied cuts for 2025 have been pushed into 2026
Fed officials (e.g. Kugler) emphasize ongoing tariff-driven inflation, suggesting rates will stay elevated.
Safe-haven and yield-seeking capital flows
With global risks, capital favors USD-denominated assets for yield and stability
Why the Dollar Might Face Headwinds
Fiscal expansion & trade uncertainty
Ballooning U.S. deficits (~$3.3 trn new debt) and erratic tariff policy undermine confidence in USD
Wall Street’s consensus bearish position.
Major banks largely expect a weaker dollar through 2025–26. However, this crowded bearish sentiment poses a risk of a sharp rebound if data surprises occur
barons
Tariff policy risks
Trump's new tariffs could dampen dollar demand—yet if perceived as fiscal stimulus, they could unexpectedly buoy the USD .
Synthesis for Our Biases
A bullish DXY thesis is well-supported by:
Economic and policy divergence (U.S. growth + Fed vs. peers).
Hawkish Fed commentary and sticky inflation.
Safe-haven capital inflows.
Conversely, risks include:
Deteriorating fiscal/trade dynamics.
Potential Fed pivot once inflation shows clear decline.
A consensus that could trigger a short squeeze or reversal if overstretched.
Philosophical / Narrative View:
The dollar remains the world’s dominant reserve currency. Periodic dips often act as strategic re-accumulation phases for institutional capital—especially during global macro uncertainty. A return toward 120+ reflects this persistent demand for USD liquidity and safety.
Bias & Strategy Implication:
1. Primary Bias: Bullish, contingent on support at 93.3–99.9 holding.
2. Risk Scenario: Breakdown below 93.3 invalidates bullish thesis and targets 87.4–80 zones.
Impact on Crypto & Gold and its Correlation and Scenarios:
Historically, DXY has had an inverse correlation to both gold and crypto markets. When DXY strengthens, liquidity tends to rotate into dollar-denominated assets and away from risk-on trades like crypto and gold. When DXY weakens, it typically acts as a tailwind for both Bitcoin and gold.
Correlation Coefficients:
DXY vs. Gold: ≈ -0.85 (strong inverse correlation)
DXY vs. TOTAL (crypto market cap): ≈ -0.72 (moderate to strong inverse correlation)
Scenario 1: DXY Rallies toward 115–126 then, Expect gold to correct or stagnate, especially if yields rise. Crypto likely to pull back or remain suppressed unless specific bullish catalysts emerge (e.g., ETF flows or tech adoption).
Scenario 2: DXY ranges between 93–105 then Gold may consolidate or form bullish continuation patterns. Then Crypto may see selective strength, particularly altcoins, if BTC.D declines.
Scenario 3: DXY falls below 93 and toward 87 Then Gold likely to rally, possibly challenging all-time highs. Crypto could enter a major bull run, led by Bitcoin and followed by altcoins, fueled by increased liquidity and lower opportunity cost of holding non-USD assets.
Understanding DXY’s direction provides valuable insight for portfolio positioning in macro-sensitive assets.
Notes & Disclaimers:
This analysis reflects a technical interpretation of the DXY index and is not financial advice. Market conditions may change based on unexpected macroeconomic events, Fed policy, or geopolitical developments.
AUD/USD - Forecast (To fall further)🇦🇺🇺🇸 AUD/USD – 8H Breakdown
AUD/USD just wrapped up that juicy Wave 3 run and topped near 0.6780. Now we’re cooling off with a corrective pullback — perfect spot to hunt buys 👀
🎯 Buy Zones
Buy Zone 1: 0.6520 – 0.6530 → first bounce area ⚡
Buy Zone 2 (Preferred): 0.6460 – 0.6480 → 71% retrace + wedge support 🏹
📈 Playbook
Let price dip into demand (ideally Buy Zone 2).
Load up → ride it back toward 0.6700.
If bulls flex, we sweep those 0.6780 highs for liquidity. 🚀
🔍 Outlook
Short-term: Expect deeper retrace into demand.
Mid-term: Bulls looking for another leg higher.
Bias : Pullback → Buy continuation 🔥

EURUSD: Support & Resistance Analysis For Next Week 🇪🇺🇺🇸
Here is my latest structure analysis:
important supports and resistances for EURUSD for next week.
Consider these structures for pullback/breakout trading.
❤️Please, support my work with like, thank you!❤️
I am part of Trade Nation's Influencer program and receive a monthly fee for using their TradingView charts in my analysis.

Fundamental Market Analysis for September 19, 2025 EURUSDThe US Department of Labor (DOL) reported on Thursday that the number of Americans filing new claims for unemployment benefits fell to 231,000 for the week ending September 13. The latest data was lower than the initial estimate of 240,000 and lower than the previous week's figure of 264,000 (revised from 263,000). Meanwhile, the number of people continuing to claim unemployment benefits fell by 7,000 to 1.920 million for the week ending September 6.
The US dollar remains strong after the Federal Reserve (Fed) announced an expected rate cut on Wednesday but did not indicate that it would rush to lower borrowing costs in the coming months.
The decline in the EUR/USD pair may be limited as the euro (EUR) could be supported by growing expectations that the European Central Bank (ECB) will end its cycle of rate cuts after the release of the latest inflation data.
ECB Vice President Luis de Guindos said the central bank should take a “very cautious” approach given the high uncertainty. Guindos added that the current rate is adequate given inflation trends and monetary policy transmission.
Trade recommendation: SELL 1.1735, SL 1.1765, TP 1.1685

Gold Futures — Bearish Momentum Building After Fed CutGold continues to show weakness after the Fed’s 25bps rate cut. Price rejected the 1H FVG overhead and is pressing down toward yesterday’s low (3660).
Key Scenarios:
Bearish Case (favored): If we break and close below yesterday’s low (D-L 3660), sellers likely push toward the weekly low (WL ~3627). That move would clean up the liquidity pool and fill the H-TF imbalance.
Bullish Case: Only if buyers defend the daily low and reclaim the 1H FVG with strength could we see price revisit 3710 (daily high).
Momentum remains on the downside, with ADX > 25 confirming trend conditions. Watching closely for the daily low sweep and possible continuation.

SHORT ON GBP/USDGU is finally ready to drop. Nice Double top at resistance zone.
Looking to catch 300-400 pips to the previous low.
