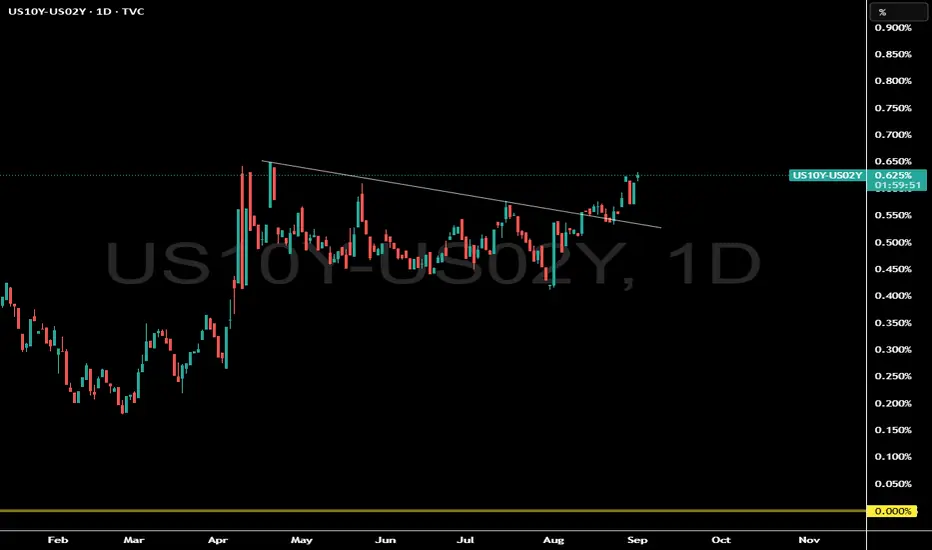
The Most Bullish Chart in the stock marketWhat does this 10 year yield and 2 year yield chart represent?
Is the bond market signaling a big economic event?
This bond market signal has a 100% success rate...but timing is the hard part since its a monthly long term signal.
Wait until we make a new pivot high in this chart...we should see some fireworks.
If you need to know what this means subscribe to our Youtube channel Where we often discuss macro economics and equites.
Dollar
DXY Forecast: H&S Continuation Pattern?The DXY rebound between July and August has shaped a head and shoulders pattern. The chart is now testing the downside breakout, with the daily RSI turning bearish and slipping below the 50 level. A clean break below the 97.50 support could extend losses toward 97.20 and 96.50, with the full head and shoulders pattern pointing to a potential move down toward the 95.00–94.50 zone.
On the upside, a rebound above the 98.00 level would suggest some bullish recovery. However, a sustained move above 100.20 is needed to confidently shift the outlook toward a longer-term bullish reversal.
Key Events This Week
• ISM PMIs: to clarify US economic activity (Tuesday–Thursday)
• US NFPs and their impact on rate cut expectations and DXY price action (Friday)
• Effects of US trade and legal developments, EU political shifts, and Middle East escalations on risk sentiment
- Razan Hilal, CMT

Fundamental Market Analysis for September 01, 2025 GBPUSDThe Bank of England's (BoE) cautious rate cut last month marks a significant divergence from the growing consensus that the Federal Reserve (Fed) will cut borrowing costs at least twice before the end of this year. This, in turn, has been a key factor in the relative strength of the British pound (GBP) against the US dollar and confirms the short-term positive outlook for the GBP/USD pair.
However, the moderate rise in the US dollar (USD) could be an obstacle for the currency pair. Traders are also showing indecision and prefer to wait for important US macroeconomic data, which will be released at the beginning of the new week, to confirm the next stage of the directional movement. Therefore, it would be wise to wait for the continuation of purchases before making new bets on the rise of the GBP/USD pair and positioning for further strengthening.
Market participants are now awaiting the release of the final UK manufacturing PMI to gain some momentum amid low liquidity due to the US Labor Day holiday. Meanwhile, attention will remain focused on the closely watched US employment data to be released on Friday. The popular non-farm payrolls (NFP) report will play a key role in influencing the US dollar's price dynamics and the movement of the GBP/USD pair.
Trading recommendation: BUY 1.3555, SL 1.3485, TP 1.3665

FTSE100 surges to records despite CPI surprise but can it last?The FTSE 100 has surged to a new all-time high, defying expectations after UK inflation surprised to the upside at 3.8%. This resilience can be attributed to renewed global interest in undervalued UK stocks, particularly defensives, as investors anticipate a potential end to the BOE’s easing cycle in 2025 due to persistent price pressures.
The market remains sensitive to global cues, with attention turning to the upcoming Jackson Hole symposium. A more hawkish tone from the Federal Reserve could reinforce risk aversion and further boost the FTSE’s appeal as a relative safe haven, while a dovish Fed may see flows return to US equities, posing a conditional risk to the FTSE’s rally.
From a technical standpoint, the FTSE 100’s recent breakout places immediate focus on the 9,367–9,400 resistance zone, which marks the upper boundary of the latest upward channel. A sustained daily close above 9,400 could open the door to further upside, targeting the psychological 9,500 level next.
On the downside, initial support is seen at 9,200, with a break below there potentially exposing the 9,050–9,000 area for a deeper pullback. Traders should watch for confirmation of direction at these levels, as volatility may increase around key macro events.
This content is not directed to residents of the EU or UK. Any opinions, news, research, analyses, prices or other information contained on this website is provided as general market commentary and does not constitute investment advice. ThinkMarkets will not accept liability for any loss or damage including, without limitation, to any loss of profit which may arise directly or indirectly from use of or reliance on such information.

Title: USDX 4H — expectations vs realityThe dollar index once again finds itself in a position where heroic posture doesn’t match reality. Price is capped at 97.85 right at the 0.382 Fibonacci level and every move higher quickly fades like a spark in the rain. If the breakout fails the road towards 97.24 and 96.90 seems far more realistic since the 0.618 retracement and demand zone are located there.
Moving averages are pressing from above, volumes don’t support the bulls and technically the setup favors weakness rather than strength.
Watching USD behavior every dip in gold silver euro and pound becomes a clear swing trading buy opportunity.
Fundamentally the dollar is also under pressure as markets expect a dovish Fed, Treasury yields stay weak and risk appetite drives capital into other assets. In the end the greenback looks more like a tired runner than a sprinter ready to race.

GBPUSD Technical Analysis & Trading Strategy Forecast# GBPUSD Technical Analysis & Trading Strategy Forecast - August 2025
Comprehensive Multi-Timeframe Analysis for Intraday and Swing Trading
Current Price: 1.35033 USD (as of August 30, 2025, 12:54 AM UTC+4)
24H Change: -0.08%
Market Sentiment: Bullish Bias with Cautious Optimism
---
Executive Summary
The GBPUSD pair is currently trading above the critical 1.3500 psychological level, showing resilience after the Bank of England's recent rate cut to 4% in August 2025. The GBP/USD pair gradually crawled back above the 1.3500 barrier on the renewed upside, indicating potential for continued upward momentum despite monetary policy headwinds.
Key Technical Levels:
Immediate Support: 1.3450 - 1.3485
Key Resistance: 1.3585 - 1.3620
Psychological Level: 1.3500 (currently above)
---
Market Context & Fundamental Backdrop
Recent Central Bank Actions
At its meeting ending on 6 August 2025, the MPC voted by a majority of 5–4 to reduce Bank Rate by 0.25 percentage points, to 4%. This dovish move has created mixed signals for GBP, with the median profile in the August MaPS implied a cumulative 50 basis point reduction in Bank Rate by the end of this year.
Interest Rate Differential Impact
UK Base Rate: 4.00% (recently cut from 4.25%)
Fed Funds Rate: 4.25-4.50% (unchanged)
Rate Differential: Narrowing in favor of USD
---
Multi-Methodology Technical Analysis
1. Candlestick Pattern Analysis
Current Formation: Doji reversal patterns observed on 4H timeframe
Pattern: Indecision candles near 1.3500 support
Implication: Potential for directional breakout
Confirmation Required: Volume increase on next significant move
2. Elliott Wave Theory Analysis
Wave Structure: Currently in Wave 4 corrective phase
Primary Trend: Bullish impulse from 1.2300 lows
Current Position: Corrective Wave 4 consolidation
Target Wave 5: Projected range 1.3650-1.3750
Invalidation Level: Break below 1.3380
3. Harmonic Pattern Recognition
Active Pattern: Bullish Gartley formation completing
D Point: Target zone 1.3480-1.3520
Fibonacci Levels: 0.786 retracement at 1.3485
Bullish Reversal Zone: 1.3450-1.3500
Target Extensions: 1.3585 (1.27), 1.3650 (1.618)
4. Wyckoff Market Cycle Analysis
Current Phase: Accumulation Phase C (Spring Test)
Background: Institutional accumulation near support
Volume Profile: Decreasing on declines, increasing on rallies
Smart Money: Likely accumulating between 1.3450-1.3520
Next Phase: Markup anticipated above 1.3585
5. W.D. Gann Analysis
Square of 9 Analysis:
Current Position: 1.35033 sits at 144° (important Gann angle)
Support Levels: 1.3472 (135°), 1.3434 (128°)
Resistance Levels: 1.3542 (152°), 1.3580 (160°)
Time Cycles: September 15-20 represents significant time window
Price Squaring: Next major target 1.3689 (169°)
Gann Angles from August Low:
- 1x1 Angle: 1.3520 (primary support)
- 2x1 Angle: 1.3485 (secondary support)
- 1x2 Angle: 1.3585 (resistance)
6. Ichimoku Kinko Hyo Analysis
Cloud Status: Price above Kumo on daily chart
Tenkan-Sen (9): 1.3515 (bullish above)
Kijun-Sen (26): 1.3498 (consolidating)
Senkou Span A: 1.3505 (cloud support)
Senkou Span B: 1.3480 (strong support)
Chikou Span: Above price action (bullish confirmation)
Signal: Bullish bias maintained while above cloud
---
Technical Indicators Analysis
Momentum Indicators
RSI (14-period):
- 4H: 52.3 (neutral, room to rise)
- Daily: 48.7 (approaching oversold relief)
- Weekly: 55.2 (bullish momentum intact)
MACD Analysis:
The Moving Average Convergence Divergence (MACD) for GBPUSD turned positive on August 27, 2025, suggesting renewed bullish momentum with the stock continued to rise in of 116 cases over the following month based on historical patterns.
Volatility & Price Action
Bollinger Bands (20, 2):
- Current Position: Middle band test (1.3515)
- Band Width: Contracting (low volatility environment)
- Squeeze Setup: Potential expansion coming
- Direction Bias: Bullish above middle band
VWAP Analysis:
- Daily VWAP: 1.3520 (key pivotal level)
- Weekly VWAP: 1.3485 (major support)
- Volume Profile: High volume node at 1.3500-1.3520
Moving Average Configuration
Short-term (Intraday):
- EMA 21: 1.3518 (immediate resistance)
- SMA 50: 1.3505 (support)
- WMA 13: 1.3525 (dynamic resistance)
Medium-term (Swing):
- EMA 50: 1.3490 (key support)
- SMA 100: 1.3465 (major support)
- EMA 200: 1.3420 (trend support)
---
Multi-Timeframe Trading Strategy
Intraday Trading Strategy (5M - 4H)
# Bullish Scenario (Primary - 65% Probability)
Entry Strategy:
Long Entry 1: 1.3485-1.3500 (Harmonic D-point)
Long Entry 2: 1.3520-1.3530 (breakout above VWAP)
Stop Loss: 1.3465 (below Wyckoff support)
Take Profit 1: 1.3585 (Gann resistance)
Take Profit 2: 1.3620 (Harmonic target)
Risk-Reward Ratio: 1:2.8 (Excellent)
Timeframe Specific Targets:
5M/15M: Quick scalps 1.3500 → 1.3530
30M/1H: Swing to 1.3585
4H: Extended move to 1.3620
# Bearish Scenario (Secondary - 35% Probability)
Entry Strategy:
Short Entry: 1.3465 break (Ichimoku cloud breach)
Stop Loss: 1.3510 (above VWAP)
Take Profit 1: 1.3420 (EMA 200)
Take Profit 2: 1.3380 (Elliott Wave invalidation)
Swing Trading Strategy (4H - Monthly)
# Primary Bullish Wave Count
Long-term Setup (1-3 weeks):
Entry Zone: 1.3480-1.3520 (current accumulation)
Stop Loss: 1.3420 (trend support)
Target 1: 1.3650 (Elliott Wave 5 minimum)
Target 2: 1.3750 (Wave 5 extension)
Target 3: 1.3850 (major resistance confluence)
Monthly Outlook:
- September: Consolidation 1.3450-1.3650
- October: Breakout attempt above 1.3650
- November: Potential test of 1.3750-1.3850
---
Risk Management & Trade Management
Position Sizing Guidelines
Intraday: Maximum 2% risk per trade
Swing: Maximum 3% risk per position
Portfolio Allocation: 5-8% maximum GBPUSD exposure
Dynamic Stop Loss Strategy
1. Initial Stop: Below key support levels
2. Breakeven: Move to entry after 50% target hit
3. Trailing Stop: Use ATR(14) x 2 for swing trades
4. Time Stop: Exit if no progress within 48 hours (intraday)
Bull Trap / Bear Trap Analysis
Potential Bull Trap Warning:
- Watch for fake breakout above 1.3585 with weak volume
- Confirmation needed: Volume > 20-day average
- Invalidation: Immediate reversal below 1.3550
Bear Trap Opportunity:
- Break below 1.3480 with quick recovery above 1.3500
- Entry on reclaim of 1.3500 with strong volume
- Target: 1.3585-1.3620
---
Weekly Trading Calendar & Key Events
Upcoming Market Movers (September 2-6, 2025)
High Impact Events:
Tuesday: UK PMI Final, GDP Monthly
Wednesday: US ADP Employment
Thursday: BoE Officials Speeches
Friday: US Non-Farm Payrolls
Trading Approach:
- Reduce position size 2 hours before high-impact news
- Consider flat positions during NFP release
- Re-enter on confirmed direction post-news
---
Alternative Scenarios & Contingency Plans
Scenario 1: Dovish BoE Surprise (20% Probability)
Trigger: Additional rate cut signals
Expected Move: 1.3500 → 1.3350
Strategy: Short on break of 1.3465, target 1.3380-1.3350
Scenario 2: USD Weakness Theme (25% Probability)
Trigger: Fed dovish pivot or data weakness
Expected Move: 1.3500 → 1.3750
Strategy: Aggressive long on any dip to 1.3480
Scenario 3: Risk-Off Environment (15% Probability)
Trigger: Geopolitical tensions or market crash
Expected Move: Sharp decline to 1.3200-1.3300
Strategy: Full hedging, await oversold bounce
---
Technical Rating Summary
Overall Rating: BULLISH BIAS
1-Week Outlook: BUY (Confirmed by MACD turn positive)
1-Month Outlook: BUY (Elliott Wave structure intact)
Confidence Level: 7/10
Key Catalysts for Bullish Breakout:
1. Sustained break above 1.3585 with volume
2. US economic data disappointment
3. Risk-on sentiment return
4. Technical pattern completion
Bearish Invalidation Levels:
Short-term: 1.3465
Medium-term: 1.3420
Long-term: 1.3380
---
Conclusion & Trading Recommendations
The GBPUSD pair presents a compelling bullish setup despite recent BoE dovishness. Our technical rating for GBPUSD stock is buy today with multiple technical methodologies aligning for potential upside. The convergence of Harmonic patterns, Elliott Wave projections, and Gann analysis suggests a high-probability move toward 1.3585-1.3650 over the coming weeks.
Priority Actions:
1. Immediate: Monitor for entry opportunities in 1.3485-1.3520 zone
2. Short-term: Prepare for breakout above 1.3585
3. Medium-term: Position for Elliott Wave 5 completion at 1.3650-1.3750
Risk Disclaimer: This analysis is for educational purposes only. Past performance does not guarantee future results. Always implement proper risk management and consider your risk tolerance before trading.

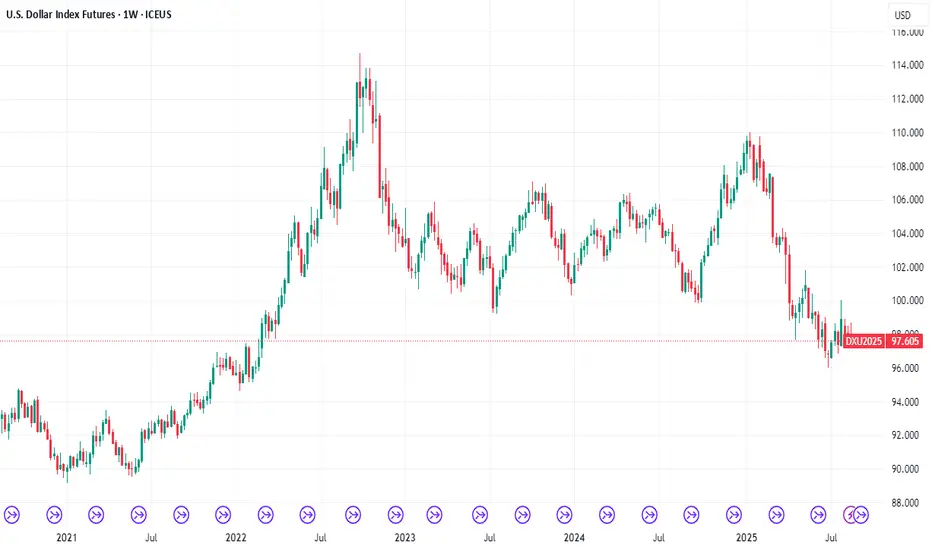
DXY Dollar Index: Technical Analysis & Trading Strategy Forecast# DXY Dollar Index: Comprehensive Technical Analysis & Trading Strategy Forecast
Asset Class: US Dollar Index (DXY)
Current Price: 97.855 (as of August 30, 2025, 12:59 AM UTC+4)
Analysis Date: August 31, 2025
Market Context: Post-correction consolidation phase with emerging bullish momentum
Executive Summary
The Dollar Index (DXY) is currently trading at 97.855, showing signs of stabilization after a significant decline from yearly highs. Our multi-dimensional technical analysis reveals a critical juncture where multiple timeframes converge, presenting both intraday scalping opportunities and swing trading setups. The analysis incorporates advanced pattern recognition, wave theory, and momentum indicators to provide actionable trading insights.
Current Market Landscape
The DXY exchange rate rose to 97.8549 on August 29, 2025, up 0.04% from the previous session, indicating short-term stabilization. However, over the past month, the United States Dollar has weakened 1.96%, and is down by 3.81% over the last 12 months. This presents a complex technical picture where short-term bullish momentum may be developing within a broader corrective phase.
The DXY Dollar Index Futures kicked off the new week with a strong bullish candle, signaling renewed upward momentum, supported by non-commercial traders reducing their bearish bets according to recent COT data.
Multi-Timeframe Technical Analysis
Elliott Wave Theory Analysis
Based on recent Elliott Wave patterns, the descent from the May 29, 2025 high is currently unfolding as a five-wave impulse Elliott Wave pattern. From this high, wave ((i)) concluded at 98.35, followed by a corrective rally in wave ((ii)). The rally formed as an expanded flat, peaking at 99.43.
Wave Count Structure:
Primary Wave: Currently in corrective Wave 4 of larger degree cycle
Intermediate Count: Completing 5-wave decline from 2025 highs
Near-term: Potential Wave 5 completion around 96.50-97.00 zone
Elliott Wave Targets:
Immediate Support: 96.80-97.00 (Wave equality zone)
Key Resistance: 99.40-99.80 (Previous Wave ((ii)) high)
Major Resistance: 101.50-102.00 (Fibonacci confluence)
Harmonic Pattern Analysis
Active Patterns:
1. Potential Bullish Bat Pattern forming on 4H-Daily timeframe
- X to A leg: 103.50 to 96.20
- A to B retracement: 38.2% at 98.98
- B to C projection: 88.6% of AB at 97.15
- Completion zone: 96.50-96.80 (88.6% XA retracement)
2. Bearish Gartley Pattern (Completed)
- Generated sell signals at 99.20-99.50 range
- Currently in profit-taking phase
Fibonacci Confluence Zones:
Strong Support: 96.50-96.80 (Multiple harmonic convergence)
Resistance Cluster: 98.80-99.20 (38.2% and 50% retracements)
Major Resistance: 101.20-101.80 (61.8% golden ratio)
Wyckoff Theory Assessment
Current Phase: Potential Accumulation Phase (Spring Test)
Distribution Phase: Completed at 2025 highs (103.50+ region)
Markdown Phase: May-August 2025 decline
Current Position: Testing Spring levels around 96.50-97.50
Wyckoff Signals:
- Volume divergence suggests smart money accumulation
- Price action showing reduced selling pressure
- Potential for markup phase if 98.50 resistance breaks
W.D. Gann Analysis
Gann Square of 9:
- Natural resistance at 98 (perfect square)
- Strong support at 96 (key Gann level)
- Next major target: 100 (psychological and Gann confluence)
Gann Time Theory:
- Current time cycle suggests reversal window: September 3-10, 2025
- Major time square due: October 2025 (90-degree angle)
- Price-Time balance suggests equilibrium around 97.50
Gann Angles:
- 1x1 angle from August lows: 97.20 (active support)
- 2x1 resistance line: 98.60
- 1x2 support angle: 96.40
Ichimoku Kinko Hyo Analysis
Current Cloud Status:
- Price below Tenkan-sen (97.95) - Short-term bearish
- Kijun-sen at 98.40 acting as dynamic resistance
- Cloud (Kumo) resistance: 99.20-99.80
- Future Cloud: Thinning, suggesting volatility ahead
Ichimoku Signals:
- TK Cross: Pending bullish crossover if price holds above 97.50
- Cloud breakout target: 99.80+
- Support levels: Kijun-sen (98.40), Tenkan-sen (97.95)
Technical Indicators Analysis
Relative Strength Index (RSI)
Daily RSI: 42.5 (Oversold but not extreme)
4H RSI: 38.2 (Approaching oversold territory)
1H RSI: 45.8 (Neutral zone)
Divergence Alert: Bullish divergence forming on 4H timeframe
Bollinger Bands (BB)
Current Position: Lower third of bands
Band Width: Contracting (low volatility environment)
Squeeze Setup: Potential breakout within 3-5 trading days
Direction Bias: Slight bullish based on band position
Volume Weighted Average Price (VWAP)
Daily VWAP: 98.12 (resistance)
Weekly VWAP: 98.85 (major resistance)
Monthly VWAP: 99.45 (significant overhead supply)
Moving Averages Confluence
SMA 20: 98.15 (immediate resistance)
EMA 50: 98.75 (intermediate resistance)
SMA 200: 100.20 (major trend line)
Current Status: Below all major MAs (bearish bias)
Candlestick Pattern Recognition
Recent Formations:
1. Doji Star (August 29) - Indecision at support
2. Hammer Pattern (August 30) - Potential reversal signal
3. Bullish Engulfing setup developing
Pattern Implications:
- Short-term reversal signals strengthening
- Volume confirmation needed for validation
- Risk-reward favors long positions with tight stops
Market Structure & Support/Resistance
Key Support Levels:
1. 97.20-97.40 - Immediate support (Gann 1x1 angle)
2. 96.80-97.00 - Major support (Harmonic completion)
3. 96.20-96.50 - Critical support (Previous reaction low)
4. 95.50-95.80 - Ultimate support (2024 major low)
Key Resistance Levels:
1. 98.15-98.40 - Immediate resistance (SMA 20 + Kijun-sen)
2. 98.80-99.20 - Intermediate resistance (Fibonacci + VWAP)
3. 99.40-99.80 - Major resistance (Elliott Wave + Cloud)
4. 101.20-101.80 - Long-term resistance (Multiple confluences)
Trading Strategy & Time Frame Analysis
Intraday Trading Strategy (5M - 4H Charts)
Bullish Scenario (Probability: 60%)
Entry Zone: 97.40-97.60 (on pullback)
Stop Loss: 97.15 (below harmonic completion)
Target 1: 98.15 (Daily SMA 20)
Target 2: 98.60 (Gann 2x1 angle)
Target 3: 99.20 (Fibonacci resistance)
Risk-Reward: 1:2.5
Bearish Scenario (Probability: 40%)
Entry Zone: 98.40-98.60 (on failed breakout)
Stop Loss: 99.00 (above key resistance)
Target 1: 97.60 (immediate support)
Target 2: 96.80 (Harmonic target)
Target 3: 96.20 (Major support)
Risk-Reward: 1:2.8
Swing Trading Strategy (4H - Monthly Charts)
Primary Long Setup:
Accumulation Zone: 96.50-97.50
Confirmation: Break above 98.80 with volume
Swing Target 1: 100.20 (SMA 200)
Swing Target 2: 102.50 (61.8% retracement)
Ultimate Target: 105.00 (2025 high retest)
Stop Loss: Below 96.20
Position Sizing: 2% risk per trade
Time Horizon: 4-8 weeks
Alternative Short Setup:
Entry Condition: Failure at 99.50 resistance
Confirmation: Break below 97.00 support
Target 1: 95.50 (2024 low)
Target 2: 93.80 (Extended projection)
Stop Loss: Above 100.00
Time Horizon: 6-10 weeks
Weekly Trading Plan (September 2-6, 2025)
Monday-Tuesday: Consolidation Expected
Range: 97.20-98.40
Strategy: Range trading, fade extremes
Key Events: Watch for volume expansion
Wednesday-Thursday: Potential Breakout
Catalyst: Economic data releases
Scenarios: Break above 98.60 (bullish) or below 97.00 (bearish)
Strategy: Breakout trading with confirmation
Friday: Trend Continuation
Focus: Weekly close positioning
Strategy: Hold winners, cut losers
Risk Management: Reduce position sizes before weekend
Risk Management Framework
Position Sizing Rules:
Intraday: Maximum 1% risk per trade
Swing: Maximum 2% risk per trade
Portfolio: Total DXY exposure not exceeding 5%
Stop Loss Guidelines:
Intraday: 25-30 pips maximum
Swing: 80-120 pips based on volatility
Time-based: Exit if no progress in 5 trading days
Profit Taking Strategy:
Scale out: 50% at first target, 30% at second, 20% runner
Trailing stops: Implement after 1:1 risk-reward achieved
Weekend rule: Close 70% of intraday positions before Friday close
Market Psychology & Sentiment
Current Sentiment Indicators:
COT Data: Non-commercial traders reducing bearish bets
Options Flow: Put-call ratio normalizing from extreme levels
Technical Sentiment: Oversold conditions with emerging reversal signals
Psychological Levels:
98.00: Round number resistance (psychological barrier)
100.00: Major psychological milestone
95.00: Critical psychological support
External Factors & Market Context
Geopolitical Considerations:
- Federal Reserve policy stance monitoring required
- Global economic data impacts (ECB, BOJ decisions)
- Geopolitical tensions affecting safe-haven demand
Economic Calendar Watch:
- NFP data (First Friday of month)
- Fed speakers and policy minutes
- Inflation data releases
- Global PMI readings
Advanced Pattern Alerts
Bull Trap Warning:
Setup: False break above 99.00 followed by immediate reversal
Confirmation: Heavy volume on break, light volume on decline
Response: Wait for 4H close below 98.20 before shorting
Bear Trap Alert:
Setup: False break below 96.80 with quick recovery
Confirmation: Immediate buying pressure and volume surge
Response: Long entry on return above 97.20 with tight stops
Technology Integration
Automated Alerts Setup:
1. Price Alerts: 96.80, 97.50, 98.60, 99.20
2. RSI Alerts: <30 (oversold), >70 (overbought)
3. Volume Alerts: 150% above 20-day average
4. Pattern Alerts: Harmonic completion, Elliott Wave targets
Trading Platform Integration:
TradingView: Custom indicator stack with all mentioned tools
MT4/MT5: Expert Advisor for automated entries
Risk Management: Position sizing calculators
Conclusion & Forecast Summary
The DXY Dollar Index stands at a critical technical juncture with multiple analytical frameworks suggesting a potential reversal from current levels. The convergence of Elliott Wave completion zones, harmonic pattern targets, and Wyckoff accumulation signals creates a compelling risk-reward setup for both intraday and swing traders.
Primary Scenario (65% probability): Consolidation between 96.80-98.60 followed by breakout to 100.20+ levels over the next 4-6 weeks.
Alternative Scenario (35% probability): Failed recovery leading to extended decline toward 95.50-94.00 zone.
Trading Bias: Cautiously bullish with defensive positioning until confirmation above 98.80 resistance cluster.
Key Success Factors:
- Strict adherence to risk management protocols
- Multiple timeframe confirmation before major position increases
- Continuous monitoring of Federal Reserve policy developments
- Adaptation to changing market structure and volatility conditions
---
*This analysis incorporates advanced technical methodologies including Elliott Wave Theory, Harmonic Patterns, Wyckoff Analysis, Gann Theory, and Ichimoku Kinko Hyo, combined with traditional indicators and market structure analysis. All price targets and support/resistance levels are derived from mathematical relationships and historical price behavior patterns.*
Risk Disclaimer: Past performance is not indicative of future results. All trading involves substantial risk of loss. This analysis is for educational purposes and should not be considered as financial advice. Traders should conduct their own analysis and consider their risk tolerance before making trading decisions.

DXY Possible sell on pullback!Back to back 3 weekly pin bar on DXY with series of lower high's putting pressure on the weekly support level. From the Monthly, it is a long term bear market, after the previous monthly pullback, price started to continue to drop which signals potential new impulse on the monthly. As the monthly close, the price is on the intraday support with potential for initial bounce. As weekly market is creating series of higher low, there is a possibility of 50% pullback and liquidity grab to potentially break the weekly support.

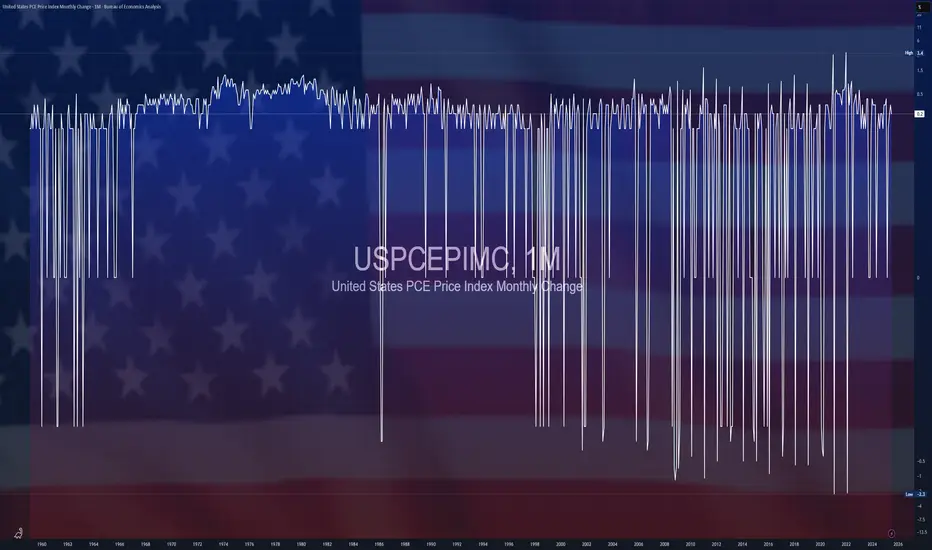
$USPCEPIMC -U.S Producer Prices Rise Slightly (July/2025)ECONOMICS:USPCEPIMC
July/2025
source: U.S. Bureau of Economic Analysis
- The core PCE price index in the US,
which excludes volatile and energy prices and is Federal Reserve's chosen gauge of underlying inflation in the US economy, went up 0.3% from the previous month in July of 2025.
It was the same as in June, in line with market expectations.
From the previous year, the index rose by 2.9%, the highest in five months.
Gold Eyes Record High BreakoutAs gold's price action continues to narrow within a 5-month consolidation, traders await confirmation of whether the formation represents an inverted head and shoulders pattern with an extended right shoulder, or a triangle consolidation—keeping markets on edge for a breakout signal.
The 3450–3500 zone stands as a critical resistance barrier. A confirmed breakout above it could lead gold prices to extend toward 3780–3800 (equal to the height of the pattern), and ultimately test the 4,000 checkpoint—the target of a long-term monthly cup and handle pattern.
On the downside, key supports lie at 3320 and 3280. A clear break below these levels could confirm a steep bearish breakout toward 3130 and 2900, which may, in turn, set the stage for long-term bullish opportunities back toward the 4,000 level.
— Razan Hilal, CMT

Fundamental Market Analysis for August 29, 2025 EURUSDEUR/USD is losing ground after three days of decline, trading around 1.1660 during Asian hours on Friday.
The EUR/USD pair is depreciating amid a recovery in the US dollar (USD) due to US economic growth in the second quarter. Annual gross domestic product (GDP) in the US grew by 3.3% in the second quarter, exceeding initial estimates of 3.1% and the previous 3.0%.
However, the US dollar may face difficulties amid renewed dovish sentiment regarding the prospects for Federal Reserve (Fed). According to Reuters, Fed member Christopher Waller said on Thursday that he would support lowering interest rates at the September meeting and further cuts over the next three to six months to prevent a collapse in the labor market.
Concerns about the Fed's independence have intensified following recent statements by US Vice President Jay D. Vance. He noted: "I don't think we should allow bureaucrats to make decisions about monetary policy and interest rates without taking into account the opinions of people who were elected to serve the American people... The US president is much better equipped to make such decisions."
Trade recommendation: BUY 1.1690, SL 1.1610, TP 1.1790

GBPUSD STRONG SIGNAL BUY SETUP LOOOOOOOOOOOOOOOOOONGWhat do you think?
we have head and shoulder
and have uptrend on high time frame reflect from real bottom after take liquidity
and the price made fake breakout
on another second shoulder the price reflect from strong support
and made engulfing candle
The price made bearish flag and is broken and retest on frame 4H which indicate an upward trend
so I expect the price will rise
what's your opinion?
Don't forget to follow me
and like . thank you

GC Midweek Outlook – Daily Imbalance Tested, H4 FVG Still in PlaPrice has now completed the move into the Daily FVG (~3425–3443) that I highlighted earlier this week. This is the critical mid-week decision point.
Bearish Case: If price rejects here, downside rotation into the untouched H4 FVG (3377–3396) remains possible before any larger move higher.
Bullish Case: If buyers defend the H1 imbalance and hold above 3412, continuation toward the Monthly High (3451) is on the table.
ADX remains under 25, suggesting no strong trending conditions yet — market is still liquidity-driven.
I’ll be watching the Daily FVG reaction and how price handles the H1 imbalance as key intraday signals.

Fundamental Market Analysis for August 26, 2025 EURUSDEUR/USD is holding onto its gains after rising more than three-quarters of a percent in the previous session, trading around 1.1630 during Asian hours on Tuesday.
President Trump posted a letter on social media Tuesday morning announcing that he was removing Fed Governor Cook from the Fed's board of directors. However, Cook said she would not resign because there was no reason for her dismissal. “I will continue to fulfill my duties,” she added.
President Trump also warned that he could impose a 200% tariff on Chinese goods if China refuses to supply magnets to the US. In addition, Trump threatened “additional tariffs” and restrictions on the export of advanced technologies and semiconductors in response to digital services taxes that have hit US technology companies.
The EUR/USD pair is strengthening as the euro (EUR) receives support after the European Central Bank (ECB) signaled a pause in monetary policy easing amid a strengthening labor market in the eurozone. Meanwhile, details of the agreement between the EU and the US indicate that a 15% tariff will be imposed on most European goods, while cars, pharmaceuticals, and semiconductors may be exempt from tougher US duties.
Trade recommendation: BUY 1.1655, SL 1.1585, TP 1.1765

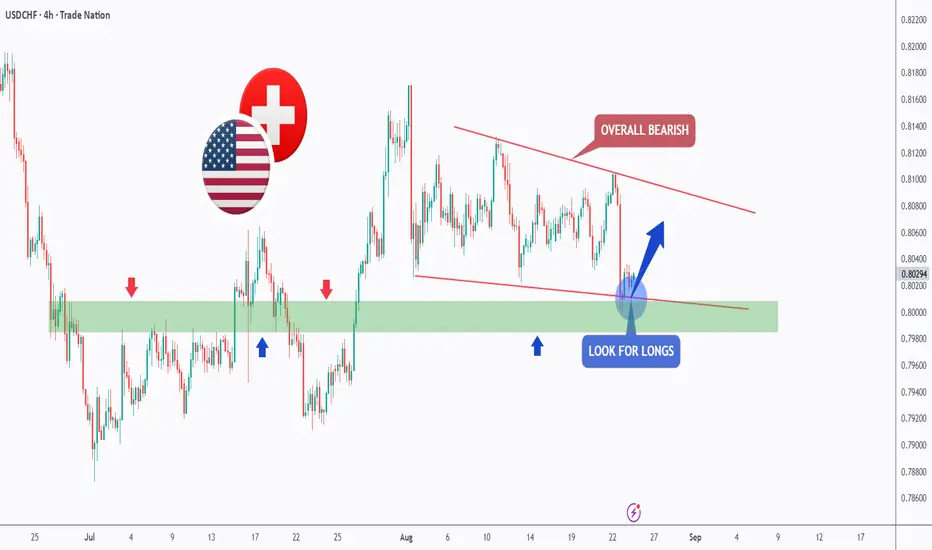
USDCHF – Bearish Channel, But Bulls Eye This Zone!USDCHF has been sliding within a falling channel 📉 , keeping the broader outlook bearish. Yet, the pair is once again testing the 🟩 demand zone, an area that has acted as a strong base in the past.
If buyers manage to hold this level 💪 , we could see a short-term rebound toward the upper bound of the channel.
For now, the plan is simple: while the macro bias stays bearish, this zone offers a potential window for trend-following longs before the sellers step back in.
⚠️ Risk management remains key, as a clean break below the zone would signal that bears 🐻 are tightening their grip.
📚 Always follow your trading plan regarding entry, risk management, and trade management.
Good luck!
All Strategies Are Good; If Managed Properly!
~Richard Nasr
Disclosure: I am part of Trade Nation's Influencer program and receive a monthly fee for using their TradingView charts in my analysis.
LONG ON USD/CADUSD/CAD is in a Major Demand Zone and has rejected it nicely.
I will be buying USD/CAD looking for price to reach the previous high for about 100 pips.

Gold Weekly Plan: Daily FVG → H4 FVGGold closed last week with a strong impulsive move into a Daily Fair Value Gap (FVG). As we open the new week, I’ll be watching closely:
Daily FVG (3423–3451): Potential resistance and rejection zone early in the week.
H4 Bullish FVG (3390–3395): If price rejects the Daily FVG, I expect a retrace into this zone to set the weekly low between Monday and Tuesday.
From there, we could see a bullish expansion for the rest of the week.
The key question: Will Gold respect the Daily FVG as resistance before rebalancing lower, or will buyers push straight through?
What’s your bias going into the week? 🚀📉

112K THE POWER RETURN OR THE END OF CYCLE? - BTC now still GREENBTC is currently at a critical point. From a cycle perspective, we are at the bottom of the cycle—a zone where major whales can decide whether to continue the cycle or bring it to an end.
When BTC just slips below 112K it does not directly end the cycle; it need also provides time frame confirmation of at least 4H+ There is high chance BTC can return from 112k zone.
If BTC holds its levels and rises above 112K with confirmation, we could the strong cycle.
If BTC breaks down further below 12K–10K, it would signal the end of the cycle that started around 84K.
At this moment BTC is still long for the cycle
Momentframe by 112K /110K = END CYCLE
Low time frame BTC = RED
High frame time BTC = RED
Cycle frame time BTC = GREEN

The Dollar's Descent: Understanding Historic WeaknessThe U.S. dollar, long considered the world's premier reserve currency and a symbol of American economic might, finds itself in unprecedented territory as it continues to hover near all-time lows against a basket of major currencies. This sustained weakness represents more than just a numerical decline on foreign exchange charts; it signals a fundamental shift in global economic dynamics, monetary policy effectiveness, and international confidence in American fiscal management. The implications of this historic depreciation extend far beyond currency traders and central banks, touching everything from household purchasing power to geopolitical relationships and the future architecture of the global financial system.
The current situation represents a culmination of multiple converging factors that have been building over several years. The dollar's decline hasn't occurred in isolation but rather as part of a complex interplay between domestic fiscal policies, international trade dynamics, shifting reserve currency preferences, and evolving global economic power structures. Understanding this phenomenon requires examining not just the immediate catalysts but also the deeper structural changes that have eroded the dollar's traditional sources of strength.
The Anatomy of the Dollar's Decline
The measurement of the dollar's value against other currencies typically relies on the U.S. Dollar Index (DXY), which tracks the greenback against a weighted basket of six major currencies: the euro, Japanese yen, British pound, Canadian dollar, Swedish krona, and Swiss franc. When analysts refer to the dollar approaching all-time lows, they're observing a sustained depreciation that has pushed this index to levels not seen in decades, with some bilateral exchange rates reaching historic extremes.
The technical aspects of this decline reveal a currency under persistent selling pressure. Foreign exchange markets, which trade over six trillion dollars daily, have witnessed consistent dollar weakness across multiple timeframes and against virtually all major and emerging market currencies. This broad-based depreciation suggests that the issue isn't merely tactical positioning by traders but reflects fundamental concerns about the dollar's intrinsic value and future trajectory.
Several immediate factors have contributed to this weakness. The Federal Reserve's monetary policy stance, particularly its approach to interest rates and quantitative easing, has played a crucial role. While other central banks have moved more aggressively to combat inflation or support their currencies, the Fed's policies have often prioritized domestic economic stability over currency strength. This divergence in monetary policy has created interest rate differentials that make holding dollars less attractive relative to other currencies offering higher yields.
The massive fiscal stimulus measures implemented in recent years have also weighed heavily on the dollar. The expansion of the federal deficit and the dramatic increase in the national debt have raised questions about the long-term sustainability of American fiscal policy. International investors, who must consider currency risk when purchasing U.S. assets, have grown increasingly concerned about the potential for future dollar depreciation as a means of reducing the real burden of this debt.
Trade dynamics have further complicated the dollar's position. The persistent U.S. trade deficit means that more dollars flow out of the country to purchase foreign goods than flow in from exports. This structural imbalance creates constant selling pressure on the dollar as these funds are converted into other currencies. Additionally, the weaponization of the dollar through sanctions and financial restrictions has prompted some nations to seek alternatives for international trade settlement, reducing demand for dollars in global commerce.
Historical Context and Precedents
To fully appreciate the significance of the dollar's current weakness, it's essential to examine historical precedents and the evolution of the dollar's role in the global economy. The Bretton Woods system, established in 1944, positioned the dollar as the world's primary reserve currency, backed by gold and serving as the anchor for international monetary stability. When this system collapsed in 1971, the dollar transitioned to a fiat currency, deriving its value from the strength of the U.S. economy and the confidence of global markets rather than gold reserves.
Throughout its modern history, the dollar has experienced several significant periods of weakness. The stagflation of the 1970s saw the dollar lose considerable value as inflation soared and economic growth stagnated. The Plaza Accord of 1985 deliberately weakened the dollar to address trade imbalances, demonstrating that currency depreciation could be a policy tool rather than merely a market outcome. The financial crisis of 2008 triggered another period of dollar weakness as the Federal Reserve implemented unprecedented monetary easing.
However, the current situation differs from these historical episodes in several important ways. Previous periods of dollar weakness often occurred within a framework where the dollar's fundamental role as the global reserve currency remained unchallenged. Today, that supremacy faces genuine competition from alternative currencies and payment systems. The rise of the euro, the internationalization of the Chinese yuan, and the emergence of digital currencies all represent potential challenges to dollar hegemony that didn't exist during previous cycles of weakness.
The geopolitical context has also shifted dramatically. During past periods of dollar weakness, the United States maintained relatively stable relationships with its major trading partners and allies. Current tensions, trade disputes, and the fragmentation of the global economy into competing blocs have created an environment where dollar alternatives are not just economically viable but politically desirable for some nations. This represents a structural change that could make the current period of weakness more persistent and potentially irreversible in some respects.
Global Economic Implications
The ramifications of the dollar's sustained weakness extend throughout the global economy, creating both opportunities and challenges for different stakeholders. For American consumers, a weaker dollar translates directly into reduced purchasing power for imported goods. Everything from electronics to clothing to automobiles becomes more expensive as the dollar's depreciation increases the cost of foreign-produced items. This imported inflation adds to domestic price pressures, potentially eroding living standards and complicating monetary policy decisions.
American businesses face a mixed picture. Exporters benefit from a competitive advantage as their goods become relatively cheaper in foreign markets, potentially boosting sales and market share. Multinational corporations with significant overseas earnings see those profits translate into more dollars when repatriated, improving their financial results. However, companies reliant on imported inputs face higher costs, and those with international supply chains must navigate increased complexity and currency risk.
The impact on financial markets has been profound and multifaceted. Equity markets have shown remarkable resilience, with some sectors benefiting from the currency tailwind to earnings. However, bond markets face challenges as foreign investors demand higher yields to compensate for currency risk, potentially increasing borrowing costs for the U.S. government and corporate issuers. Commodity markets, traditionally priced in dollars, have seen significant price increases as the weakening currency makes raw materials more expensive in dollar terms.
For emerging markets, the dollar's weakness presents both opportunities and risks. Countries with dollar-denominated debt benefit from the reduced real burden of their obligations, providing fiscal relief and potentially enabling increased domestic investment. However, those nations that have traditionally relied on dollar stability for their own monetary frameworks face uncertainty and potential instability. The shift away from dollar dependence requires careful management and potentially painful adjustments to monetary and fiscal policies.
Developed economies have responded to the dollar's weakness in various ways. The European Union has seen the euro strengthen significantly, creating challenges for European exporters but providing relief from imported inflation. Japan faces particular difficulties as yen strength threatens its export-dependent economy, prompting potential intervention in currency markets. These dynamics have strained international cooperation and raised the specter of competitive devaluations reminiscent of the 1930s.
The Reserve Currency Question
Perhaps the most significant long-term implication of the dollar's sustained weakness concerns its status as the world's primary reserve currency. This privileged position has provided the United States with what former French Finance Minister Valéry Giscard d'Estaing called an "exorbitant privilege" – the ability to borrow in its own currency, maintain persistent trade deficits, and exercise significant influence over global financial conditions.
The erosion of confidence in the dollar threatens this special status. Central banks worldwide have been gradually diversifying their reserves away from dollars, increasing holdings of gold, euros, yuan, and other assets. While the dollar still accounts for the majority of global reserves, its share has been declining steadily. This trend, if it continues, could fundamentally alter the global financial architecture and reduce American influence over international economic affairs.
The search for alternatives has accelerated in recent years. The Chinese yuan's inclusion in the International Monetary Fund's Special Drawing Rights basket marked a significant milestone in its internationalization. Digital currencies, both central bank digital currencies and cryptocurrencies, offer potential alternatives for international trade settlement and value storage. Regional payment systems and bilateral currency swap agreements have proliferated, creating pathways for trade that bypass the dollar entirely.
However, the transition away from dollar dominance faces significant obstacles. The depth and liquidity of U.S. financial markets remain unmatched, providing essential infrastructure for global finance. The rule of law, property rights protection, and regulatory framework in the United States continue to attract international investment despite currency concerns. No single alternative currency currently possesses all the attributes necessary to fully replace the dollar's multifaceted role in the global economy.
Policy Responses and Future Scenarios
Policymakers face difficult choices in responding to the dollar's weakness. Traditional approaches to currency support, such as raising interest rates or intervening in foreign exchange markets, carry significant economic costs and may prove ineffective against structural pressures. The Federal Reserve must balance its domestic mandate for price stability and full employment with the international implications of its policies, a task made more complex by the dollar's global role.
Fiscal policy presents another set of challenges and opportunities. Addressing the structural factors undermining dollar confidence would require difficult decisions about spending, taxation, and debt management. Political polarization and competing economic priorities make comprehensive fiscal reform challenging, yet the consequences of inaction could be severe. The possibility of a dollar crisis, while still remote, has moved from the realm of theoretical speculation to a risk requiring serious contingency planning.
International cooperation could play a crucial role in managing the transition to a new monetary order. Multilateral agreements on exchange rate management, similar to but more flexible than the Bretton Woods system, might provide stability during a period of adjustment. However, the current geopolitical climate makes such cooperation difficult to achieve. The fragmentation of the global economy into competing blocs may accelerate the development of alternative currency systems, further undermining the dollar's position.
Looking ahead, several scenarios could unfold. A gradual, managed decline in the dollar's dominance might allow for smooth adjustment to a multipolar currency system, with several major currencies sharing reserve status. This outcome would require careful coordination and policy discipline from major economies. Alternatively, a more chaotic transition could occur if confidence in the dollar erodes rapidly, potentially triggering financial instability and economic disruption.
The technological revolution in finance adds another dimension of uncertainty. Central bank digital currencies could reshape international monetary relations in ways that are difficult to predict. The adoption of blockchain technology and smart contracts might enable new forms of international trade settlement that don't require traditional reserve currencies. These innovations could either accelerate the dollar's decline or, if led by the United States, potentially reinforce its position through digital dominance.
Conclusion: Navigating Uncharted Waters
The dollar's hover near all-time lows represents more than a cyclical fluctuation in currency markets; it signals a potential inflection point in the global economic order. The convergence of fiscal pressures, monetary policy challenges, geopolitical tensions, and technological disruption has created conditions unlike any previously experienced in the modern era of fiat currencies. The implications extend beyond exchange rates to encompass fundamental questions about economic governance, international cooperation, and the distribution of global economic power.
For investors, businesses, and policymakers, navigating this environment requires careful consideration of both immediate risks and long-term structural changes. Hedging strategies, diversification approaches, and policy frameworks developed during periods of dollar strength may prove inadequate in a world where the greenback's supremacy can no longer be assumed. The ability to adapt to multiple possible futures, rather than betting on a single outcome, becomes essential for managing risk and capturing opportunities.
The social and political implications of the dollar's decline deserve equal attention to the economic aspects. Currency strength has long been intertwined with national prestige and political power. A sustained period of dollar weakness could reshape domestic politics, alter international alliances, and influence the trajectory of globalization itself. The psychological impact of losing reserve currency status, should it occur, would reverberate through American society in ways that extend far beyond financial markets.
As the world watches the dollar's trajectory with a mixture of concern and opportunism, the need for thoughtful analysis and measured response becomes paramount. The current situation demands neither panic nor complacency but rather a clear-eyed assessment of changing realities and proactive adaptation to new circumstances. The dollar's decline may mark the end of one era and the beginning of another, but the nature of that new era remains to be written by the collective actions of governments, markets, and societies worldwide.
The path forward will likely be characterized by increased volatility, structural adjustments, and the gradual emergence of new monetary arrangements. Whether this transition enhances global economic stability or triggers periodic crises will depend largely on the wisdom and cooperation of global leaders. The dollar's current weakness serves as both a warning and an opportunity – a signal that the old order is passing and a chance to build something better in its place. The challenge lies in managing this transition while maintaining the stability and prosperity that the dollar-based system, despite its flaws, has helped facilitate for decades.
In this context, the dollar's hover near all-time lows should be understood not as an isolated phenomenon but as part of a broader transformation of the global economy. The outcomes of this transformation remain uncertain, but its importance cannot be overstated. The decisions made in response to the dollar's weakness will shape international economic relations for generations to come, making this one of the most consequential periods in modern monetary history.
GBPUSD Bearish Setup – Rejection at Key Resistance (6H Chart)🧨 OANDA:GBPUSD Bearish Setup – Rejection at Key Resistance (6H Chart)
GBPUSD is showing signs of exhaustion near the 1.36000 resistance zone. A lower high and bearish engulfing candle suggest sellers are stepping in.
🔹 Trade Setup:
Sell Entry: 1.35050
Stop Loss: 1.36000
Take Profit 1: 1.34000
Take Profit 2: 1.33100
Take Profit 3: 1.31500
Risk-reward is favorable, especially if price breaks below 1.33500 with momentum. Watch for confirmation on lower timeframes.
📌 Scaling out at TP1/TP2 is advised. Invalidate the setup if price closes above 1.36000 with strength.
#GBPUSD #ForexTrading #PriceAction #FXSetup #BearishReversal #TradingView #TechnicalAnalysis #SwingTrade #6HChart #ForexStrategy
Psychology Always Matters:

Gold Futures | H4 FVG Fully Filled – What’s Next Into Weekly CloEarlier this week I was watching for price to pull back into the new H4 FVG after we closed above the Daily High. Price rejected from the Asian range mid and dropped cleanly into that zone, ultimately filling the H4 FVG completely.
Now on Friday, price sits right at the Weekly Low (3775.9) and the bottom of that H4 gap. This is a key decision point going into the weekly close.
📌 Scenarios I’m Watching:
✅ Bullish: If price holds this filled H4 FVG / W-L zone, we could see a re-accumulation and a push back toward 3388–3392 rejection block and possibly the Daily High (3394.6) next week.
❌ Bearish: If price fails to hold here, the next liquidity pools below are 3367.4 (D-L) and 3362.5.
📌 Key Levels:
Daily High: 3394.6
Weekly Low: 3775.9
Daily Low: 3367.4
Into Friday close, I’ll be watching whether we get acceptance above this zone (bullish continuation setup) or rejection that opens the door to new weekly lows.
👉 What do you think? Will this area hold as support, or do we see a deeper flush before the week closes?

Gold Futures | Watching Pullback into New H4 FVG for ContinuatioPrice pushed bullish after filling ~50% of the prior H4 Fair Value Gap and has now created a new H4 FVG just below. We also closed the day above yesterday’s high (3,394.1), showing strength.
📌 My Bias:
I’m looking for a pullback into the new H4 FVG (around 3,377–3,382) for potential continuation higher. This zone also lines up with the edge of value on the volume profile.
📌 Key Levels:
Daily High (D-H): 3,394.1
Weekly Low (W-L): 3,375.9
Daily Low (D-L): 3,353.3
📌 What I’m Watching:
✅ Acceptance above D-H = bullish continuation.
⚠️ Rejection back below D-H could signal a trap and return into prior value.
Will look for lower timeframe confirmation at the H4 FVG edge before considering longs.
Question for the community:
Do you see continuation higher from here, or are we at risk of a failed breakout?

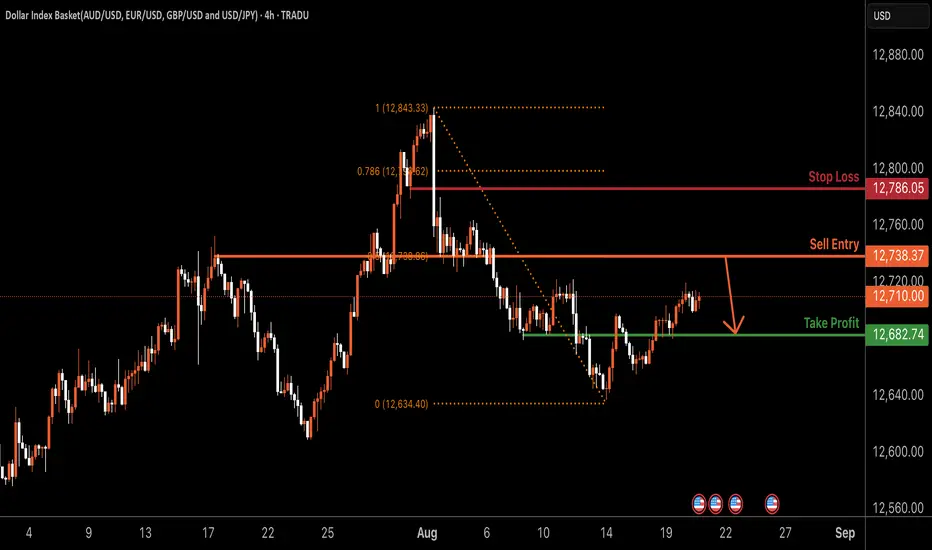
USDOLLAR H4 | Bearish reversal off 50% Fibonacci resistanceBased on the H4 chart analysis, we could see the price rise to the sell entry, which is an overlap resistance that aligns with the 50% Fibonacci retracement and could reverse from this level to the take profit.
Sell entry is at 12,738.37, which is an overlap resistance that lines up with the 50% Fibonacci retracement.
Stop loss is at 12,786.05, which is a pullback resistance that is slightly below the 78.6% Fibonacci retracement.
Take profit is at 12,682.74, which is a pullback support.
High Risk Investment Warning
Trading Forex/CFDs on margin carries a high level of risk and may not be suitable for all investors. Leverage can work against you.
Stratos Markets Limited (tradu.com ):
CFDs are complex instruments and come with a high risk of losing money rapidly due to leverage. 65% of retail investor accounts lose money when trading CFDs with this provider. You should consider whether you understand how CFDs work and whether you can afford to take the high risk of losing your money.
Stratos Europe Ltd (tradu.com ):
CFDs are complex instruments and come with a high risk of losing money rapidly due to leverage. 66% of retail investor accounts lose money when trading CFDs with this provider. You should consider whether you understand how CFDs work and whether you can afford to take the high risk of losing your money.
Stratos Global LLC (tradu.com ):
Losses can exceed deposits.
Please be advised that the information presented on TradingView is provided to Tradu (‘Company’, ‘we’) by a third-party provider (‘TFA Global Pte Ltd’). Please be reminded that you are solely responsible for the trading decisions on your account. There is a very high degree of risk involved in trading. Any information and/or content is intended entirely for research, educational and informational purposes only and does not constitute investment or consultation advice or investment strategy. The information is not tailored to the investment needs of any specific person and therefore does not involve a consideration of any of the investment objectives, financial situation or needs of any viewer that may receive it. Kindly also note that past performance is not a reliable indicator of future results. Actual results may differ materially from those anticipated in forward-looking or past performance statements. We assume no liability as to the accuracy or completeness of any of the information and/or content provided herein and the Company cannot be held responsible for any omission, mistake nor for any loss or damage including without limitation to any loss of profit which may arise from reliance on any information supplied by TFA Global Pte Ltd.
The speaker(s) is neither an employee, agent nor representative of Tradu and is therefore acting independently. The opinions given are their own, constitute general market commentary, and do not constitute the opinion or advice of Tradu or any form of personal or investment advice. Tradu neither endorses nor guarantees offerings of third-party speakers, nor is Tradu responsible for the content, veracity or opinions of third-party speakers, presenters or participants.