DOT/USD: Bounce Higher Shakes Off Dust After Mid-Term LowsOn the 20th of December, DOT/USD was near the 23.5000 mark and treading depths not seen since late August. However, in the past week of trading, DOT/USD has climbed higher and produced a solid incremental surge and is now within highs not demonstrated since early December. As of this writing, the price for DOT/USD is close to the 31.6000 level and the price of Polkadot is correlating rather politely to its major counterparts which have seen gains the past week.
Before traders decide to jump on the bandwagon based on the belief another surge higher is about to be exhibited by DOT/USD, they should make sure they keep their ambitions in check. The holiday season can produce strong volatility due to volumes being rather light and producing imbalances. This allows big trading positions in which Polkadot is being bought and sold via exchanges and cryptocurrency wallets to effect values quickly.
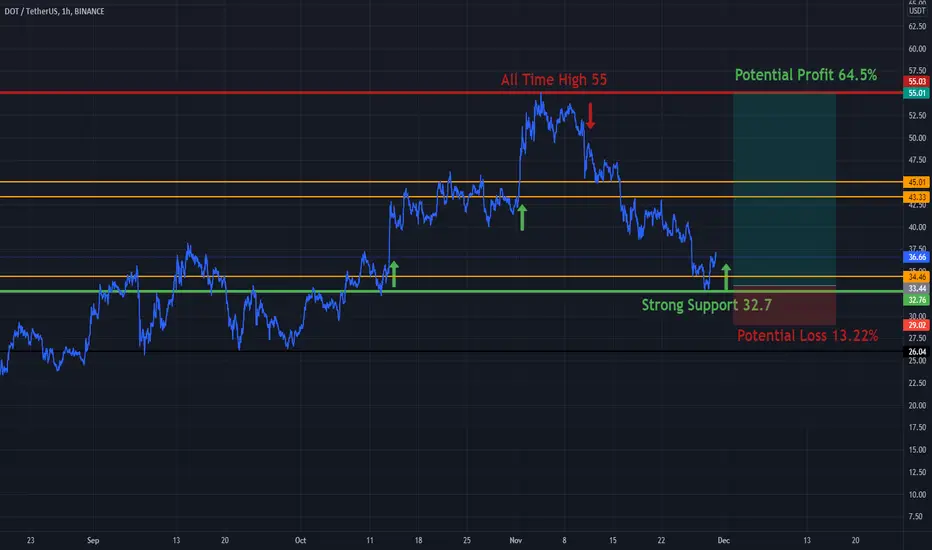
On the 4th of November, DOT/USD was trading near 55.0000 and had punctured highs made in May of 2021 with a strong demonstration of strength. However, since attaining these apex highs almost two months ago, Polkadot has struggled to find renewed buying momentum and it has gradually traversed lower, hitting rather nervous depths only one week ago. While the run upwards the past few days has been impressive and scored large percentage moves for short-term traders, the trend should be viewed cautiously.
As DOT/USD continues to bounce along the 31.5000 to 31.6500 level, traders may prove wise to wait to see if the early December values can actually be challenged. Conservative traders who are opening new positions of DOT/USD and want to wait for the next surge of momentum higher to indicate an ability to penetrate resistance levels may want to wait for the 31.9000 level to be penetrated and sustained.
Aggressive traders who feel that DOT/USD has ability to climb higher in the short term and want quick trades could look at this resistance as a take profit location. However, traders need to make sure their transaction fees allow them to look for fast trades if they are attempting to scalp pips.
Traders who are skeptical of the sudden rise of DOT/USD and want to be sellers may look at the current price realms as overbought. They should use stop loss orders correctly in case their technical analysis doesn’t meet expectations. DOT/USD is in an intriguing trading area and speculators may be attracted to the cryptocurrency if they want to make short-term wagers.
Polkadot Short-Term Outlook
Current Resistance: 31.9100
Current Support: 30.6700
High Target: 34.2500
Low Target: 28.1100
Dotusdsignals

DOT USDT SetupThis is my DOT USDT setup, DOT can go to demand area sooner or later, there are bearish divergence on weekly and daily timeframes, and the trendline has been broken, the target price is based on supply & demand and fibonacci, you don't have to open short position, if you want to buy DOT, you should wait until the price arrives to the demand area.

DOTUSDT Another Bull run!!DOTUSDT (1D Chart) Technical analysis
DOTUSDT (1D Chart) Currently trading at $38.5
Buy level :Above $36
Stop loss: Below $26
TP1: $46
TP2: $54
TP3: $75
TP4: $100
Max Leverage 2x / Spot Market
Always keep Stop loss
Follow Our Tradingview Account for More Technical Analysis Updates, | Like, Share and Comment Your thoughts.

Polkadot in the triangleQuick Update.
it's really important to understand this moves and to see where are the zones of potential breakout.
------------------------------------------------------------------------------------------------------------------------------------------------
- The next TP for DOT should be around 35$ (61.8 Fibo + Older Demand Zone) before attempting to come back to ATH.
- in a bad case if DOT not break this triangle the rebuy Zones are composed in 3 parts :
- 21.5$ ( Supported by 3X EMAs Golden Cross )
- 18.5$ ( Supported by EMA300 )
- 10$ ( Bottom again )
------------------------------------------------------------------------------------------------------------------------------------------------
- i won't tell you where to buy but some Zones are not worthy to give a try ( When too close from the Triangle Exit).
- Wait for a strong breakout or wait for a dip.
- Manage your invest and buy wisely, don't go all in on the first buy.
- Follow TheKing and his Dominance because only this influence strongly Polkadot trend.
Happy Tr4Ding

DOTUSDT , The price is in ...Hello guys
whats up ? Are you in profit or not ??
According to the chart you can see the price is it in upward trend and we are in correction wave , We shown on chart 2 zone and we expect that the price can support from there and can rise to the target
You can buy step by step in their zone
DOT is one of the most powerful project that wanna make connection between blockchain with parachain and ...
Previous analysis :
Good Luck
Abtin


POLKADOT $250 parachains are coming, everything is ready, can't wait to start the journey to the moon polkadot

DOTUSDT , We expect this kind of moveHello everybody
Acccording to our last and previous analysis , You watched the trend line is upward and in daily time frame we hadnt any signal for change trend and now we wanna be ready to move up , in daily analysis we are in support powerful zone and we expect that the price will support in here and is moving to go up and reach to last ATH
Dot is one the most powerful project that the founder of it : Dr.Gavin Wood
You know who is he ?
But becareful and dont forget to use your stop loss and attention to money management
Previous analysis :
Good Luck
Abtin

DOT two waysPolkadot is formign a bearish structure on the 4h chart, with what could even be a double top.
LONG:
If we hold the green zone I'll be looking to enter when we have a bullish structure (higher high and low) with a safe target around $60
SHORT:
If we break .382 FIB, the support zone and the 200EMA, I'll look for a retest of the .382 level for a sharp move down. Not too big of a target as the overall market sentiment remains bullish and the trend is your friend.
What do you believe is about to happen?

DOTUSD on the 1D MA50 targeting +$100Polkadot has been one of the hottest high cap cryptos since September's correction. The application of the Fibonacci Channel shows even more effectively how well it has been repeating the early 2021 rally.
As seen on this 1D chart, DOT rallied with the support of the 1D MA50 (blue trend-line) in Q1 2021. On the current sequence, the 1D MA50 has been supporting since August 01. It is therefore possible that as long as it holds, DOT will go after the 5.0 Fibonacci extension (horizontal) which is around $150. It is the firms thesis that this crypto will reach at least $100 during this run.
--------------------------------------------------------------------------------------------------------
Please like, subscribe and share your ideas and charts with the community!
--------------------------------------------------------------------------------------------------------


DOTUSDT , We are ready to go to the moon step by stepHello guys
We back with Dot
This amazing blockchain that is the future
In here according to our previous analysis the price exactly move from our buy zone and move to our target exactly , and we are in ATH and now we need some rest and pullback then we have rally to go to new target
The price can come down to 41$ but we should but in some step to have new price of buy and have nice R/r
Previous analysis :
Do it correct and go to GOD
Good Luck
Abtin

Dot- 75 is my targetAfter breaking above the last all-time high, Dot started to consolidate.
Bulls are strong and dips are clearly bought
I expect a new leg up and 75 is my target for this coin


DOTUSDT LONGHello fellow traders, if you like the idea, do not forget to support with a like and follow.
DISCLAIMER
________________
THIS IS NOT IN ANYWAY AN INVESTMENT ADVICE! DO YOUR OWN DUE DILIGENCE BEFORE TAKING ANY TRADE.

DOTUSD: Round 2After successfully destroying the sell with the team, we are looking to push the price back up into the highs and think this could be a great entry point.
I am entering this swing buy, details are below.
Trade at your own risk & discretion.
BINANCE
Pair: DOTUSDT LONG
Leverage: Cross 25x
Entry: 42.643
Targets: 46.986
SL: 41.240
1:3R

DOTUSD: Amazing Sell OpportunityDOT has really caught my attention over the last few days.
It seems like price wants to return to mitigate the sellers from the head and shoulders breakout.
Once we eliminate these sellers, liquidity will be created and we could potentially sell DOTUSD all the way down into the equal lows.
What do you think of this analysis?
Please, support this post with a like and comment!

DOT/USDTDOT on 12h view broke inverse H&S pattern/bullish with potencial 83% way up..target is approximately 66.8 for this pattern..cheers

Polkadot Update: 11% away from ATH next Target $73 @ 161.80%Polkadot Update 20/10/21: 11% away from ATH @ $49.45, the next Target $73 @ 161.80% Fibs. Happy Trading
Polkadot Update 19/10/21: Bullish Bias still holds! Please See Previous analysis below. Buy Signal from Script triggered on the 1st August: Fast EMA Crossover Slow SMA .
Confirmed reversal, Polkadot Buy Signal from Script triggered: EMA Crossover SMA just below the 23.60% fibonacci level, 43% gain from here to retest the 200 MA. Use buy zone to map your buys. Swing target from here is 160% gain from $18.92 to $49.75.
Current Price Targets: 20/10/21
127.20% Fibs @ $60.08 (35% Gain from current price level)
161.80% Fibs @ $73.59 (66% Gain from current price level)
261.80% Fubs @ $112.66 (155% Gain from current price level)
Happy Trading :)
See previous analysis below.
Polkadot (Dot) Buy opportunity! Potential 50%+ Gain to set a New ATH of $50 at the 161.8% Fibonacci Level. Dot's price soared to a high of $42 on 20/02/21. Since setting this new ATH , it has lost some momentum, retracing down to a low of $26 on the 23/02/21 after such an impulsive move, but currently it is still trading 45% above this low 4days ago on the 23/02/21.
The fundamental outlook for Dot in the long-term is great and still very much bullish , its total Market Cap is at $33.7 billion and currently ranked 6th biggest digital currency in the world after Bitcoin , Ethereum , Cardano , Binance Coin and Tether. Over the coming month we expect Dot to retest the previous ATH of $50 at the 161.8% Fibonacci extension .

DOT Ready for new ATHThe announcement of the Polkadat parachain date has created the conditions for this cryptocurrency to experience a new ATH
breaking the 46$ resistance and then 50$ and reach a new ATH in less than a week.
I think this can happen in less than couple days


DOTUSDT - Resistance Breakout!DOTUSDT (1D Chart) Technical analysis
DOTUSDT (1D Chart) Currently trading at $39
Buy level :Above $39
Stop loss: Below $31
TP1: $47
TP2: $55
TP3: $65
TP4: $80
Max Leverage 2x
Always keep Stop loss
Follow Our Tradingview Account for More Technical Analysis Updates, | Like, Share and Comment Your thoughts.
