Whats the new Target for Gold?After analysing the chart I can see that the price just found support and made double bottom After 5523 price will ShoOt again to the target (5635)...
Double Top or Bottom

NZDJPY: Bullish Trend Continuation 🇳🇿🇯🇵
NZDJPY turned strongly bullish yesterday.
The price violated the neckline of a double bottom
pattern on a 4H time frame.
The market will most likely continue rising now.
Next goal - 93.75
❤️Please, support my work with like, thank you!❤️
I am part of Trade Nation's Influencer program and receive a monthly fee for using their TradingView charts in my analysis.

Bullish Double Bottom - AUDJPYHello traders,
on Tuesday, 27 Jan, the AUDJPY reached the support line.
The price has formed a Double Bottom pattern,
and currently, the neckline is broken!
Based on this bullish structure, I expect a bullish move.
🎯 TARGET: 108.150

MOSCHIP | RSI Divergence | Buy Trade can be initiated...MOSCHIP | RSI Divergence | Buy Trade can be initiated...
**************************************************************************
Disclaimer (Please Read Carefully):
This is not investment advice. The stocks shared here are purely for educational and informational purposes. Please do your own research or consult with a financial advisor before making any investment decisions.
******************************************************************************************************************
Stock market में सिर्फ risk ही risk होता है। Market में survive करने का एक ही तरीका है, stop loss को पूरी discipline के साथ accept करना। अपनी capital को protect करने का इससे बेहतर कोई तरीका नहीं है।
मैं जो भी stock यहाँ शेयर करता हूँ, वो या तो मेरी existing holding में होता है, या फिर मैं उसी level पर fresh buying या add on करता हूँ जिसे मैं mention करता हूँ।
मैं हमेशा buy करते समय अपने system में stop loss ज़रूर लगा देता हूँ, और मेरे लिए stop loss, target से भी ज़्यादा important होता है।
Target achieve होने के बाद मैं पहले profit book करता हूँ और फिर retest या fresh breakout का इंतज़ार करता हूँ।
मैं सिर्फ breakouts पर buy करता हूँ, कभी भी support पर नहीं। और मैं resistance पर sell भी नहीं करता।
******************************************************************************************************************
The stock market involves risk, risk, and only risk. To survive in the market, accepting stop-loss with discipline and without hesitation. There is no other way to protect you capital.
Any stock I share is either already part of my existing holding or I take a fresh entry at the same level I mention. I always place the stop-loss in my system at the time of buying, and I give the highest importance to stop-loss more than the target. Once the target is achieved, I usually book profit once and then wait for either a retest or a fresh breakout.
I buy only on breakouts, never on supports. I also do not sell at resistance levels.
That is simply my trading style.

Second Test of High Could Trigger Double Top ReversalIf price revisits the previous high and fails to establish acceptance above it, this would complete the second peak of a double top structure. Historically, this pattern reflects buyer exhaustion and often precedes a reversal.
What I’m Watching:
Price reaction at the prior high
Signs of rejection (long upper wicks, bearish close, loss of momentum)
Failure to break and hold above resistance

USOIL BUY 61.60On the daily chart, USOIL formed a double bottom pattern and then stabilized after a pullback, indicating a short-term bullish trend. Currently, watch for support around 61.6; consider buying after a pullback, with an upside target around 65.0.

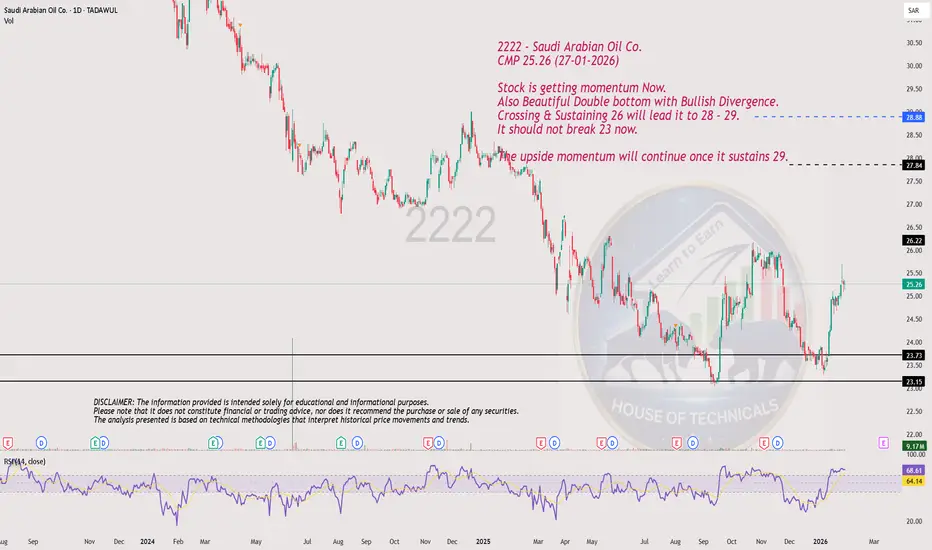
Stock is getting momentum Now.2222 - Saudi Arabian Oil Co.
CMP 25.26 (27-01-2026)
Stock is getting momentum Now.
Also Beautiful Double bottom with Bullish Divergence.
Crossing & Sustaining 26 will lead it to 28 - 29.
It should not break 23 now.
The upside momentum will continue once it sustains 29.
Double Bottom with Bullish Divergence.ALT Analysis
CMP 21.60 (27-01-2026)
Double Bottom with Bullish Divergence.
Levels are Marked!

AUDJPY Long Trade IdeaTrend: Bearish
Divergence: Bullish
Reversal Pattern: Double Bottom
Bias: Bullish
Scenario: Buy Stop at LH breakout
Trade Plan
Stop Loss: 106
Entry Level: 107.2
TP1: 108.4

BTC Next leg downI had a previous chart from early 2023 where I predicted BTC price movement based on previous cycles. (yellow bars)
In this chart I expected a double top around ~225k. We never reached that high and there have been many reasons for it over the past year especially. Sometime in 2025 when we hit our double top around ~125k I figured this was it. I adjusted the price estimation (yellow bars) down to match the new top.
The time axis was still pretty spot on. This is reinforced by the blue date range bars at the top as well. So I'd say we are getting ready for a big BTC sell off this year, heading toward mid ~30k

RGTI: The Bullish Dragon Awakens for 2026
The Bull Case:
Technical Setup: The Dragon Pattern We are witnessing a textbook Bullish Dragon formation on the Rigetti chart, signaling a major trend reversal.
The Head: Formed at the previous swing high before the initial decline.
The Feet: We have two distinct lows—the "Left Foot" followed by a higher "Right Foot." This higher low indicates that selling pressure is exhausted and buyers are stepping in earlier than before.
The Hump: The mid-pattern peak that provides our primary resistance level.
The Trigger (Tail): A breakout above the trendline connecting the "Head" and the "Hump" confirms the pattern. With the stock recently showing resilience around the $23.60–$25.00 level, a move above the hump will confirm the "Tail" extension toward targets at $35.00 and $50.00.
Fundamental Bull Case:
2026 Technology Roadmap: Rigetti is on track to deploy its 150+ qubit system by late 2026, targeting a 99.7% median two-qubit gate fidelity. This is a critical step toward their 1,000+ qubit goal in 2027.
Strong Liquidity: As of late 2025, Rigetti fortified its balance sheet with roughly $600 million in cash and equivalents, providing a substantial runway for R&D without the immediate need for dilutive financing.
Strategic Partnerships: Recent support for NVIDIA’s NVQLink platform positions Rigetti at the intersection of AI supercomputing and quantum processing, a high-growth hybrid niche for 2026.
Commercial Momentum: The company secured $5.7 million in purchase orders for its Novera systems in late 2025, with deliveries scheduled for the first half of 2026, marking a shift from pure research to commercial hardware sales.
The Verdict: The confluence of a confirmed "Dragon" reversal pattern and a well-funded 2026 roadmap makes RGTI a high-conviction play for the next phase of the quantum revolution.

XAUUSD (Gold) 1H chartThe price action is forming a Double Top / Distribution structure near a key resistance zone.
Top 1 & Top 2 are clearly marked at almost the same price level.
This shows buyers are losing momentum and sellers are defending this zone strongly.
After the first top, price corrected, then retested the same zone → classic rejection behavior.
This pattern usually signals potential trend exhaustion if resistance holds.
🔴 Resistance Zone
Major Resistance:
5,085 – 5,100
Why this zone is important:
Multiple candle rejections
Double top formation
Price struggling to close strongly above it
Psychological round-number area
👉 A strong hourly close above 5,100 would invalidate the bearish setup and open the door for continuation.
🟢 Support Levels
Support 1 (Near-term):
5,030 – 5,040
This is the neckline / pullback base and dynamic support (near EMAs).
Support 2 (Major Target Zone):
4,860 – 4,880
This aligns with the projected move of the double top and previous structure support.
📈 Bullish Scenario
If price:
Breaks and holds above 5,100
Shows strong bullish candles with volume
Then:
Upside continuation is likely
Next bullish move can extend toward 5,150 – 5,180
📌 This would mean resistance has flipped into support.
📉 Bearish Scenario (Preferred if Resistance Holds)
If price:
Fails to break 5,085–5,100
Breaks below 5,030 support
Then:
Selling pressure may accelerate
Price can move toward 4,860–4,880 (pattern target)
This aligns with the double top breakdown projection shown on the chart.
Wait for confirmation, not anticipation

AGQ projects to $405 SILVER 2X ETFYet to breakout from this W pattern.
What Is the W Pattern?
The W Pattern is a bullish harmonic pattern found on most stock charts at some point in time. Think of the letter “W” and imagine what this pattern might look like. It is characteristic of a bounce and retest of a key support area, commonly referred to as a double-bottom formation.
When this pattern forms on a chart, it usually indicates a trend reversal. Between the two bottoms, there is a level of resistance about halfway between the two tops. As a result, this is key, as it indicates a retest of the bottom support before rising higher into the newly formed uptrend.
Now you see it.
What do you think of this chart pattern and price targets?

$USAR: The Rare Earth "W"🚀
USA Rare Earth is carving out a textbook Double Bottom (W-Pattern). This isn't just a technical fluke—it’s the "markup" following a major supply-chain shift toward domestic minerals.
Trend Shift: USAR crossed above its 50-day moving average on January 5, 2026—a signal that has a 90% historical success rate for short-term gains.
National Security Play: A recent grant from the U.S. Dept of Defense for samarium metal production is the fundamental fuel for this technical breakout.
The Target: Analysts have an average 12-month target of $22.75 (approx. 28% upside), with some bulls aiming as high as $40.00.
The Risk (Keep it Real)
High Volatility: This stock has a daily volatility average of over 12%. Use a tight stop-loss near $17.04 if you are trading the immediate breakout.
China's Move: Keep an eye on Chinese export restrictions on "heavy rare earths," as they can cause sudden price spikes or supply delays.
The Game Plan
A high-volume close above $18.45 confirms the "W" is complete. If that happens, the technical projection points toward a "mark-up" to the mid-$30s.
#USAR #RareEarth #DoubleBottom #TechnicalAnalysis #WPattern

Poss Bearish Megaphone Bearish
Price at top of megaphone
NZ index possible double top atm
Possible target met on the long term multi year ascending triangle too

Why $BLACKWHALE Stands Out in the Solana Memecoin MarketThe Solana memecoin market cap landscape has changed rapidly since December. Most speculative tokens saw sharp drops after early hype faded. Liquidity drained quickly across many projects as traders rotated capital or exited entirely. Amid this volatility, CRYPTOCAP:BLACKWHALE delivered a rare and consistent performance.
Since Christmas, CRYPTOCAP:BLACKWHALE has defended a one million dollar market cap floor. That achievement places it among a very small group of Solana-based memecoins. While others dipped below key psychological levels, this token maintained steady valuation support. Traders now view that floor as more than a temporary coincidence.
Market participants increasingly value stability in speculative assets. The Solana memecoin market cap often swings wildly within days. CRYPTOCAP:BLACKWHALE disrupted that pattern by showing sustained buyer interest. This performance signals stronger conviction rather than short-lived momentum.
How CRYPTOCAP:BLACKWHALE Maintained a Million Dollar Floor
Sustaining a market cap requires more than hype. CRYPTOCAP:BLACKWHALE benefited from consistent liquidity inflows across trading sessions. Buyers stepped in during pullbacks instead of waiting for deeper discounts. That behavior reduced panic selling and strengthened overall price structure.
Memecoin liquidity strength played a critical role in this stability. Healthy liquidity prevents sharp drops during sudden sell pressure. CRYPTOCAP:BLACKWHALE avoided the thin order books that often collapse new tokens. This allowed price discovery to remain orderly and predictable.
Community engagement also supported the price floor. Holders showed patience instead of chasing short-term exits. Many wallets held positions through market dips. That collective discipline reinforced the Solana memecoin market cap over time.
Why Solana’s Ecosystem Amplified This Performance
Solana offers speed, low fees, and deep on chain liquidity. These traits attract active traders and meme-focused communities. However, most projects fail to convert activity into long-term value. CRYPTOCAP:BLACKWHALE leveraged Solana’s strengths without relying solely on hype cycles.
The Solana memecoin trend now favors tokens with visible staying power. Traders prefer projects that survive multiple market rotations. CRYPTOCAP:BLACKWHALE gained credibility by holding its valuation through broader weakness. This positioned it differently from short-lived meme launches.
Solana’s fast settlement also encouraged repeat trading. Users entered and exited positions efficiently without high costs. That efficiency increased volume consistency. Stable volume helped protect the Solana memecoin market cap from sudden breakdowns.
What On-Chain Signals Reveal About Holder Behavior
On-chain data suggests balanced wallet distribution. No single entity dominates supply movements. This reduces manipulation risk and sudden dumps. Many memecoins fail because a few wallets control liquidity.
Memecoin liquidity strength improves when ownership spreads organically. CRYPTOCAP:BLACKWHALE showed signs of gradual decentralization. Smaller holders continued accumulating rather than flipping quickly. This pattern reinforced long-term confidence.
Transaction activity remained steady even during slower market periods. That consistency signals organic interest rather than artificial volume. The Solana memecoin market cap benefited from this sustained participation.
What This Means for the Broader Memecoin Market
This case highlights a shift in trader priorities. Memecoins no longer succeed on hype alone. Liquidity management and holder behavior now matter more. Projects must prove durability through multiple cycles.
CRYPTOCAP:BLACKWHALE offers a blueprint for survival in crowded markets. It shows how memecoin liquidity strength supports long-term valuation. It also demonstrates how community discipline influences outcomes.
As Solana attracts new launches, competition will intensify. Only a few tokens will maintain meaningful market cap floors. The Solana memecoin market cap story of CRYPTOCAP:BLACKWHALE sets a new benchmark.

GBPUSD/anaylsisGBPUSD (M30)
Price shows bullish structure after a clear break and displacement. Current expectation is a pullback into the marked demand zone, followed by continuation toward the weak high. Bias remains valid while price holds above demand.
Wait for confirmation and manage risk accordingly

ROOT: double-top short / shortable bounce set-up Stock's fundamentals, price relative strength, and group action look strong.
But the uptrend structure may have formed a mid-term top.
Weekly:
Downside potential remains as long as the price stays below the May 8th highs.
Ideal macro support zone: 90–70.
Daily:
Thank you for your attention and I wish you successful trading decisions!

A Devastating Double BottomThose who follow me know I love looking ahead to spot opportunities that are coming.
The AI revolution will create many losers and a few winners.
Some winning companies were obvious from the start, like Palantir in software and the entire chain of hardware manufacturers and infrastructure providers.
In my opinion, there’s now another sector about to surprise us… BIOTECH.
The ability to analyze millions (or billions) of molecular combinations will give an incredible boost to the search for new drugs and compounds.
AI is revolutionizing biotech in three key areas:
- accelerated drug discovery,
- protein modeling and predictive analysis,
- large-scale biological dataset analysis.
I’ve selected one of the most promising companies (more will follow).
The price has formed a double bottom, and the massive increase in volume confirms we’re at the bottom.
The POC around $4.90 is the first point of interest, located near the resistance area highlighted by the orange rectangle.
Breaking the neckline at $7 would push the price to retest the previous high around $12.

DEEPAKNTR | Buy above 1627 | Strict SL below 1500 | Target 2020DEEPAKNTR | Buy above 1627 | Strict SL below 1500 | Target 2020
**************************************************************************
Disclaimer (Please Read Carefully):
This is not investment advice. The stocks shared here are purely for educational and informational purposes. Please do your own research or consult with a financial advisor before making any investment decisions.
******************************************************************************************************************
Stock market में सिर्फ risk ही risk होता है। Market में survive करने का एक ही तरीका है, stop loss को पूरी discipline के साथ accept करना। अपनी capital को protect करने का इससे बेहतर कोई तरीका नहीं है।
मैं जो भी stock यहाँ शेयर करता हूँ, वो या तो मेरी existing holding में होता है, या फिर मैं उसी level पर fresh buying या add on करता हूँ जिसे मैं mention करता हूँ।
मैं हमेशा buy करते समय अपने system में stop loss ज़रूर लगा देता हूँ, और मेरे लिए stop loss, target से भी ज़्यादा important होता है।
Target achieve होने के बाद मैं पहले profit book करता हूँ और फिर retest या fresh breakout का इंतज़ार करता हूँ।
मैं सिर्फ breakouts पर buy करता हूँ, कभी भी support पर नहीं। और मैं resistance पर sell भी नहीं करता।
******************************************************************************************************************
The stock market involves risk, risk, and only risk. To survive in the market, accepting stop-loss with discipline and without hesitation. There is no other way to protect you capital.
Any stock I share is either already part of my existing holding or I take a fresh entry at the same level I mention. I always place the stop-loss in my system at the time of buying, and I give the highest importance to stop-loss more than the target. Once the target is achieved, I usually book profit once and then wait for either a retest or a fresh breakout.
I buy only on breakouts, never on supports. I also do not sell at resistance levels.
That is simply my trading style.

APOLLO | Buy @LTP | Strict SL below 215 | Target 340APOLLO | Buy @LTP | Strict SL below 215 | Target 340
**************************************************************************
Disclaimer (Please Read Carefully):
This is not investment advice. The stocks shared here are purely for educational and informational purposes. Please do your own research or consult with a financial advisor before making any investment decisions.
******************************************************************************************************************
Stock market में सिर्फ risk ही risk होता है। Market में survive करने का एक ही तरीका है, stop loss को पूरी discipline के साथ accept करना। अपनी capital को protect करने का इससे बेहतर कोई तरीका नहीं है।
मैं जो भी stock यहाँ शेयर करता हूँ, वो या तो मेरी existing holding में होता है, या फिर मैं उसी level पर fresh buying या add on करता हूँ जिसे मैं mention करता हूँ।
मैं हमेशा buy करते समय अपने system में stop loss ज़रूर लगा देता हूँ, और मेरे लिए stop loss, target से भी ज़्यादा important होता है।
Target achieve होने के बाद मैं पहले profit book करता हूँ और फिर retest या fresh breakout का इंतज़ार करता हूँ।
मैं सिर्फ breakouts पर buy करता हूँ, कभी भी support पर नहीं। और मैं resistance पर sell भी नहीं करता।
******************************************************************************************************************
The stock market involves risk, risk, and only risk. To survive in the market, accepting stop-loss with discipline and without hesitation. There is no other way to protect you capital.
Any stock I share is either already part of my existing holding or I take a fresh entry at the same level I mention. I always place the stop-loss in my system at the time of buying, and I give the highest importance to stop-loss more than the target. Once the target is achieved, I usually book profit once and then wait for either a retest or a fresh breakout.
I buy only on breakouts, never on supports. I also do not sell at resistance levels.
That is simply my trading style.

FINCABLES | Buy @LTP | Strict SL below 680 | 1st Target 885, 980FINCABLES | Buy @LTP | Strict SL below 680 | 1st Target 885, 980
**************************************************************************
Disclaimer (Please Read Carefully):
This is not investment advice. The stocks shared here are purely for educational and informational purposes. Please do your own research or consult with a financial advisor before making any investment decisions.
******************************************************************************************************************
Stock market में सिर्फ risk ही risk होता है। Market में survive करने का एक ही तरीका है, stop loss को पूरी discipline के साथ accept करना। अपनी capital को protect करने का इससे बेहतर कोई तरीका नहीं है।
मैं जो भी stock यहाँ शेयर करता हूँ, वो या तो मेरी existing holding में होता है, या फिर मैं उसी level पर fresh buying या add on करता हूँ जिसे मैं mention करता हूँ।
मैं हमेशा buy करते समय अपने system में stop loss ज़रूर लगा देता हूँ, और मेरे लिए stop loss, target से भी ज़्यादा important होता है।
Target achieve होने के बाद मैं पहले profit book करता हूँ और फिर retest या fresh breakout का इंतज़ार करता हूँ।
मैं सिर्फ breakouts पर buy करता हूँ, कभी भी support पर नहीं। और मैं resistance पर sell भी नहीं करता।
******************************************************************************************************************
The stock market involves risk, risk, and only risk. To survive in the market, accepting stop-loss with discipline and without hesitation. There is no other way to protect you capital.
Any stock I share is either already part of my existing holding or I take a fresh entry at the same level I mention. I always place the stop-loss in my system at the time of buying, and I give the highest importance to stop-loss more than the target. Once the target is achieved, I usually book profit once and then wait for either a retest or a fresh breakout.
I buy only on breakouts, never on supports. I also do not sell at resistance levels.
That is simply my trading style.

MICROSOFT Hit a WALL. DOUBLE TOPPED and WILL DROPPrice action has confirmed and triggered a double top pattern.
Calling tops in tech is dangerous as we all know.
But as Tech fatigue hits, and selloffs quicken, the risk of a deeper shakeout increases.
Remember US stock market is 230% of GDP.
With increasing Job Losses.
