Going Long On GoldI’ve taken a buy position at this level because the market has recently broken into a brand new all-time high, confirming strong bullish momentum. Price action shows that buyers are firmly in control, and sentiment across the market is heavily tilted to the upside as more participants are jumping in.
I’m entering from this specific price level because the previous day’s New York session low has been swept, creating a double-bottom structure a clear sign of liquidity being taken out before continuation.
On the 5-minute timeframe, this double bottom confirms a potential liquidity grab and bullish reversal zone, giving a high probability setup for the continuation of the uptrend.
Overall, I’m anticipating that price will continue its bullish run with strong momentum following this liquidity sweep and structure confirmation.
Double Top or Bottom

USDJPY 4H – Reaching Psychological Correction Zone FX:USDJPY
Structure | Trend | Key Reaction Zones
Market surged with a parabolic bullish leg, now testing a major correction area (152.900–153.000).
Gap previously filled, price extended impulsively toward the psychological resistance zone.
Watching the decision area near 152.500 for possible retracement or continuation.
Market Overview
USDJPY has been on an aggressive bullish streak, pushing into a key resistance zone near 153.00 — a historically sensitive level where previous reversals occurred. While the dollar strength continues, exhaustion signs may appear as liquidity builds near the highs. A short-term pullback to 151.500–151.000 could set the stage for the next directional move.
Key Scenarios
✅ Bullish Case 🚀 → Break & close above 153.00 → 🎯 Target 154.200 → 🎯 Target 155.000
❌ Bearish Case 📉 → Rejection from 153.00 → 🎯 Target 151.500 → 🎯 Target 150.200
Current Levels to Watch
Resistance 🔴: 153.000 / 154.200
Support 🟢: 151.500 / 150.200
⚠️ Disclaimer: This analysis is for educational purposes only. Not financial advice.

ITI LTD:Likely Double bottom Break outITI LTD : Trading after a reasonable consolidation at 356 is likely to give a break out .
In weekly chart it has formed a double bottom pattern suggesting a break out after consolidation. Trading above all its EMAs 20/50/100/200 also strengthens the view.
Neckline resistance stands at 360 and in the event of a neckline break out suggests a strong move into 400+ territory.(For educational purpose only)


UDJPY potential retracementUSDJPY potential retracement.
Approaching an H4 supply zone.
H4 RSI overbought >77
Formation of H1 reversal pattern.
TP near H1 Flip zone.
Decent RR
Enter at break of the neckline. Safer entry is break/retest/continuation.

BTC; Aiming For A New (ATH) At $140k ?Bitcoin is set to break this resistance level and scale toward $140k before the year end. it have been moving within this momentum region of $109k-$123k for this couple of weeks, which we experienced a new ATH at $126k this week.
However according this structure our SMA 80 and SMA 200 the chances of this new ATH clearly high, also the "uptober" psychology actually nails the current market movement.
My fellow traders and investors do think we would see a plane climb to $140k by December..?
Like and share your thoughts
Thanks for reading.

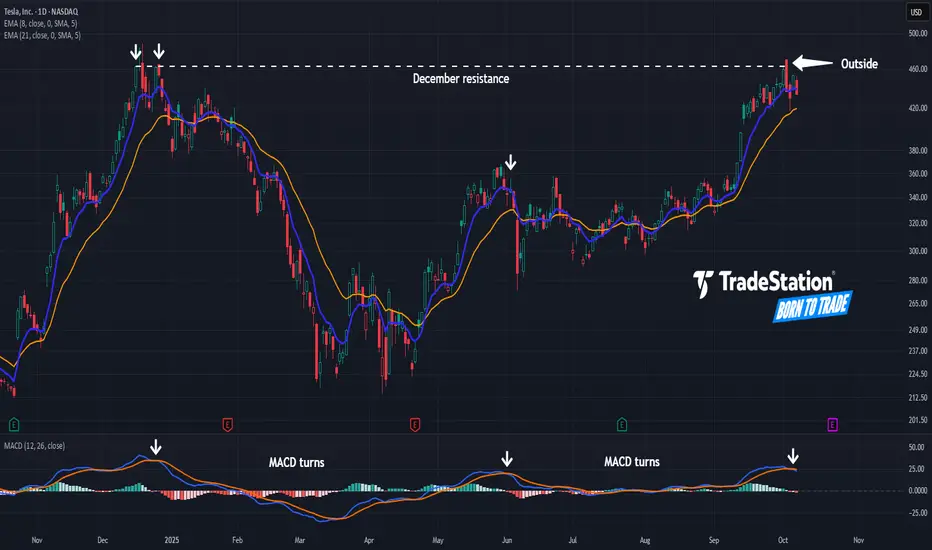
A Top for Tesla?Tesla ended the third quarter on a strong note, but some traders may see risk of the EV maker stalling.
The first pattern on today’s chart is the $463 price area. TSLA peaked at that level twice last December before reversing lower. Sellers appeared around the same level this month, which may confirm resistance is in place.
Second, the rejection day featured a higher high and lower low. That bearish outside candle is a potential reversal pattern.
Next, MACD has turned lower. Notice how previous downward reversals corresponded with deeper price declines. (Marked by white arrows in the lower study.)
Finally, TSLA is an active underlier in the options market. (Its average volume of 2.7 million contracts in the last month ranks first in the S&P 500, according to TradeStation data.) That could help traders take positions with calls and puts.
TradeStation has, for decades, advanced the trading industry, providing access to stocks, options and futures. If you're born to trade, we could be for you. See our Overview for more.
Past performance, whether actual or indicated by historical tests of strategies, is no guarantee of future performance or success. There is a possibility that you may sustain a loss equal to or greater than your entire investment regardless of which asset class you trade (equities, options or futures); therefore, you should not invest or risk money that you cannot afford to lose. Online trading is not suitable for all investors. View the document titled Characteristics and Risks of Standardized Options at www.TradeStation.com . Before trading any asset class, customers must read the relevant risk disclosure statements on www.TradeStation.com . System access and trade placement and execution may be delayed or fail due to market volatility and volume, quote delays, system and software errors, Internet traffic, outages and other factors.
Securities and futures trading is offered to self-directed customers by TradeStation Securities, Inc., a broker-dealer registered with the Securities and Exchange Commission and a futures commission merchant licensed with the Commodity Futures Trading Commission). TradeStation Securities is a member of the Financial Industry Regulatory Authority, the National Futures Association, and a number of exchanges.
Options trading is not suitable for all investors. Your TradeStation Securities’ account application to trade options will be considered and approved or disapproved based on all relevant factors, including your trading experience. See www.TradeStation.com . Visit www.TradeStation.com for full details on the costs and fees associated with options.
Margin trading involves risks, and it is important that you fully understand those risks before trading on margin. The Margin Disclosure Statement outlines many of those risks, including that you can lose more funds than you deposit in your margin account; your brokerage firm can force the sale of securities in your account; your brokerage firm can sell your securities without contacting you; and you are not entitled to an extension of time on a margin call. Review the Margin Disclosure Statement at www.TradeStation.com .
TradeStation Securities, Inc. and TradeStation Technologies, Inc. are each wholly owned subsidiaries of TradeStation Group, Inc., both operating, and providing products and services, under the TradeStation brand and trademark. When applying for, or purchasing, accounts, subscriptions, products and services, it is important that you know which company you will be dealing with. Visit www.TradeStation.com for further important information explaining what this means.
NZDCAD: Bullish Move From Trend Line 🇳🇿🇨🇦
NZDCAD may bounce from a strong falling trend line that
I spotted on a daily time frame.
As a confirmation, the price formed a double bottom
pattern on an hourly time frame and violated its neckline.
Goal - 0.8051
❤️Please, support my work with like, thank you!❤️

GBP/NZD: Pullback Trade from ResistanceThe 📉GBPNZD pair is likely to experience a retracement from the identified daily horizontal resistance level.
The formation of a double top pattern and a bearish imbalance candle on the hourly timeframe further validates this assessment.
Target price: 2.3247.

$bitcoin I was the best trader My strategy Allows me to place trades at any moment , provided price lands into a geometrical zone ,bitcoin will make me Rich in futures contracts

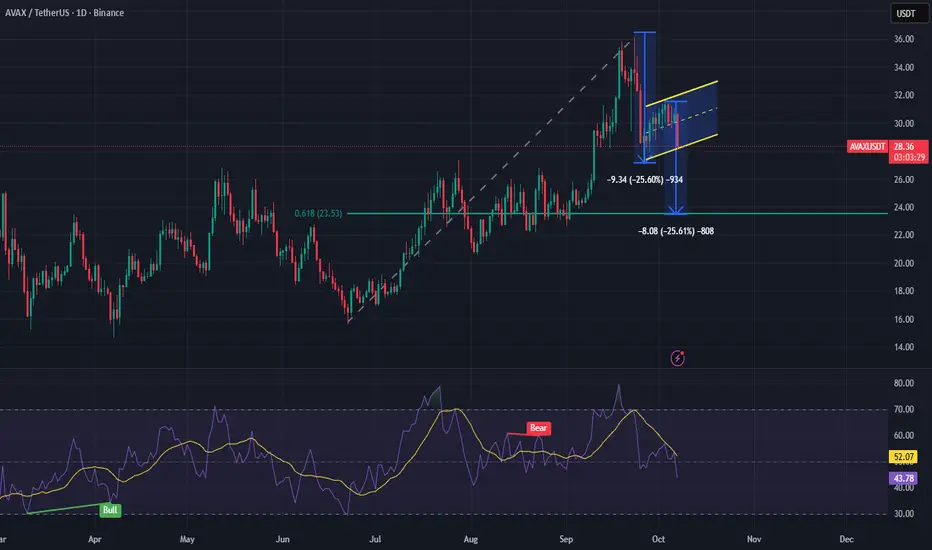
AVAX - Bear Flag/ABCD PatternFollowing the formation of a double top on 23 Sep 2025, AVAX has entered a downward trend, currently exhibiting characteristics of a bear flag consolidation. Within this structure, an ABCD harmonic pattern appears to be developing, suggesting potential continuation of bearish momentum.
Should both the bear flag and ABCD pattern play out, the projected price target lies in the range of $23.50–$23.60. This zone aligns with the 61.8% Fibonacci retracement level, derived from the swing low on 22 Jun 2025 to the swing high on 23 Sep 2025.
GBPUSD – 30M | Testing Support Zone, Bullish Bounce ExpectedFX:GBPUSD
Market Overview
GBPUSD is consolidating within a tight structure after a strong sell-off.
The pair is currently testing a major support base where buyers previously defended aggressively.
If price maintains above this zone, we may see a bullish recovery leg toward mid and upper ranges.
Key Scenarios
✅ Bullish Case 🚀 →
🎯 Target 1: 1.3451 (mid-range)
🎯 Target 2: 1.3485 (rejection zone retest)
🎯 Target 3: 1.3510 (extended liquidity reach)
❌ Bearish Case 📉 →
Invalidation below 1.3390 (if support fails to hold).
Current Levels to Watch
Resistance 🔴: 1.3451 / 1.3485
Support 🟢: 1.3400 / 1.3410
⚠️ Disclaimer: This analysis is for educational purposes only. Not financial advice.

XAUUSD – 1H Correction From Rejection ZoneOANDA:XAUUSD
Market Trend | Structure | Reaction Zone
Gold remains bullish overall, but after testing the channel top near $3,985–$3,990, price shows clear rejection candles and slowing momentum. A short-term correction is now likely before the next impulse leg.
Market Scenario
📉 If bearish confirmation holds below the rejection zone, expect a corrective pullback toward demand.
This would allow price to retest structure supports before any continuation toward new highs.
Key Targets (Correction Move)
🎯 Target 1: $3,950–$3,945 → Demand retest zone (300–400 pips)
🎯 Target 2: $3,930–$3,925 → Trendline support zone (600–700 pips)
🎯 Target 3: $3,900–$3,895 → Mid-support area (900–1,100 pips)
Invalidation Zone
❌ Close above $3,995–$4,000 cancels correction setup — continuation to new highs likely.
⚠️ Disclaimer: Educational purpose only. Not financial advice.

BTCUSD Bullish Confirmations Within An H4 Demand ZoneDouble Confluence within A demand zone. Price has swept liquidity within demand.
There is a double bottom rejection pattern and a bullish flag.
The trend is Still Your Friend.

Trying to find a base (USD/CHF)Setup: Possible bottom. Two failed breaks below 0.79 + RSI bullish divergence.
Signal : Waiting for daily close above down trendline
Plan B A weekly close below 0.79 shows long term downtrend stil in tact
Binance Coin (BNB) Flips Ripple (XRP) Following Record-Breaking In the volatile cryptocurrency market of October 2025, Binance Coin (BNB) has achieved a historic milestone, surpassing Ripple's XRP in market capitalization for the first time since 2023, fueled by a record-breaking price surge. BNB reached a new all-time high of $1,300, pushing its market cap to $180 billion, while XRP's $178 billion cap reflects a 15% daily gain to $2.27. This flip, marking BNB as the third-largest cryptocurrency behind BTC and ETH, underscores the strength of the Binance ecosystem amid regulatory tailwinds and institutional inflows. From this analysis, we explore the drivers behind BNB's surge, the implications for XRP, and trading opportunities in this high-stakes rivalry. Data as of October 7, 2025—position for the next phase of altcoin dominance.
BNB's Record Surge: $1,300 ATH and $180B Market Cap
BNB's ascent to $1,300 represents a 50% monthly gain, driven by the Maxwell upgrade on Binance Smart Chain (BSC), which reduced block times to 0.75 seconds and boosted transaction throughput by 49%. BSC's TVL hit $10 billion, with DeFi protocols like PancakeSwap processing $3.33 billion in daily volume, up 36% weekly. Institutional interest surged, with Nano Labs announcing a $500 million BNB accumulation strategy, highlighting BSC's role in cross-chain DeFi. BNB's utility in governance, staking (16.8% APY), and fee discounts on Binance Exchange has attracted 1.5 million new users monthly.
On-chain data reinforces the momentum: holder growth +15%, whale accumulation +10%, and burns reducing supply by 5% quarterly. BNB's flip of XRP (from $96.5 billion cap in November 2024) cements its position, with a 0.8 correlation to BTC signaling sustained upside.
XRP's Response: 15% Daily Gain but Lagging Behind
XRP surged 15% to $2.27, reclaiming $178 billion market cap amid optimism for spot ETFs (90% approval odds by late 2025) and Ripple's stablecoin launch rumors. The XRPL processed $16 billion in cross-border payments, with 59 billion XRP in circulation from its 100 billion fixed supply. XRP's narrative as a payments token strengthened post-SEC settlement, but BNB's ecosystem utility outpaced it, with XRP's RSI at 72 indicating overbought conditions after a 200% monthly rally.
On-chain: XRP transactions +25%, but whale sells +5% suggest profit-taking. XRP's flip by BNB highlights BSC's DeFi edge over XRPL's payments focus, though XRP's compliance-friendly features (e.g., native KYC) position it for institutional remittances.
Market Implications: BNB's Dominance and Altcoin Rotation
BNB's flip signals a rotation toward utility-driven tokens, with BSC capturing 5.5% of smart contract market share vs. XRP's 1%. BNB's burns and upgrades reduce supply, supporting $1,400 by Q4, while XRP eyes $3.60 on ETF approvals. The $50 billion meme and $150 billion stablecoin markets amplify this, with BNB correlating 0.7 to ETH for DeFi synergies. Risks include Binance regulatory scrutiny (e.g., $4 billion fine in 2024), but GENIUS Act clarity boosts confidence.
Sentiment is 71% bullish, with BNB's flip accelerating altcoin rotation, potentially lifting the total market cap to $4.2 trillion by year-end.
Trading Signals: RSI and MACD for BNB and XRP
Analysis uses RSI for momentum and MACD for trends, based on April 2025 uptrends:
BNB ($1,300): RSI at 62 (bullish above 60). Bullish MACD crossover (histogram +0.15)—target $1,400 (7.7% upside). Fibonacci support at $1,200 (50% retracement), resistance at $1,350 (161.8% extension). On-chain: Volume +36%, burns +5%.
XRP ($2.27): RSI at 72 (overbought, caution but bullish divergence). Bullish MACD (+0.12)—target $2.50 (10% upside). Fibonacci support at $2.10 (50%), resistance at $2.40 (161.8%). On-chain: Transactions +25%.
Overall: RSI 62–72 signals momentum—long BNB at supports for 10–15% Q4 gains, trim XRP at RSI >75. Risks: Regulatory news (5–7% dip); hedge with USDC.
How to Profit from BNB's Flip
Capitalize on this rivalry with disciplined strategies:
AI-Driven Alerts: Real-time notifications on RSI >60 (e.g., BNB at $1,200) and MACD crossovers, targeting 10–15% yields on ecosystem upgrades.
On-Chain Tracking: Monitor BNB burns (+5%) and XRP transactions (+25%), spotting rallies pre-ETF news.
Portfolio Rebalancing: Allocate 20–30% to BNB/XRP, hedge with stablecoins at RSI >70—aim for 15% Q4 returns through data-driven trades.
Educational Resources: Webinars on token utility and demo accounts for simulated trades, minimizing regulatory risks.
Integrated with Binance and XRPL explorers, these tools ensure precise decisions for rivalry plays.
Conclusion: Ride BNB's Surge
BNB's $1,300 ATH and flip of XRP ($178B cap) mark ecosystem dominance, with RSI 62/MACD bullish signaling 10–15% upside. Position for BNB's lead in the altcoin race.
Ready for the flip? Track signals and enter longs. What's your BNB/XRP target? Comment below!
#BNB #XRP #CryptoFlip #MarketCap #TradingSignals

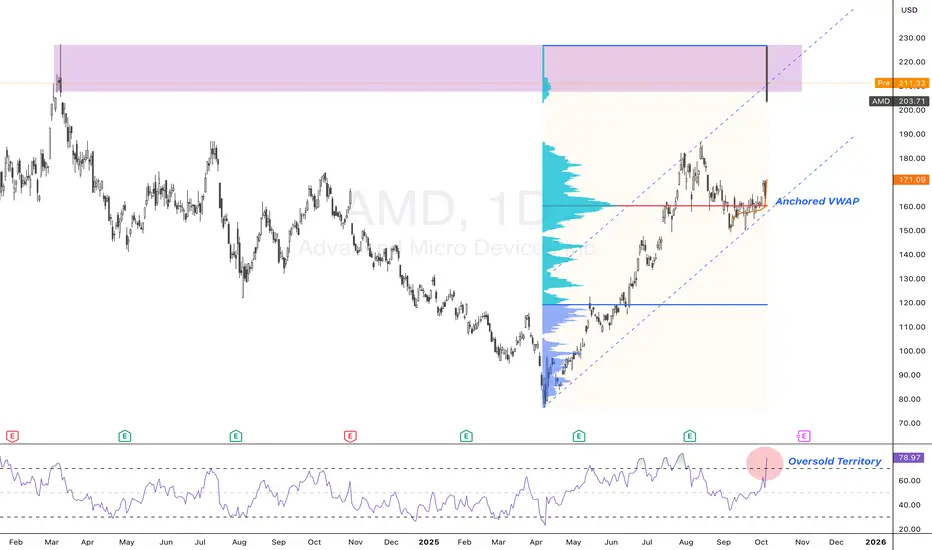
AMD: Big AI Deal, Bigger Expectations — But Caution Near HighsAMD ripped +37% after announcing a 6 GW GPU supply deal with OpenAI, including a 10% warrant structure tied to performance and stock price.
Yes, the partnership validates AMD as a serious Nvidia rival — but much of that sentiment is already priced in.
Now we enter the quiet phase:
Revenue from the deal won’t hit until 2H 2026
No near-term earnings catalyst
No immediate follow-through customer (yet)
Price is retesting March 2024 highs. A double top may be forming — or just healthy consolidation. Until real revenue shows up or a new win (Meta, AWS, etc.) breaks the news cycle, this may drift or correct.
Treat the March 2024 resistance as key. Eye the April rally leg for a possible pullback zone. High expectations, but execution is everything now.
GBPUSD BTMM Analysis – Bearish OutlookFollowing the BTMM framework, GBPUSD appears to be continuing it's bearish movement. With TMEOW, the pair finishes the week above this week's opening.
Day 1: We saw the initial push up creating the high.
Day 2: Price formed the M-pattern and rejected from the upper levels.
Day 3: Falls on the FMWB which could expect the pair to continue bearish after briefly consolidating.
The intraday trendline has already been tested, and momentum indicators are signalling exhaustion at these highs. Unless price reclaims the previous peak, bias remains bearish, with expectation of further downside continuation towards lower liquidity pools.
Bias: Bearish
Target zones: 1.3400 – 1.3360

NASDAQ Double Bottom Rejection and Demand ZonesA few days ago I posted a nasdaq setup on the H4 TF showing that a Double Bottom Rejection was at play and would result in new ATHs. I also indicated a possibility of a retest before the rally began and so far this is going according to plan.
There is still room for price to rally and claim new ATHs.
I recommend using either one of these demand zones to validate your entries for longs and using them as your Stop Loss zones.

Gold: Double Top PatternHello everybody!
A double top pattern has formed on Gold.
With the break of the neckline, a short-term reversal is likely taking place.
Manage your risk and trade safe!

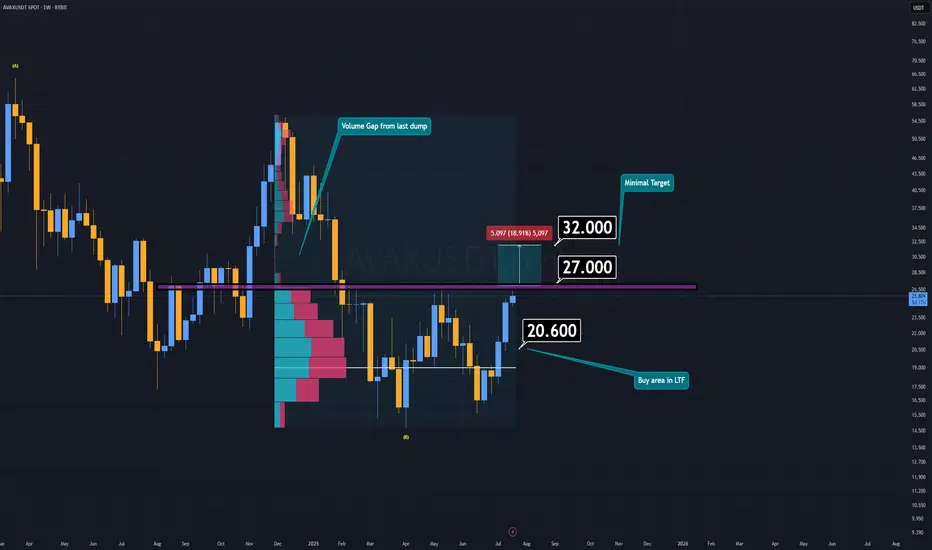
AVAX Analysis (1W)AVAX is currently attempting to form a double bottom pattern, which could signal a strong bullish reversal if confirmed. Earlier this week, AVAX made an effort to break down the key support/resistance zone, but it lacked the necessary volume to succeed.
If AVAX manages to reclaim the resistance area around $27 or higher, and confirms the breakout with a daily candle retest, the minimum target sits at $32.
However, if AVAX fails to break through resistance, there’s potentially an even better buying opportunity in the lower timeframes—a demand zone between $20 and $20.6.
I believe altcoins will offer another chance to catch up while prices are still far below their future valuations.
-S Wishes you the best in luck.
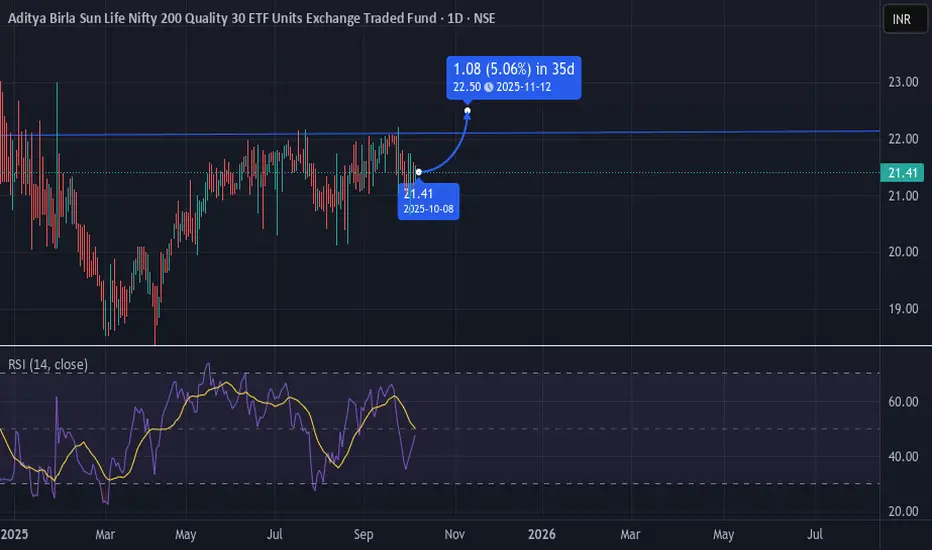
NIFTYQLITY LongNIFTYQLITY near resistance level, if this level breaks good chances of rally up
RSI level looks positive in long term 🟢
MOM30IETF Long positionMOM30IETF near resistance level, if this level breaks good chances of rally up
RSI level looks positive in long term 🟢
