Double Top formation on AUDCAD - Risky, okay?Price made a strong rally on AUDCAD, climbing aggressively.
But now, we’re spotting a possible Double Top formation, two peaks at roughly the same level.
At first glance, this looks like a bearish setup.
But here’s the caution: in the context of such a powerful uptrend, a Double Top can be tricky.
Sometimes, it’s just a pause before buyers push even higher.
We can say that the neckline broke rather cleanly, with strong confirmation, but I don't see that much conviction yet from the sellers. Buyers could come back, and the uptrend continues. This is what makes it risky. Above, there’s a strong resistance zone, and that’s exactly where price could be heading next.
So, don’t jump in too early.
Because fading a strong trend is always risky business… or should I say risky biscuit?
Double Top or Bottom

Nordicwealth: Bitcoin DeFi (BTCfi) — TVL at ATH and Core ChainIn the thriving Bitcoin ecosystem of September 2025, Bitcoin DeFi (BTCfi) has reached new heights, transforming BTC from a store of value into a yield-generating powerhouse. Total Value Locked (TVL) in BTCfi has surged to an all-time high of $5 billion, up over 600% from early 2024 levels, driven by staking protocols and Layer-2 innovations. Core Chain, a Bitcoin-aligned blockchain, stands out with yields of 5–7% on dual-staked BTC and CORE tokens, attracting institutional interest. From Nordicwealth, a premier analytics platform specializing in on-chain metrics and AI-driven signals, we explore BTCfi's growth, Core Chain's role, and trading signals using SMA and Fibonacci for key assets like BTC and CORE. Data as of September 16, 2025—position now for Q4 expansion.
Nordicwealth empowers traders with real-time dashboards; sign up for our demo to capture these opportunities.
BTCfi Overview: $5B TVL at All-Time High
BTCfi has exploded in 2025, with TVL hitting $5 billion amid Bitcoin's price stability above $115K. This marks a 22x increase from mid-2024's $300 million, fueled by non-custodial staking (e.g., Babylon at 80% of TVL) and restaking protocols like Lombard and SolvBTC. Ethereum's DeFi TVL stands at $91 billion for comparison, but BTCfi's growth—projected to surpass Ethereum's market cap per Cardano founder Charles Hoskinson—signals Bitcoin's shift to productive assets.
Key drivers: Institutional adoption (BlackRock's tokenized treasuries at $5.5 billion), regulatory clarity (GENIUS Act), and L2 launches boosting liquidity. On-chain: Transactions up 25%, with BTC staking yields drawing $7 billion TVL by mid-year. Nordicwealth's AI detects 71% bullish sentiment, correlating BTCfi TVL with BTC price (0.7), positioning it for $10 billion by year-end.
Core Chain: 5–7% Yields and Bitcoin DeFi Innovation
Core Chain, an EVM-compatible Layer-1 secured by Bitcoin's hash power (75% of mining), leads BTCfi with $260 million in dual-staked assets (3,140 BTC + 44 million CORE). Its Satoshi Plus consensus enables non-custodial BTC staking, offering 5–7% yields—higher than traditional treasuries—via dual staking multipliers (CORE/BTC ratio boosts rewards up to 80% APY in pools).
Role in BTCfi: Core powers yield protocols, DeFi dApps, and bridges, with TVL over $400 million (28% market share among Bitcoin sidechains). Partnerships like Valour's yield-bearing BTC ETP (5.6% yield) and Maple Finance's structured assets highlight institutional appeal. On-chain: 7,000+ timelocked BTC, transactions +20%, and accelerator programs funding BTCfi builders. Nordicwealth forecasts Core's TVL at $500 million by Q4, with yields stable at 5–7% amid Bitcoin's security.
Trading Signals: SMA, Fibonacci, and Nordicwealth Insights
Nordicwealth analyzes BTC and CORE using SMA for trends and Fibonacci for levels, based on April 2025 swings. Focus on BTCfi exposure via these assets.
Bitcoin (BTC, $115,845): Support at $113,500–$115,000 (50% Fibonacci retracement). Resistance at $116,400–$117,400 (38.2% extension). 50-day SMA rising at $114,541 (bullish above price), 200-day SMA at $102,637 (long-term uptrend). RSI at 59–65 signals healthy momentum. Signal: Long above 50-day SMA ($114,541) for 5–10% rally to $120K–$125K; stop below $113,500. On-chain BTCfi inflows (+$59M weekly) support breakout.
Core (CORE, ~$2.16 projected): Support at $1.86–$2.07 (61.8% Fibonacci). Resistance at $2.30–$2.50. 50-day SMA at $2.07 (neutral, price above for bullish), 200-day SMA rising. RSI at 55 (bullish divergence). Signal: Buy on Fibonacci support ($2.07), target $2.30 (10% upside) with SMA confirmation; hedge via BTC pairs. Dual-staking yields (5–7%) enhance holding appeal.
Overall: BTCfi TVL ATH correlates with BTC's 50-day SMA uptrend and Fibonacci support at $115K—enter longs for 15–20% Q4 gains. Risks: Volatility from L2 upgrades; diversify 10–20% in CORE for yields.
Conclusion: Unlock BTCfi with Nordicwealth
BTCfi's $5B TVL ATH and Core Chain's 5–7% yields signal Bitcoin's DeFi revolution, blending security with productivity. SMA and Fibonacci point to bullish setups for BTC and CORE. Nordicwealth's AI guides traders through on-chain insights and signals.
Ready to yield? Join Nordicwealth for alerts and demo tools. What's your BTCfi strategy? Comment below!
#BTCfi #BitcoinDeFi #CoreChain #SMA #Nordicwealth

Braxons Group: Top 10 Cryptocurrencies for Trading in September In the volatile world of cryptocurrencies, September 2025 presents both challenges and opportunities for traders. The market is consolidating after a summer rally, with Bitcoin holding key levels and altcoins poised for capital rotation. From Braxons Group, a leading analytical platform focused on Web3 analytics and AI tools, we present an overview of the top 10 assets for trading. Our Web3 analytics, tracking on-chain activity, whale movements, and DeFi metrics, help identify trends. We’ve selected BTC, ETH, SOL, BNB, XRP, ADA, DOGE, TRX, LTC, and AVAX based on market capitalization, liquidity, and growth potential. For each, we provide support/resistance levels, MACD and SMA indicators, and Web3 insights. Data as of September 16, 2025.
If you’re a trader, Braxons Group offers advanced dashboards for real-time analysis—sign up and test them on a demo account.
1. Bitcoin (BTC) — King of the Market
Bitcoin at $115,845 shows resilience, with a dominance of 57.4%. Support: $113,500–$115,000 (50% Fibonacci retracement). Resistance: $116,400–$117,400. MACD: Bullish crossover with a histogram of 681.93, signaling accelerating momentum. SMA: 50-day at $114,541, 200-day above at $102,637. Web3 analytics: Whales accumulating 20,000 BTC ($112M inflow), ETF inflows of $59M; on-chain data shows 60% of BTC unmoved for over a year.
2. Ethereum (ETH) — DeFi Backbone
Ethereum at $4,521.97, driven by the Pectra upgrade. Support: $4,350–$4,648 (200 EMA). Resistance: $4,760–$4,956 (52-week high). MACD: Histogram at -39.16, but bullish divergence; signal for growth above zero. SMA: 20-day at $4,433, 50-day at $4,200—price above, uptrend intact. Web3 analytics: EIP-4844 reduces gas by 80%, DeFi TVL exceeds $1T; institutions add ETH to treasuries ($727M ETF inflows).
3. Solana (SOL) — Speed King
Solana at $241.7, leading in meme coins and TPS (100,000). Support: $200–$218 (20-day EMA). Resistance: $244–$247. MACD: 0.62, rising momentum; bullish candles. SMA: 50-day at $200.8, 200-day at $176.2—above both, strong trend. Web3 analytics: Firedancer boosts reliability, Solana Pay integrated with Shopify; $7.7M inflows, 65M transactions/week.
4. BNB (BNB) — Binance Ecosystem
BNB at $920.05, with a high of $944. Support: $900–$920. Resistance: $944–$950. MACD: Bullish, above signal line. SMA: 50-day at $900, 200-day at $800—uptrend confirmed. Web3 analytics: BNB Chain tokenizes stocks (Apple, Tesla); DeFi TVL at $10B, up 20% in September.
5. XRP (XRP) — Payment Corridors
XRP at $2.94, up 380% YTD. Support: $2.73–$2.85. Resistance: $2.95–$3.00. MACD: Neutral, but bullish divergence. SMA: 50-day at $2.80, 200-day at $2.50—above, positive trend. Web3 analytics: XRPL Commons event on September 16; cross-border payments exceed $16B, bank partnerships grow.
6. Cardano (ADA) — Smart Contracts
ADA at $0.86, up 3,879% since 2017. Support: $0.78–$0.80. Resistance: $0.98–$1.00. MACD: 47.4 RSI, neutral; MACD below zero. SMA: 50-day at $0.85, 200-day at $0.70—rising. Web3 analytics: Cup-and-handle pattern; staking TVL at $500M, DeFi up 15%.
7. Dogecoin (DOGE) — Meme King
DOGE at $0.2052, down 0.63%. Support: $0.20–$0.202. Resistance: $0.22. MACD: Bollinger sell signal, but RSI at 52. SMA: 50-day at $0.20, 200-day at $0.18—above. Web3 analytics: Micropayments and charity; whale accumulation, $5M inflows.
8. TRON (TRX) — Content Platform
TRX at ~$0.25, a top YTD performer. Support: $0.24. Resistance: $0.26. MACD: Bullish. SMA: 50-day at $0.245, 200-day at $0.22. Web3 analytics: USDT on TRON exceeds $50B; DeFi up 25%.
9. Litecoin (LTC) — Silver to BTC’s Gold
LTC at $113.31. Support: $110–$112. Resistance: $115. MACD: Neutral. SMA: 50-day at $112, 200-day at $100. Web3 analytics: Fast transactions; ETF integration, volume up 10%.
10. Avalanche (AVAX) — Scalability
AVAX at ~$45. Support: $40–$42. Resistance: $48–$50. MACD: Bullish crossover. SMA: 50-day at $43, 200-day at $38. Web3 analytics: Subnets for DeFi; TVL at $15B, institutional partnerships.
Conclusion: Trade with Braxons Group
September 2025 is a time for strategic trading: focus on BTC/ETH for stability, SOL/XRP for growth. Braxons’ Web3 analytics show a 71% bullish sentiment; leverage our AI dashboards for on-chain insights. The $3.87T market calls for diversification!
Ready? Sign up with Braxons Group and get demo access. What’s your top crypto pick? Share in the comments!
#Crypto #Top10 #Trading #BraxonsGroup #September2025

Double Bottom Reversal likely for GBPAUDPrice has been moving in a clear downtrend inside a descending channel. After this recent fall, notice how price seems to have formed a double bottom. This particular pattern often shows up after a big decline like so.
The neckline, is a key level to watch now, and price is starting to break above it. A strong breakout candle can confirm this pattern, but the safer play is to wait for price to come back and retest the neckline. If the old resistance now holds as support, that’s the ideal spot to join the move.
The projected target comes from measuring the height of the double bottom and adding it to the neckline. In this case, the upside target points towards the 2.0539. A stop loss can be placed either below the neckline after retest, or more conservatively below the second bottom.
The one-hour double bottom can be reliable too, but its reliability is more dependent on volatility, unexpected events, and overall market conditions. For now, if the neckline holds on a retest, and shows good rejection, there's a high probability price will be pushing higher.

Double-Top Breakdown + Bearish MACD — Target 206Idea type: Short (breakdown) — setup confirmed by gap-down open + MACD bearish crossover
Target: 206
1) Setup — What I see
Price formed a classical double-top: two near-equal peaks with a clear neckline between them.
Break of the neckline happened on a gap-down open (strong bearish sentiment, high short interest/liquidity sweep).
MACD (12,26,9) shows a bearish crossover (MACD line crossing below signal) on the daily — momentum has turned to the downside and confirms the breakdown.
2) Primary Target:
206 — intended as the measured-move projection from the double-top pattern and reinforced by a nearby historical support zone.
Measured-move method: (Peak height) = Peak price − Neckline price. Project that distance downward from the neckline to get the target. (Use your chart’s exact peak & neckline prices to verify that this projection aligns with 206.)

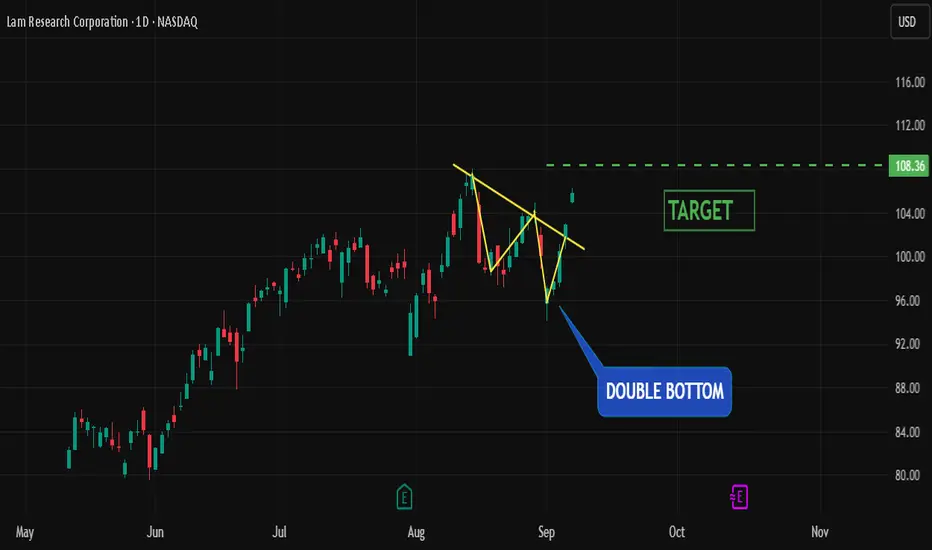
Double Bottom Breakout with Gap-Up — Target 1081) Pattern + Breakout Confirmation
The chart has formed a double bottom structure, a classic reversal setup that signals the end of a downtrend and potential start of an uptrend. After testing the support zone twice and holding firm, price opened with a strong gap-up above the neckline , confirming bullish intent.
2) Trade Plan — Path Toward 108
The measured move from the double bottom formation projects an upside target of 108 , aligning with a prior resistance zone . Traders can consider entry on the breakout or wait for a pullback to the neckline for a safer risk-reward setup. The invalidation level lies just below the neckline gap, while momentum favors continuation higher. Holding above the breakout zone keeps the bullish bias intact until the target at 108 is approached.
Royal Caribbean Cruises — Double Top Signals Rough Seas AheadPrice action in Alliant Energy has developed a clear double-top reversal pattern , with the neckline now broken on strong momentum. This structure signals exhaustion of the prior uptrend and the possibility of a bearish leg unfolding.
Adding further conviction, the MACD indicator has printed a bearish crossover (MACD line crossing below the signal line), showing that momentum has shifted in favor of sellers. This dual confirmation — pattern + momentum — strengthens the short-side outlook.
Trade Plan :
Entry : immediately
Stop-loss : Just above the recent top / right shoulder (adjust as per risk tolerance).
Target : 342

Important resistance blocking the way to the ascent...Hello friends
Well, we have a downtrend, and you can see that we have drawn a resistance for it, and the price has hit this resistance twice.
After the second hit, the price has fallen to the specified support area, and in that area a double bottom pattern has formed, and the price has been supported. Now, considering the support in this price area, we need to see if the buyers can break the specified resistance or not?
If the resistance is broken, the price can move up to the two specified areas, but if the price falls, we need to see if the support that once supported the price and caused the price to grow can support it again or not?
So, follow capital and risk management
*Trade safely with us*
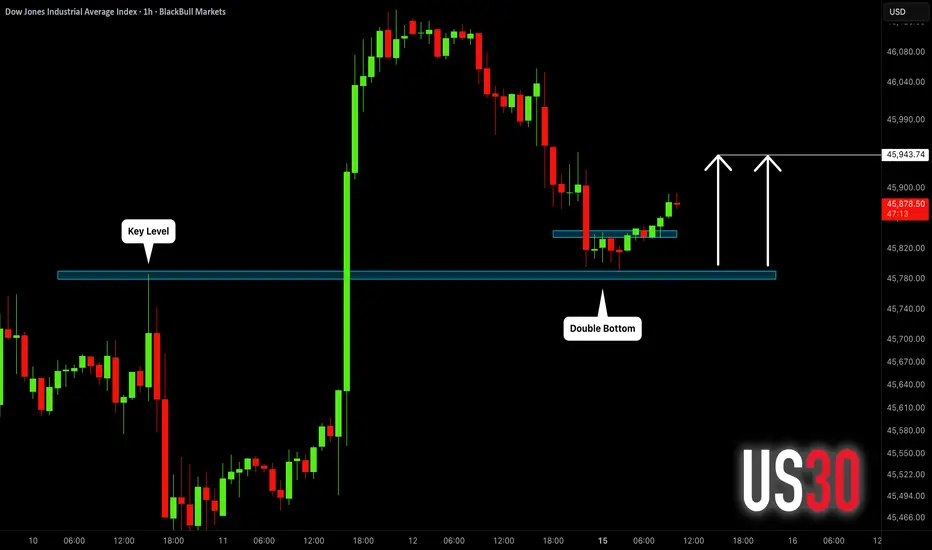
DOW JONES (US30): Pullback From Support Confirmed
Following our Friday's analysis, US30 retested a recently broken
major daily demand zone.
Testing the underlined horizontal key level, the price formed a tiny double bottom.
Its neckline breakout indicates a highly probably pullback.
Goal - 45940
❤️Please, support my work with like, thank you!❤️
I am part of Trade Nation's Influencer program and receive a monthly fee for using their TradingView charts in my analysis.
EURUSD BEARISH FALSE BREAKOUT.Price retested previous resistance level at (1.17897 - 1.17713) and was rejected back to the trading range at (1.17441- 1.17213) and formed a double top with bearish engulfing triggering entry.
Two Entry Model with different Stop Loss.
Entry 1- At the close of the bearish Engulfing Stop loss at 1.17488 at new lower high formed or Stop loss at 1.17806 previous high.
Entry 2 -Wait for the trendline break for extra confirmation, Stop loss at 1.17488 at new lower high formed.

$SOL / $BTC 50WMA Reclaimed - Alt Season Confirmed!Ladies and Gentlemen,
CRYPTOCAP:SOL / CRYPTOCAP:BTC has officially closed the Week above the 50WMA and is back within the POI.
Double bottom confirmed this setup.
Along with the longest cup and handle I’ve ever seen lol.
Let the rotation for Alt Season begin!

GBPCAD Key Resistance Level + Double Top at the level.Price is at Key Resistance level tested multiple times and Previous High at (1.88375 - 1.86941). Price formed Double Top inside our level followed by Short term trendline with 2 touches.
Entry 1 - Aggressive Entry at the Close of the Bearish Engulfing.
Entry 2 - Conservative at the break of the Short term trendline in H4 to signal that the previous uptrend is over and sellers are coming in since we are going against the dominant uptrend we need extra confirmation.

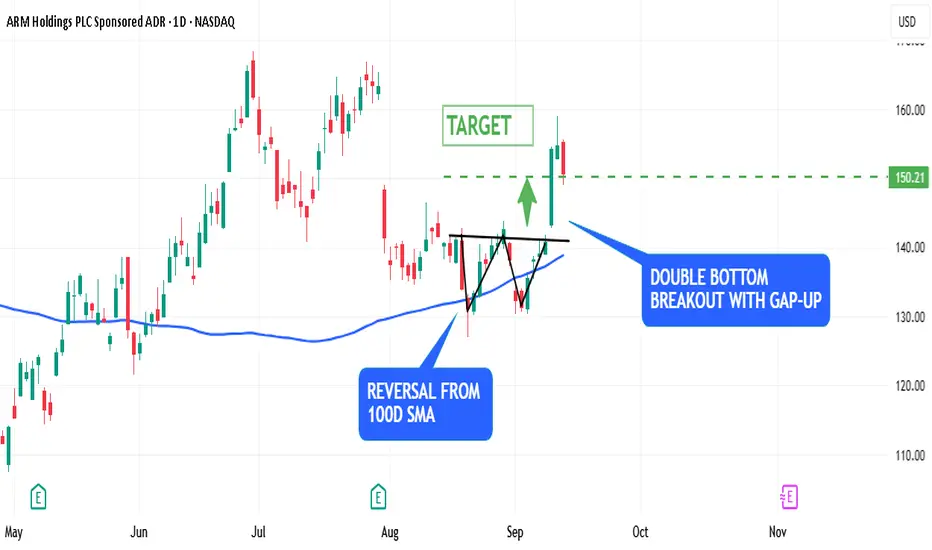
ARM Holdings – Gap-Up Double Bottom Breakout Hits 150ARM Holdings broke out of a double bottom with a big gap up and showed strong conviction. After the breakout, price reached 150 quickly and the target was validated.
Interestingly, the stock also reversed from the 100D SMA which acted as a support and added more strength to the upmove.
This combination of a bullish chart pattern, gap up and SMA support shows strong institutional participation and good technicals.
📊 Key Highlights:
Broke out of double bottom ✅
Gap up 📈
Target of 150 hit 🎯
100D SMA acted as support 🔑
Do you think ARM can continue to go up and hit new highs or is a short term pullback coming?
BTC Short to 110500BTCShort to 110503
Enter 116596
SL 117952
TP 110503
BTC DoubleTop. Everyone extra bullish on Twitter
SL would have manually in case of wick above the top
Low leverage can enter now
dumping to 110k would push fear and greed index at "Extreme Fear"
Would do weekly double bottom.

USDCAD: Pullback Trade From Support 🇺🇸🇨🇦
USDCAD is going to bounce from a strong intraday horizontal support.
My confirmation signal is a formation of a double bottom pattern
on that and a breakout of its horizontal neckline.
I expect move up to 1.3855
❤️Please, support my work with like, thank you!❤️
I am part of Trade Nation's Influencer program and receive a monthly fee for using their TradingView charts in my analysis.

EURGBP potential long set-up 4HRStarting to look like a double bottom.
Seeing sign of RSI divergence

XAUUSD Bears Hold the Line at 3650 zone – Next Stop 3570?In yesterday’s analysis, I mentioned that in my view, OANDA:XAUUSD ’s correction is not yet complete and that we could be inside an unfolding ABC-type structure. I also suggested that the 3650 zone should be the main focus for bears.
Indeed, price rallied into that zone, consolidated in a small distribution phase, and then started to roll back down again.
At the time of writing, gold is trading at 3632, after retesting the 3623 recent low, which now acts as short-term support.
Looking forward, my idea remains unchanged: I expect another leg down, with 3570 as the next major target. For now, the 3650–3660 area acts as a strong ceiling, and if we look closely, one could even argue a potential double top is forming—if we discount the 3674 spike that marked the ATH.
On the other hand, a stabilization above 3660 would invalidate this bearish scenario and open the door for a new ATH. 🚀

BITCOIN (BTCUSD): Strong Bullish Price ActionIt appears that there are two strong bullish confirmations for 📈BITCOIN after testing a significant daily support cluster.
The price has violated a trend line within a falling channel, along with the neckline of a double bottom pattern, as indicated by a single, robust bullish candle.
It is possible that the pair could continue to increase in value, potentially reaching the 113,242 level before encountering the next resistance.

gj shortI have a feeling price is going down from here. Price seems over-extended with large momentum candles going up into equal highs.

9/11: Double Top Pattern, Bearish OutlookGood afternoon, everyone!
Yesterday, the market showed limited volatility, with prices capped around 3343–3358, failing to break through, which delayed the expected downward cycle.
Today, the trend looks clearer:
A double-top pattern has formed;
Price tested the 23 support for the first time and rebounded slightly;
Key resistance levels are 32–37, followed by 41;
If the rebound fails to break resistance, the 23 support is very likely to be broken;
Main supports to watch are 3610 (2H chart) and 3578–3550 (4H chart).
🔹 Trading Strategy
Focus on short positions;
Try quick long trades near support, but avoid being greedy;
If rebounds fail at resistance, shorts may accelerate, so risk is relatively high.

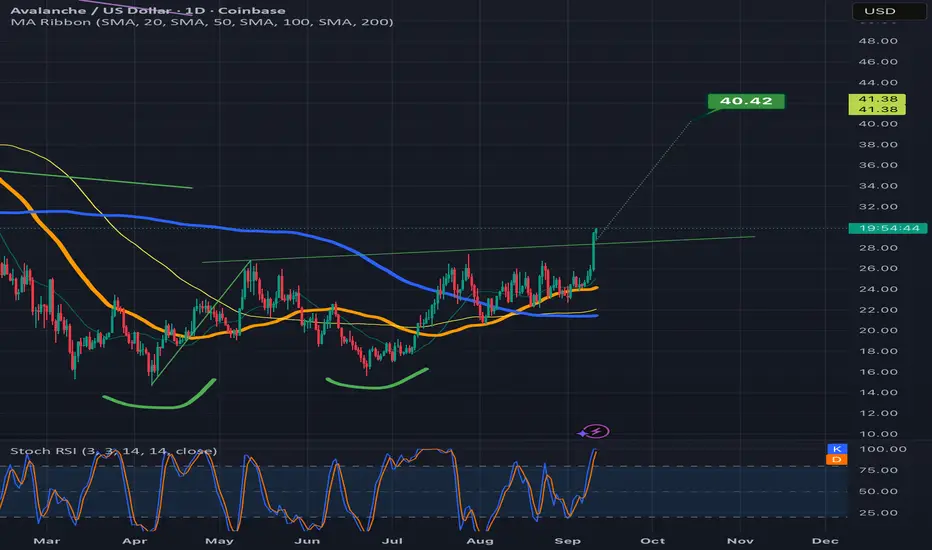
Avalanche with a close above the double bottom necklineNot sure whether it will validate the breakout here or go back below the neckline, but that was a very convincing bullish candle close above the neckline on the previous daily candle so it should give it some reasonable probability. *not financial advice*
DOGEUSDT.P 1WDOGE Update
Key Level: $0.27
Pattern: Double Bottom & Triangle
Bullish Target: $0.50 (on breakout)
Action: Watch for volume on a break above $0.27.
DYOR & NFA

PLTR: Is a New Uptrend Beginning Above 165?PLTR: Is a New Uptrend Beginning Above 165?
PLTR is currently trading above the 165 Resistance level.
We need to observe if it closes above this resistance for a confirmed breakout.
A sustained close above 165 could signal the start of a new uptrend with a target of 185.
The immediate support to watch for any pullback is at 158.
Disclaimer:
The information provided in this chart is for educational and informational purposes only and should not be considered as investment advice. Trading and investing involve substantial risk and are not suitable for every investor. You should carefully consider your financial situation and consult with a financial advisor before making any investment decisions. The creator of this chart does not guarantee any specific outcome or profit and is not responsible for any losses incurred as a result of using this information. Past performance is not indicative of future results. Use this information at your own risk. This chart has been created for my own improvement in Trading and Investment Analysis. Please do your own analysis before any investments.
