AIZ at channel bottomPrice at bottom channel
Stochastic Momentum Index (SMI) at oversold level
TTM Squeeze is off
TTM Squeeze momentum is down
Price at Fibonacci 1.618 extension
In @ $161
Exit @ $170
Next report date
—
Report period
—
EPS estimate
—
Revenue estimate
—
14.40USD
642.50 MUSD
11.13 BUSD
51.58 M
About Assurant, Inc.
Sector
Industry
CEO
Keith Warner Demmings
Website
Headquarters
Atlanta
Employees (FY)
13.6 K
Founded
1892
FIGI
BBG000BZX1N5
Assurant, Inc. engages in the provision of lifestyle and housing solutions for consumer purchases. It operates through the following segments: Global Lifestyle, Global Housing, and Corporate and Other. The Global Lifestyle segment offers mobile device solutions and extended service products and related services for mobile devices, consumer electronics and appliances, vehicle protection, and related services. The Global Housing segment includes lender-placed homeowners’ insurance, lender-placed manufactured housing insurance, lender-placed flood insurance, renters' insurance, and related products, voluntary manufactured housing insurance, voluntary homeowners’ insurance and other specialty products. The Corporate and Other segment refers to the corporate employee-related expenses and activities of the holding company. The company was founded in 1892 and is headquartered in Atlanta, GA.

Assurant Inc. DCA - Inverted head and shouldersCompany: Assurant Inc.
Ticker: AIZ
Exchange: NYSE
Sector: Financials
Introduction:
In this analysis, we focus on Assurant Inc. (AIZ) listed on the NYSE, an important player in the financial sector. The daily chart highlights a potential bullish reversal signaled by an Inverted Head and Shoulders

June Gainers (AIZ, account up 2.28%)8th trade in June is NYSE:AIZ .
Holding period is 0 day.
Account is up 2.28%.
Total return in June is 5.84%.

AIZ - Megaphone Bullish Megaphone structure
A channel can be drawn within this that aligns with the upper trend line of the megaphone
This allows for a bullish conclusion to be drawn which I have plotted with the bars pattern tool

AIZ | Good Entry for Long | OversoldAssurant, Inc., together with its subsidiaries, provides lifestyle and housing solutions that support, protect, and connect consumer purchases in North America, Latin America, Europe, and the Asia Pacific. The company operates through two segments: Global Lifestyle and Global Housing. The Global Lif
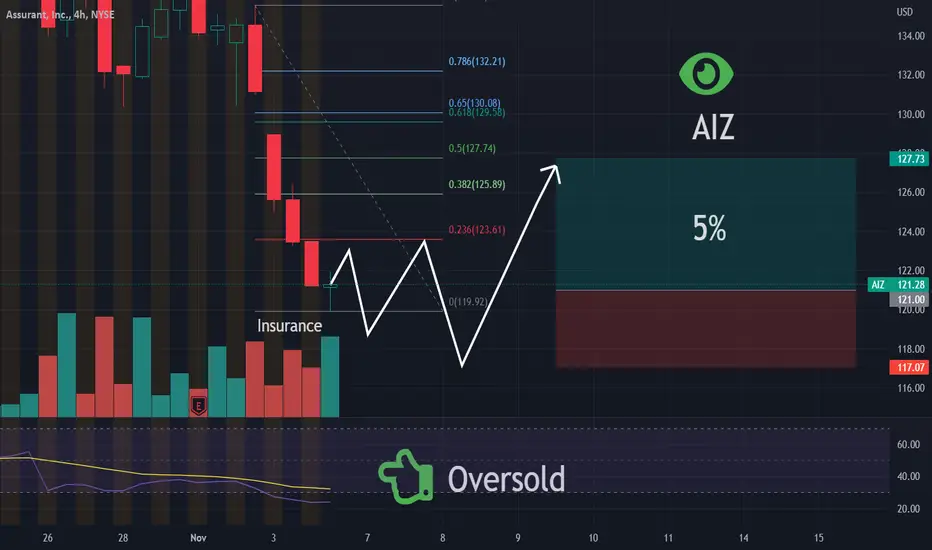
Assurant +5%Assurant is a global provider of risk management solutions, mainly focusing on the lifestyle and housing protection markets. It offers five segments: Assurant Solutions: offers credit-related insurance, debt protection administration, warranties and service contracts, and pre-funded funeral insuranc

AIZ: volatility squeeze!Volatility squeeze might be applicable.
Bullish trend applicable above 160.50.
RSI leaves enough room for further upside price potential.
Would like to see momentum increasing.

AIZ Breaking out againAIZ breaking out of 3 Month Long Base
Very strong uptrend
Last 2 dips held by 200 DMA
Pays out dividends

PAY to ASSURANT DailyHey traders, ASSURANT is in a bearish push with a form of shooting star and a fake explosion on the volume of sales issued. On the TIMEFRAME M1 we can see a shooting star with a negotiated purchase volume return, it came to check the bottom of the stabilization zone. To head towards the base of the

CUPShould be down next 2-3 weeks till $125-120 januar.
After this should rise some 15-35%
What you think?

See all ideas
An aggregate view of professional's ratings.
Trade directly on the supercharts through our supported, fully-verified and user-reviewed brokers.


Curated watchlists where AIZ is featured.

Frequently Asked Questions
The current price of AIZ is 173.05 USD — it has increased by 2.04% in the past 24 hours. Watch Assurant, Inc. stock price performance more closely on the chart.
Depending on the exchange, the stock ticker may vary. For instance, on NYSE exchange Assurant, Inc. stocks are traded under the ticker AIZ.
AIZ stock has risen by 0.14% compared to the previous week, the month change is a 4.49% rise, over the last year Assurant, Inc. has showed a 30.22% increase.
We've gathered analysts' opinions on Assurant, Inc. future price: according to them, AIZ price has a max estimate of 222.00 USD and a min estimate of 186.00 USD. Watch AIZ chart and read a more detailed Assurant, Inc. stock forecast: see what analysts think of Assurant, Inc. and suggest that you do with its stocks.
AIZ stock is 2.75% volatile and has beta coefficient of 0.34. Track Assurant, Inc. stock price on the chart and check out the list of the most volatile stocks — is Assurant, Inc. there?
Today Assurant, Inc. has the market capitalization of 8.82 B, it has increased by 0.32% over the last week.
Yes, you can track Assurant, Inc. financials in yearly and quarterly reports right on TradingView.
Assurant, Inc. is going to release the next earnings report on Aug 6, 2024. Keep track of upcoming events with our Earnings Calendar.
AIZ earnings for the last quarter are 4.97 USD per share, whereas the estimation was 3.88 USD resulting in a 28.24% surprise. The estimated earnings for the next quarter are 3.71 USD per share. See more details about Assurant, Inc. earnings.
Assurant, Inc. revenue for the last quarter amounts to 2.88 B USD, despite the estimated figure of 2.84 B USD. In the next quarter, revenue is expected to reach 2.90 B USD.
AIZ net income for the last quarter is 236.40 M USD, while the quarter before that showed 182.50 M USD of net income which accounts for 29.53% change. Track more Assurant, Inc. financial stats to get the full picture.
Yes, AIZ dividends are paid quarterly. The last dividend per share was 0.72 USD. As of today, Dividend Yield (TTM)% is 1.69%. Tracking Assurant, Inc. dividends might help you take more informed decisions.
Assurant, Inc. dividend yield was 1.67% in 2023, and payout ratio reached 23.61%. The year before the numbers were 2.19% and 54.27% correspondingly. See high-dividend stocks and find more opportunities for your portfolio.
As of Jul 27, 2024, the company has 13.60 K employees. See our rating of the largest employees — is Assurant, Inc. on this list?
Like other stocks, AIZ shares are traded on stock exchanges, e.g. Nasdaq, Nyse, Euronext, and the easiest way to buy them is through an online stock broker. To do this, you need to open an account and follow a broker's procedures, then start trading. You can trade Assurant, Inc. stock right from TradingView charts — choose your broker and connect to your account.
Investing in stocks requires a comprehensive research: you should carefully study all the available data, e.g. company's financials, related news, and its technical analysis. So Assurant, Inc. technincal analysis shows the strong buy rating today, and its 1 week rating is buy. Since market conditions are prone to changes, it's worth looking a bit further into the future — according to the 1 month rating Assurant, Inc. stock shows the strong buy signal. See more of Assurant, Inc. technicals for a more comprehensive analysis.
If you're still not sure, try looking for inspiration in our curated watchlists.
If you're still not sure, try looking for inspiration in our curated watchlists.