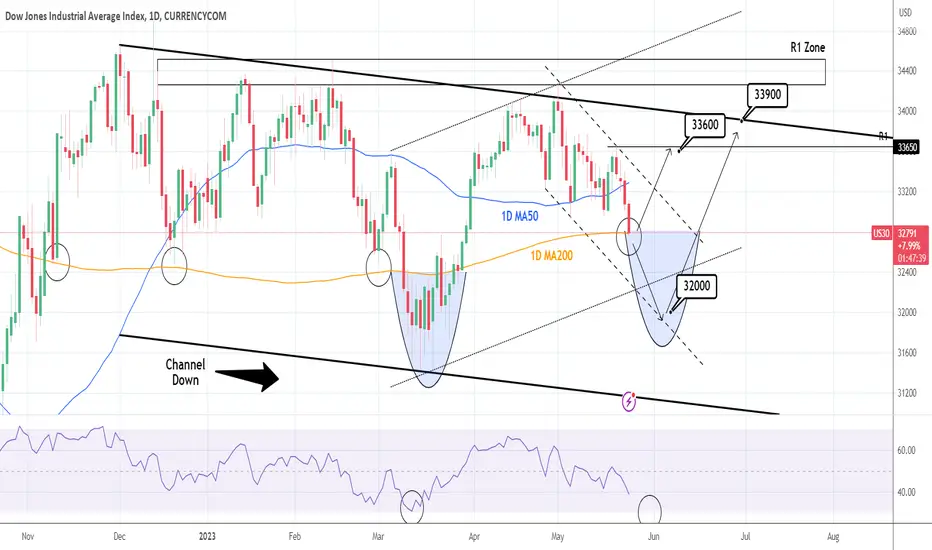
DOW JONES: Hit the 1D MA200 after almost 2 months.Dow Jones touched today the 1D MA200 for the first time since March 29th, almost 2 months after the strong bullish break-out. The 1D timeframe is technically bearish (RSI = 38.438, MACD = -67.410, ADX = 30.240), indicating that we are approaching low enough levels to justify a long term buy. However we are only willing to open a buy position as long as the 1D candles close over the 1D MA200 and target R1 (TP = 33,600).
If a candle closes below the 1D MA200, we will open a sell and target the bottom of the dashed Channel Down (TP = 32,000). Once the 1D RSI gets oversold, we will again buy on the long term, aiming at the top of the seven month Channel Down (TP = 33,900).
Keep in mind that the 1D MA200 has held and provided excellent buy signals, three times and only once on March 9th it broke.
Prior idea:
## If you like our free content follow our profile to get more daily ideas. ##
## Comments and likes are greatly appreciated. ##
DOW
US30 Analysis, can support hold for buyers?Today's focus: US30
Pattern – Support point, descending triangle.
Possible targets – Downside 31,840 Upside 31,160
Support – 33,033
Resistance – 33,705
Thanks for checking out today’s update. Today’s analysis is over the US30 daily as price sits around support in a descending triangle pattern. Yesterday price broke lower after buyers failed to beat Monday’s high. The debt ceiling issue continues to look like the key issue, with price reacting negatively after no ground was made on Tuesday.
This could continue to drive momentum, and bad news could equal downside risk, while a deal could give buyers plenty of drive. This week’s meeting minutes are another factor; traders will be looking for more clues on rates and how the Fed is seeing inflation atm. We are also hoping to hear more about how the banking issues are factoring into the Fed’s view.
Thanks for stopping by. Good trading, and have a great day.

DOW JONES Emerging Bullish Cross may take it higher.Dow Jones (DJI) has broken above the former long-term Channel Down, hitting our previous upside target (see idea below) and is now forming a new pattern:
The new pattern is a Channel Up, which has been on a correction leg (blue channel down) since the 34270 High, similar to the one from December 01 to January 05. The 1D MA50 (blue trend-line) is supporting a loose Triangle pattern (dashed trend-lines), which above it targets Resistance 1. Our target is slightly lower at 34250.
The critical factor is on the 1D MACD, which is close to forming a Bullish Cross. Every MACD Bullish Cross under 0 in 2023 has been a major Buy Signal, and interestingly enough both have been formed while the price was consolidating within a Triangle.
-------------------------------------------------------------------------------
** Please LIKE 👍, FOLLOW ✅, SHARE 🙌 and COMMENT ✍ if you enjoy this idea! Also share your ideas and charts in the comments section below! **
-------------------------------------------------------------------------------
💸💸💸💸💸💸
👇 👇 👇 👇 👇 👇

DJI ARE you rdy for sell ?🧨🧨👌The fall of the Dow Jones index / Are you ready to sell?
It is easy to see that the Dow Jones index is going to fall, and the targets that I specified for you will first reach 31486.38, then it will have a corrective trend up to 32550.68.
The next target that the index will see will be 28781.97 and that is where you can decide to go long.

DOW JONES Short term rise very likelyDow Jones is finding support on the 1day MA50, forming a Triangle pattern.
The same pattern during the late December 2022 consolidation, broke upwards and reached the previous High.
Up to this point, even the 1day RSI structures since the Falling Supports are very much alike.
As long as Support A holds, buy and target 34200.
If it crosses under the 1day MA200, sell and target 31700.
Previous chart:
Follow us, like the idea and leave a comment below!!

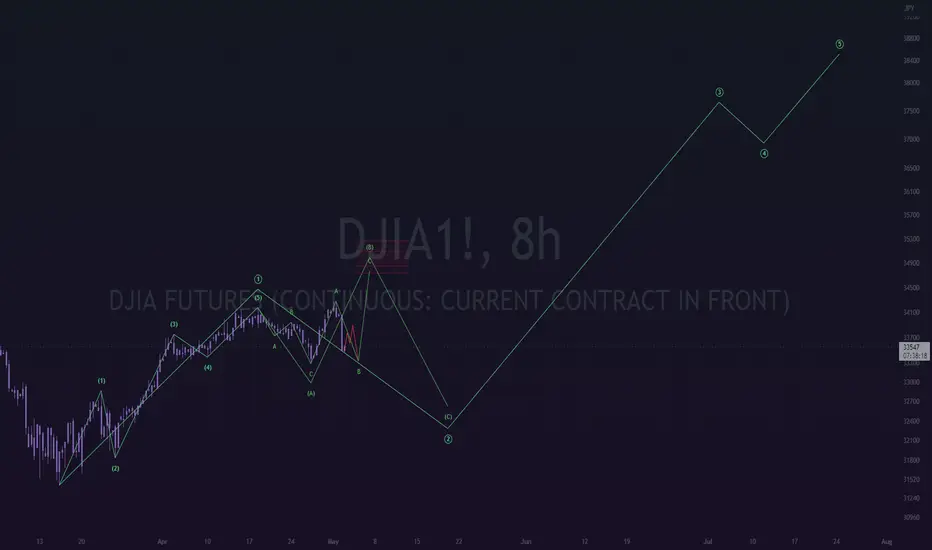
DOW JONES FORMING BARRIERThis is a 15-Minutes Timeframe, in my perspective, Dow Jones currently forming a Barrier Triangle.
Elliott Wave is high subjective, i will post if there's a new update on my perspective.
Trade safe, Everyone!
Cheers

PFE - Buy The Dip or Follow The Trend?When I began research for this post I expected to be giving the bull case for Pfizer. It's the type of stock I like - a household name oozing with quality and prestige, a strong moat, beaten up with strongly bearish sentiment with multiple factors pointing towards recovery, with short term technical support and long term positive fundamental outlook.
I like to play the contrarian in the stock market and it often pays well. So what about Pfizer?
Well, technically it's RSI oversold (or was on Thursday, before a small bump Friday) on virtually every timeframe from the 1 hour right through to the Weekly.
Looking at Measured Moves, something I do regularly, it's down 19 points from it's swing high on Dec 14th 2022, exactly the same as big upswing from Feb 25th to Aug 18th 2021, and just short of the Oct 13th to Dec 20th 2021 swing of 21 points.
Note that these 3 swings mentioned are the largest swings in Pfizer history, due to the growth and subsequent crash caused by COVID and the following recovery.
We also have the potential for an area of support here, with the area around 36 having seen both support and resistance on a regular basis since 2016, and if we zoom out a year or 2 and look at Volume Profile, depending on where your set your Visible Range you're going to see the point of control landing between 34.5 - 36. Either the current price or just below.
So what's the problem?
There are a few.
"Patent Cliffs" are always an issue for pharmaceutical companies, where after 20 years their patents expire and they have to face competition from generic brands entering the space.
Five of Pfizer’s products face patent expiration in the next six years — Eliquis, an anticoagulant medication, Ibrance to treat breast cancer, Xeljanz for arthritis, Xtandi for prostate cancer, and Vyndaqel for transthyretin amyloid cardiomyopathy. Excluding Pfizer's COVID sales, these 5 products respresent 40% of the company's sales.
Just this week, William Pao, Pfizer’s chief development officer raised concerns about antitrust regulators cracking down on Mergers and Acquisitions, notably with the blockage of Amgen's $28billion takeover of Horizon.
This raises questions about Pfizer's proposed $43billion purchase of Seagen, and whether they too will come under regulator scrutiny.
Financially, Pfizer's revenue is expected to meaningfully decline in 2023, mainly due to a drop in COVID-19 related sales. Analysts estimate the revenue to be around $68.1B, a 32% YoY decrease.
Pfizer's adjusted EPS for FY23 is expected to be $3.37, down 49% YoY, according to Wall Street estimates.
This is a company that since 2000 has traded as low as 12 in 2008, to as high as 61 at the peak of the COVID drug mania. While technically we do look likely to see a relief rally in the near term, this isn't a company I want to be exposed to. There is too much uncertainty, and while it may look cheap on the scale of the last few years, we must bear in mind that those years were drastically inflated due to COVID drugs that are no longer relevent to it's financials. Pfizer is coming back down to earth with a thud, and I think the company belongs in the 27-36 price range until we see more clarity on it's Seagen purchase and how much it's revenues are pilfered by competing generics.
No play for me right now on Pfizer. This is the reality of stock analysis - you go down the rabbit hole, and ultimately most stocks are neither a buy or a sell. Just a "wait and see".

DOW JONES: Inverse Head and Shoulders on 1W target 34,350.Dow Jones hit again the underlying Support which marked a low on January 16th. That was the Left Shoulder (LF) of a potential Inverse Head and Shoulders pattern and if it holds again, this one will be the Right Shoulder (RS). The 1W timeframe is technically neutral (RSI = 49.180, MACD = 258.440, ADX = 22.862), which makes it a solid buy opportunity on a two month perspective. Our target is the bottom of the R1 Zone (TP = 34,350).
Prior idea:
## If you like our free content follow our profile to get more daily ideas. ##
## Comments and likes are greatly appreciated. ##

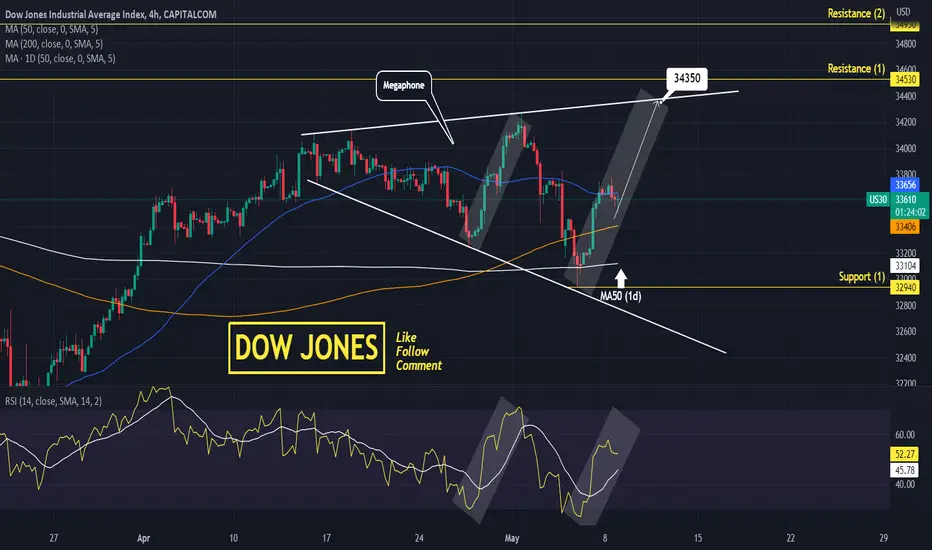
DOW JONES Death Cross on 4h after 3 months.Dow Jones posted its first Death Cross on the 4h timeframe since February 22th.
This should prepare us for more selling if Support (1) breaks.
Trading Plan:
1. Sell under Support (1).
2. Buy over the MA200 (4h).
Targets:
1. 32450 (Channel Down bottom).
2. 34500 (Megaphone top and Resistance 1).
Tips:
1. RSI (4h) is posting a price action indentical to the one on the start of the Megaphone.
Please like, follow and comment!!
Notes:
Past trading plan:

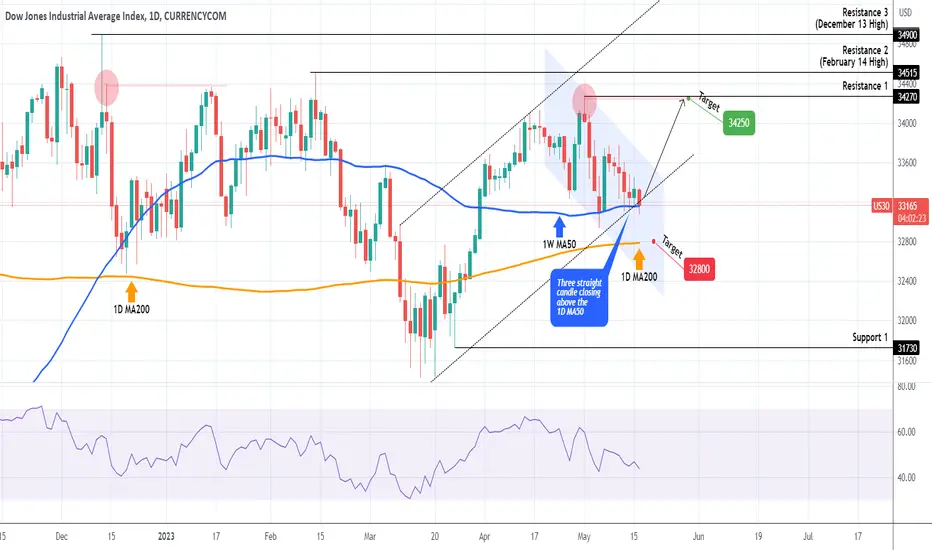
DOW JONES Big Buy signal if it holds the 1D MA50Dow Jones (DJIA) has gone a long way since the efficient buy signal we gave exactly 2 months ago:
The index is right now testing the 1D MA50 (blue trend-line), which has closed 3 straight 1D candles above it and 4 since May 04. Since it broke below the Channel Up, going to the 1D MA200 (orange trend-line) and 32800 is possible but not as long as it keeps closing above the 1D MA50, which has been established as the short-term Support. Instead, as long as it does, we are bullish and targeting 34250.
-------------------------------------------------------------------------------
** Please LIKE 👍, FOLLOW ✅, SHARE 🙌 and COMMENT ✍ if you enjoy this idea! Also share your ideas and charts in the comments section below! **
-------------------------------------------------------------------------------
💸💸💸💸💸💸
👇 👇 👇 👇 👇 👇
US30This is my my "Sunday" review. I'm slightly fluish but that still is no excuse to being a slack.
Here we have US30 (A pair I actually didn't have the belief I'd be able to trade)
From the Daily, we can see we are forming a pennant and in previous weeks we have broke an uptrend, retested and continued. So we know we have hit all 3 points on both sides.
Move down to the 4H where we see a double bottom and an inverse H&S which is the opportunity for a bullish run. That is still not enough to declare our buying bias. We will wait for area of significance to be broken, retested before fully placing Buy Stops.
Down to 15M, those mini runs are risky but if you're thirsty and have enough capital to play with (you know how much that is), then fully go for it and stay watching it. I have just read that it is the CPI week so it will shake up the fundamental side of the market.

DOW divergence? Does this RSI divergence signal what's to come. I believe there is a catalyst coming that will cause the dow to plunge as will other indices. As of now im not sure what that is. something will blow up whether its banks ect. The fed will have no choice but to do an emergency rate cut. IF the rate cut happens. that's the time to go short. go look at every previous crash it only happens once fed cuts.

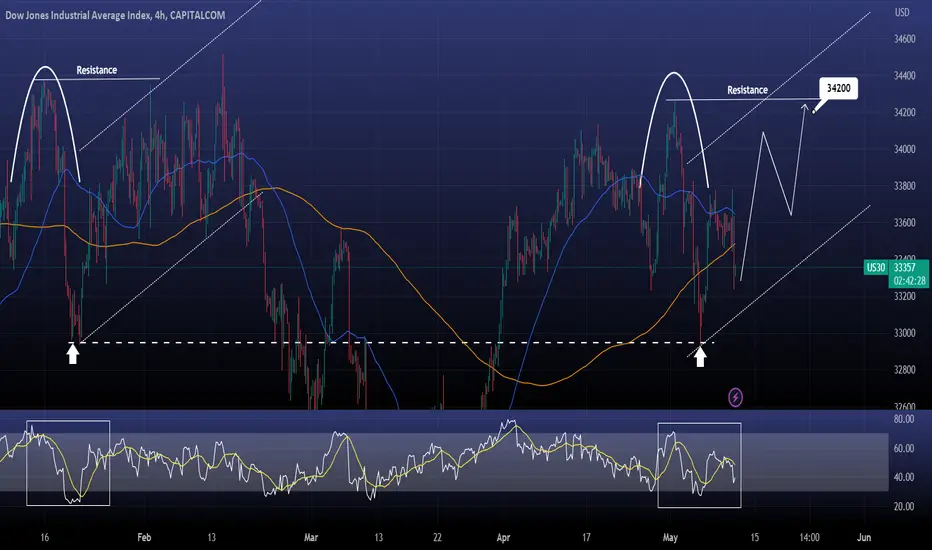
DOW JONES starting a new Channel UpDow Jones is forming a pattern much like January, which after a peak and rejection to a Lower Low, it started a Channel Up.
Both Lows have been formed on the exact price level (32950).
The 4hour RSI sequences are also similar.
The target on January's pattern was the peak's Resistance.
Buy and target 34200.
Previous chart:
Follow us, like the idea and leave a comment below!!
DOW JONES: Harmonic pattern calling for a buy. TP = 34,350.Dow Jones is on a minor 3 day pullback after a strong rebound that closed over the 1D MA50. The 1D technicals are neutral (RSI = 48.264, MACD = 86.760, ADX = 23.509) and being on a Harmonic rise since March 20th Low, the 1D MA50 rebound is most likely the bullish wave to test yet again the R1 Zone. Unless S1 breaks, we are targeting the bottom of R1 (TP = 34,350).
Prior idea:
## If you like our free content follow our profile to get more daily ideas. ##
## Comments and likes are greatly appreciated. ##

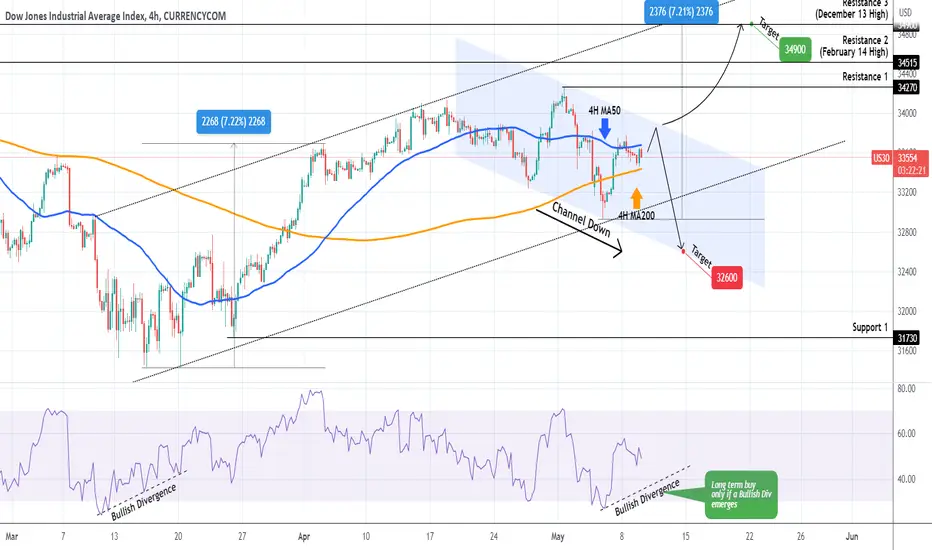
DOW JONES Channel Down emerging. This is its invalidation.Dow Jones (DJIA) is attempting to re-enter the Channel Down pattern that broke upwards, and on the bottom of which we gave the most efficient buy signal almost 2 months ago:
At the moment the index is on the build up of a Channel Down which targets 32600. We will only buy if the price closes above its top (Lower Highs trend-line) and target Resistance 3 at 34900. As far as a long-term buy is concerned, we are only interested in buying if a Bullish Divergence is spotted on the 4H RSI, same as on March 15.
-------------------------------------------------------------------------------
** Please LIKE 👍, FOLLOW ✅, SHARE 🙌 and COMMENT ✍ if you enjoy this idea! Also share your ideas and charts in the comments section below! **
-------------------------------------------------------------------------------
💸💸💸💸💸💸
👇 👇 👇 👇 👇 👇
CFD Update: FRA40 pushing at a new leg higher?Today's focus FRA40 CAC
Pattern – Support hold - continuation - HL
Possible targets – 7465 - 7600
Support – 7315 - 7360
Resistance – 7460 (ST)
Indicator support – CCi close to 0 cross – 38.2 fib area
Could we see a new leg higher on the FRA40? After Monday's holiday, price has opened lower on Tuesday, but there are a few bullish signs we are watching that could suggest a new push higher. Price formed an HL in the 38.2 fib area, support has been formed, and we see the support hold from a previous point of resistance. Price broke through the trendline, but we still need to see a new rally to confirm that.
A new lower that closes below support is worry and could invalidate the idea. Another factor is tomorrow's US CPI data. Depending on what’s released, this could impact US indices and, in turn, move European indices. The Core is expected to come in lower, with Y/Y flat at 5.0% and the M/M higher at 0.4%. The CPI data is due to be released at 8:30 am EST tomorrow.
Thanks for stopping by. Good trading, and have a great day.

DOW JONES Megaphone targeting 34350Dow Jones is on the 2nd bullish leg of a Megaphone pattern.
The wave started after a closing and rebound on the MA50 (1d).
Trading Plan:
1. Buy on the current market price.
Targets:
1. 34350 (top of the Megaphone).
Tips:
1. The RSI (4h) is identical to the RSI of the 1st Bullish Leg.
Please like, follow and comment!!
Notes:
Past trading plan:
DOW JONES Trade the breakoutDow Jones is rising after the sharp fall earlier today on a pattern that might be an emerging Channel Up.
The 1hour RSI got massively oversold at 13.50.
Buy if the price breaks over the Falling Resistance and target 34250.
Sell if the price breaks under Support A and target 33235 (Support B).
Previous chart:
Follow us, like the idea and leave a comment below!!

DOW JONES The MA100 (1d) is supportingDow Jones has been closing daily over the MA100 (1d) for the past month.
It is making Higher Highs since the March 20th bottom, indicating that the trend remains bullish.
Trading Plan:
1. Buy as long as the price holds Support (1).
2. Sell if it breaks under it.
Targets:
1. 34500 (Resistance 1 and Rising Resistance).
2. 32800 (MA200 1d).
Tips:
1. The RSI (1d) has been rejected on its MA level and is making Lower Highs. That shows a Bearish Divergence that may eventually favour a Support (1) break.
Please like, follow and comment!!
Notes:
Past trading plan:

DOW JONES This pull back is a great buy opportunity.Dow Jones is approaching the bottom of the 6 week Channel Up, the level that provided us with a low risk buy entry last time. The 4H technicals are in red (RSI = 36.764, MACD = 20.900, ADX = 24.648) and an oversold 4H RSI would be the ideal buy entry.
As long as the 1D MA50 holds, which is even under the S1 and the 4H MA200 (which is effectively the rising Support), we will stay bullish targeting the top of the R1 Zone (TP = 34,600). If the price breaks under the 1D MA50, we will hedge it with a sell, which we'll close at 32,500, near S2.
Prior idea:
## If you like our free content follow our profile to get more daily ideas. ##
## Comments and likes are greatly appreciated. ##

5-2-23 [dow jones]gm,,,
haven't been posting anything public lately - too busy with the private content.
----
created a few minute window today to write this up, and a few others.
----
i am envisioning a massive move to the upside on this dow jones index.
estimating for it to take out the all time highs.
> sounds bananas right?
> maybe to you, anon.
----
og post:
DOW JONES Small pull-back possible but bullish long-termOne and a half month ago we gave the most optimal buy entry for Dow Jones (DJI) exactly at the bottom of its 4-month Channel Down:
Right now the index is trading inside a shorter term Channel Up that is technically aiming at the 34900 Resistance, which is the December 13 2022 High, as part of its Higher Highs process. If however the 4H MACD currently completes a Bearish Cross, it is more likely to see one last pull-back below the 4H MA50 (blue trend-line) and near the 0.618 Fibonacci retracement level (33600) before the next rally.
-------------------------------------------------------------------------------
** Please LIKE 👍, FOLLOW ✅, SHARE 🙌 and COMMENT ✍ if you enjoy this idea! Also share your ideas and charts in the comments section below! **
-------------------------------------------------------------------------------
💸💸💸💸💸💸
👇 👇 👇 👇 👇 👇

nasdaq 4hour chart say= upper target is fibo161%, dont pick sellif you have old sell 100 close all now or hedge them ( lot = 1.5 * total sells)
AC indicator on daily chart is green this show up trend will come
we have 3 fibo 161% now ,,,first fibo 161% show short term target1 is 13600 (pick sell possible there after sell pinbar comes with SL n pinbar high) then nasdaq can go down but will start up trend to 14000 even 14600(daily chart fibo 161%(long term target)
ALERT= on bad news if nasdaq break EMA200 1hour (green line) it is switch signal to sell
i wish you best trade and win but with SL in last high/low ,,,,put,eat SL is base of this game
