BTC Next leg downI had a previous chart from early 2023 where I predicted BTC price movement based on previous cycles. (yellow bars)
In this chart I expected a double top around ~225k. We never reached that high and there have been many reasons for it over the past year especially. Sometime in 2025 when we hit our double top around ~125k I figured this was it. I adjusted the price estimation (yellow bars) down to match the new top.
The time axis was still pretty spot on. This is reinforced by the blue date range bars at the top as well. So I'd say we are getting ready for a big BTC sell off this year, heading toward mid ~30k
Downtrend

26/01/26 Weekly OutlookLast weeks high: $93,653.56
Last weeks low: $86,076.35
Midpoint: $89,864.96
As price sits at 2026 Yearly open levels the severity of the recent $98,000 rejection becomes even more clear for the direction of Bitcoins price.
The high time frame trend after the $98,000 rejection is a bearish one. The attempt to flip the 4H 200 EMA and use it as a launch failed with price falling back below it, confirmed by Fridays wick at $91,000 being pushed back down with force. From here the downward target would be Weekly low followed by $82,500.
The bulls have a buyside liquidity problem and with ETF flows turning negative, the short term does not look in their favor. The threat of another US Government shutdown would put further strain on the buyside demand as we saw previously during the October shut down of 2025, currently the odds of a shut down are at 70% on prediction markets. The bulls target remains the same as it has been since the start of the year, $98,000 must be flipped with price acceptance above to shift the HTF structure back in their favor.

Macro on Netflix - 7 month downtrend + Earnings + NewsI have my eyes on Netflix. A very popular stock globally, very FA strong.
It will be a macro analysis on Netflix with focus on higher timeframes with additions of lower timeframe mentions in an attempt to highlight potential swing trade areas or entry points. I will also discuss indicators, chart patterns, candle stick behavior and more.
I dont normally go into news or FA since its all priced into the charts in my opinion.
But i will say this, big news on Netflix and it hussling to gather cash for the potential Warner Bros acqusition. It shows that they mean business which is good for business and uptrends.
Since most people trade news + FA, it is something to consider. With Earnings today for Q4 and data suggestion positive earnings. This info could be used to predict potential price movement to Upside with an attempt to test or try to get back on the broken Uptrend Support trendline that was propping up its recent Uptrend.
Especially since Netflix has been on a downtrend for past 7 months. We are down roughly 34.00%. Probabilities of an uptrend increase , the longer the decline.
Questions im asking: how long the downtrend will continue? Where is the next Support area?
Is there signs in the lower timeframes of a potential bounce to test the recently broken Uptrend Support trendline.?
Netflix has a strong case for observation and attention at the moment.
Look for more posts and evidence as i continue to monitor Netflix.

Brent Oil M30 HTF Breakdown and Bearish Continuation Setup📝 Description
Brent Oil experienced a sharp impulsive sell from the HTF supply area, shifting momentum decisively bearish. The current price action is a corrective pullback into a lower-timeframe FVG, with no signs of structural recovery.
________________________________________
📈 Signal / Analysis
Primary Bias: Bearish while price remains below the M30 FVG and prior breakdown level
Preferred Setup:
• Entry: 63.38
• Stop Loss: Above 63.73
• TP1: 63.01
• TP2: 62.67
• TP3: 62.38 (HTF liquidity / FVG draw)
________________________________________
🎯 ICT & SMC Notes
• Strong impulsive sell confirms bearish order flow
• Current move classified as corrective retracement
• No bullish CHOCH or demand reaction confirmed
________________________________________
🧩 Summary
As long as price fails to reclaim the M30 FVG, the structure favors continuation toward lower liquidity targets.
________________________________________
🌍 Fundamental Notes / Sentiment
With easing geopolitical tensions, the risk premium priced into oil is likely to unwind. In the absence of supply disruption fears, Brent faces downside pressure, keeping lower prices favored as the market rebalances.
________________________________________
⚠️ Risk Disclosure
Trading involves substantial risk and may result in capital loss. This analysis is for educational purposes only and does not constitute financial advice. Always apply proper risk management, predefined stop-loss levels, and disciplined position sizing aligned with your trading plan.

Making HH HL.NML Analysis
Closed at 194.73 (15-01-2026)
Making HH HL.
187 - 193 may act as an Immediate Support.
However, Crossing & Sustaining 206 - 207 with
Good Volumes may lead it towards 230+
it should not break 169 this time.

Ethereum Stuck Below Trendline — Bearish Pressure Price is continuing to respect the descending trendline and trading below the EMA, confirming a sustained bearish market structure. Recent bullish attempts have failed near the trendline, showing clear seller defense and lack of upside follow-through.
As long as price remains capped below 3,140–3,160, any bounce is likely corrective and vulnerable to renewed selling pressure.
A bearish continuation below 3,100 keeps downside targets active toward 3,050 → 3,000, with a deeper liquidity objective near 2,970–2,960. Only a decisive breakout and close above the descending trendline would invalidate the bearish scenario and signal a potential trend shift.

Market Structure ExplainedHello, traders! 😎
Understanding market structure is key to consistent profits. If you’re not paying attention to how price moves, you’re essentially flying blind. Let’s break it down to help you navigate the market like a pro.
Price Structure: The Backbone of Price Action
Market structure is how price behaves over time, forming the foundation for all trading decisions. It's based on a few core principles: higher highs and higher lows in an uptrend, and lower highs and lower lows in a downtrend. This structure is confirmed through price action and key indicators like moving averages, support and resistance levels, and trendlines.
In an uptrend, the price pushes higher with each rally, creating higher highs and higher lows. This signals bullish momentum, and traders look for breakouts above resistance levels or retest entries at support. Tools like the 50-period moving average (MA) or EMA can act as dynamic support, confirming trend strength. The RSI (Relative Strength Index) helps confirm that the trend is not overbought and has room to run.
In a downtrend, lower highs and lower lows show that sellers are in control. Price breaks through support levels, and corrective rallies face resistance at lower highs. Traders look for retracements, often at key Fibonacci levels, before continuing lower. The MACD (Moving Average Convergence Divergence) confirms the bearish momentum when both the MACD and signal lines trend downward.
Trend vs. Range: The Battle of Market Phases
Trends occur when price moves clearly in one direction, either up or down. Traders love trends because they offer opportunities to ride the price movement for profits. However, sometimes the market enters a range or consolidation phase, where price bounces between support and resistance with no clear direction. In this phase, price moves in an impulse (fast movement) and correction (pullback) pattern, before potentially resuming the trend.
Trend Structure: Knowing When the Market is Shifting
In an uptrend, price makes higher highs and higher lows. When this structure changes—higher highs turn to lower highs and higher lows disappear—that’s a sign of a possible reversal or consolidation.
In a range, price consolidates and waits for the next move. A breakout from the range signals a shift in structure and could lead to the start of a new trend.
Understanding market behavior, whether in a trend or range, is crucial. Recognizing when the market is trending or consolidating helps you navigate price action effectively. Stick to the structure, and you'll stay on track through market moves 🔄
That said, markets are unpredictable. Always rely on your judgment, conduct thorough research, and have a solid plan in place before making any decisions. Make sure to do your homework and be prepared 🙂↕️

Nifty shown strong down Trend but this zones are important why ?What trade I have taken and how I have predicted ?

DowJones US30📊 $DowJones ( CAPITALCOM:US30 ) Technical Analysis (4H Timeframe)
The overall trend for the Dow Jones remains bullish, as the price continues to form a structure of higher highs and higher lows 📈. The index is trading well above the upward-sloping EMA 200 (black line), which serves as the primary trend confirmation. While the price recently experienced a minor correction (Wave 5), it found immediate support at the EMA 50 (red line), which is currently trending upwards and acting as dynamic support. The momentum is characterized by strong bullish candle bodies during the impulsive phases, indicating high demand. As long as the price sustains its position above the 48,800.0 USD structural support, the path of least resistance remains to the upside 🚀.
🔑 Key Levels to Watch:
Major Upside Target: 50,150.0 USD (Psychological Resistance) 🚩
Intermediate Target: 49,400.0 USD (Recent Peak) 🎯
Immediate Support: 48,800.0 USD (Grey Box / Flip Zone) 💡
Dynamic Support: 48,256.0 USD (EMA 50 Area) ⚡
Structural Support: 47,820.0 USD & 47,323.6 USD (Grey Box / EMA 200) 🛡️
Primary Demand Origin: 46,870.0 USD & 45,420.0 USD (Major Grey Boxes) 🏗️

ATOM / USDT – Weekly OutlookATOM is still trading in a long-term downtrend, but price is currently resting on a major historical support zone.
Market Structure
Clear sequence of lower highs, confirming bearish structure
Strong support zone that has been defended multiple times in the past
No confirmed trend shift yet
Key Zones
Support: current range where price is consolidating
Resistance: previous support that must be reclaimed and held
Above resistance, upside momentum can accelerate
Scenario
As long as support holds, a relief bounce is possible
Rejection at resistance would confirm trend continuation
Only a clean reclaim and hold above resistance would signal trend reversal
Do you expect ATOM to bounce from support or continue lower?
MrC

DOW/US - PATIENTLY WAITING FOR THE RIGHT PRICETeam, as discussed last week in our community
I was expecting the DOW/US30 to reach low 48155, however it has drop low at 49089
We are going LONG at 48122 STOP LOSS at 48035
Target 1 at 48250-24285
Target 2 at 48350-48415
PLEASE NOTE if the downside drop at 47800 - I will double the volume on LONG..
LETS GO

BTC/USD Cycles, downtrends and uptrendsIf we look at the BTC/USD 6 Month Chart. We can see that BTC is still following its 730/731 day cycle. Almost like clockwork. Follow the Sign Wave Pattern up and down, you will see that it's been very accurate. I made the original version of the chart way in Dec 27, 2022, which you can see on the link.
Looking at the history of this chart, we can see that after various major increases and uptrends, BTC has always delivered a roughly ~72% to ~87% retrace roughly lasting Two or Three 6 Month Candles before continuing on to a make a new All Time High.
BTC had been in an uptrend for 3 long years and has very likely peaked for this Cycle. So what do I think will happen?
Shaded White area is where I think BTC will go with either a total
-70% drop to ~$37,931.
or resistance found at either ~$48,384 to ~32,061.
Alternatively:
Dashed Line =
-80% drop to ~$25,148
Dotted White Line =
-87% drop to ~$15,551
If BTC/USD continues to follow the 730/731 day cycle for this downtrend, then we can expect BTC to recover within either the 6 Month Candle that starts Wednesday 1st Jul 2026 or within the 6 Month Candle that starts Friday 1st Jan 2027. After this Downtrend, BTC should make a new All Time High within the 6 Month Candle that starts Sunday 1st July 2029, after that, it’s another year to a year and a half downtrend until the 6 Month Candle that starts Wednesday 1st Jan 2031. And so on, and so on.
I hope this is helpful.

BTC Weekly more downside likelyBTC is currently holding support on the 100 sma on the weekly chart. Volume has been increasing as the downtrend progresses signaling increased selling pressure. I think the next weekly candle open will break below the 100 sma and go to test the next support area around 71,500. Not financial advice, do your own dd.

BTCUSDT – Downtrend - The Market Enters a Critical TestBitcoin is losing bullish momentum and gradually shifting into a phase dominated by selling pressure. After multiple failed recovery attempts, BTCUSDT is showing clear signs of buyer fatigue as short-term capital pulls back and risk-off sentiment spreads across the market.
From a market context perspective, caution is prevailing as investors wait for key U.S. economic data. The U.S. dollar is showing signs of recovery, while Treasury yields stabilize, reducing the appeal of risk assets like Bitcoin in the short term. As a result, speculative flows have become more defensive.
On the price chart, the short-term bullish structure has been broken. Bitcoin continues to form lower highs, signaling that sellers are taking control of price action. Recent rebounds are weak and purely technical, quickly met with selling pressure—typical behavior during the early stages of a developing downtrend.
Notably, key support zones below are being gradually eroded. A clear break of these levels could trigger stop-loss cascades, accelerating the downside move. In this environment, attempting to catch the bottom carries significant risk.
From a trader’s perspective, selling on pullbacks remains the preferred strategy. Trading in alignment with the prevailing trend, maintaining strict risk management.

15/12/25 Weekly OutlookLast weeks high: $94,590.52
Last weeks low: $87,581.21
Midpoint: $91,085.87
A volatile yet directionless FOMC week comes to a close and a new week begins. As forecast the Fed cuts interest rates by 25bps, now at 3.75% (a 3-year low). Bitcoin reacted to the news with LTF volatility but in the end no direction as this cut had been forecast and priced in.
The weekly clearly capping any bullish move, multiple rejections from $94,500 with higher lows compressing price. Historically this compression pattern leads to an impulse move in a given direction. given what we have seen around the weekly high, if price cannot flip this level ($94,500) a continuation of the downtrend may be next as the bears are looking stronger as it stands. My key levels to look for are $84,000, $80,000 and $74,000. Should the weekly high be flipped and reclaimed $100,000 is the major test of resistance.
I am not sure if this week is too early to get our answer but I am planning for what the chart tells me. Until we get a confirmation on HTF direction the range is clear on the LTF.

DOW/US30 - OVER BOUGHT Team, I hope you recall the trade last 3 days ago about OPPORTUNITY OF BEAUTIFUL CHART
Since then, it has been running up over 1400 points in 3 days.
Now I find myself in a good time to SHORT, with 3-4 confluences to make that decision.
1- 1400 points up in 3 days, (2 days up because of RATE cut)
2 - Daily chart indicates overbought
3 - NEW ATH
Therefore, we expect a small retracement.
SHORT range at 48787 - 48850 - STOP LOSS above 50050
Target 1 at 48715-48650
Target 2 at 48600-48550
Target 3 at 48412-48350
LETS GO

How To Decide Short Trade In US500 IndexThis video explains how we decide a short trade in the US500 index by observing price behavior and market structure. The analysis focuses on how the US500 reacted from a defined supply zone, how momentum shifted, and what signals indicated a potential downside move. The goal of this breakdown is to show the process of identifying structure, reaction points, and momentum changes using pure price action.
This content highlights how supply zones, rejection behavior, and momentum alignment can help understand possible short-side opportunities—purely from an educational and analytical perspective, without offering any trading advice.

DOW/US30 - BEAUTIFUL CHART Team, I am looking at the US30/DOW - whatever you call it
look beautiful on the 5/15 minutes channel
Sorry, i been too lazy to post because lately I've been doing scalping
I am about to prove another challenge where $1000 turns into a million
Last account $1000 turned into 100k, took 6 months
But this challenge, I am not sure.
Anyway lets focus on the trade right now
the price is 47590-99 - long entry
STOP LOSS at 47550
Target 1 at 47650-47666
Target 2 at 47701-47715
Target 3 at 47760-47781
LETS GO
BTC will drop soon....this is massively manipulatedThis may be related to the potential rate cuts which is being "priced in," but nothing fundamentally is improving BTC position and it still doesn't solve any real problems and will go back to 80k or even lower real soon. Retailers will jump in as exit liquidity and will get wiped out when it drops back from the massive losses taking place. Great to time to get into MSTZ! Easy 5-10% upside IMHO....

AMD — WEEK 49 TREND REPORT | 12/03/2025AMD — WEEK 49 TREND REPORT | 12/03/2025
Ticker: NASDAQ:AMD
Timeframe: WEEKLY
This is a reactive structural classification of AMD based on the weekly chart as of this timestamp. Price conditions are evaluated as they stand — nothing here is predictive or forward-assumptive.
⸻
1) Current Trend Condition [ Numbers to Watch ]
• Current Price @ 216$
• Trend Duration: +0 weeks (Bearish)
• Trend Reversal Level (Bullish): 230.68$
• Trend Reversal Level (Bearish Confirmation): 191.07$
• Pullback Support : 217.79$
• Correction Support : 179.09$
⸻
2) Structure Health
• Retracement Phase:
Correction (approaching 61.8%)
• Position Status:
Healthy (price above both structural layers)
⸻
3) Temperature :
Cooling Phase
⸻
4) Momentum :
Neutral
⸻
5) Market Sentiment
Bullish
⸻
Author’s Note
This analysis is fully reactive, not predictive. Market conditions, trend structure, and behavior are classified as they appear in real time. The objective is to identify where directional shifts first occurred, where structural integrity remains intact, and where it would begin to weaken if key levels were breached.
Predictive analysis projects outcomes that do not exist yet. Without price confirmation, prediction is built on baseless assumptions. This framework avoids that entirely by responding only to verified structural changes and live conditions.
The levels shown simply identify where the current trend structure first shifted and where it would begin to lose integrity if breached. Recognizing these boundaries allows for clearer interpretation of market behavior without relying on forward guarantees, speculative projections, or unsupported assumptions.
⸻
Methodology Overview
This classification framework evaluates directional conditions using internal trend-interpretation logic that references price behavior relative to its structural layers. These relationships are used to identify when price movement aligns with the framework’s criteria for directional phases, transition points, or regime shifts. Visual elements or structural labels reflect these internal interpretations, rather than explicit trading signals or preset indicator crossovers. This framework is observational only and does not imply future outcomes.

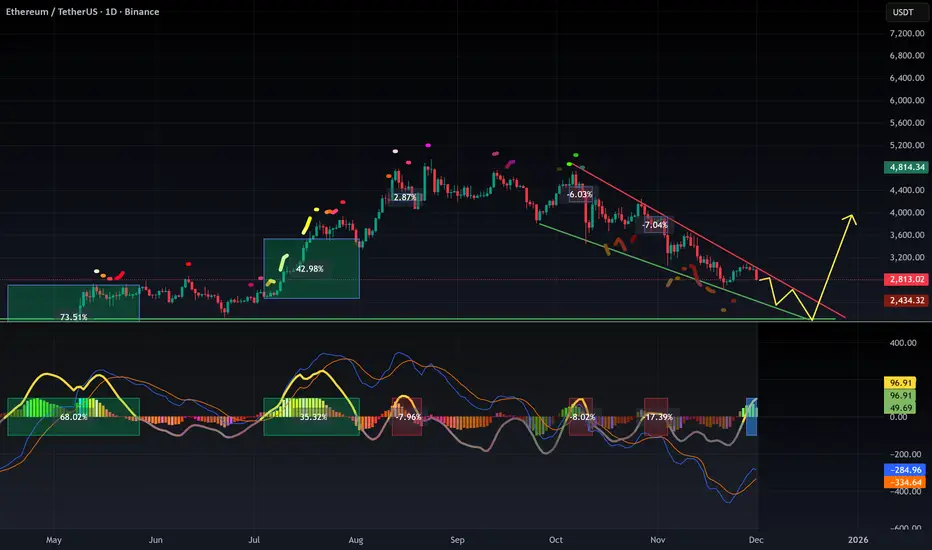
$ETH: Ethereum seems to be pointing toward a bottom at $...What I’m seeing on the daily chart is pretty clear:
The MACD is already deeply oversold, yet Ethereum continues to fall. Normally, such a setup would trigger a technical rebound — but the price action is not following.
This tells us one thing: bearish absorption.
Whales are unloading into every attempt to push upward, absorbing the buys and slowly forcing the price down. The ETH being sold is still changing hands, and until this process completes, CRYPTOCAP:ETH remains pressured to the downside.
Because the MACD is extremely oversold, we should expect some technical bounces — but opening a long here is extremely risky. Patience is better than gambling in a downtrend without support beneath your feet.
Right now, $2100 looks like the strongest support zone and a likely level for a meaningful bounce.
But in a broader bearish environment, even that bounce could just be a short-term relief before a new leg down or a reaccumulation phase.
So there’s no need to rush or FOMO into every green candle.
Bounces are normal — the trend remains bearish until ETH reaches the demand zone around $2100.
And if ETH doesn’t react at that level… that would be a very bad signal.
Statistically, $2100 has a high probability of being reached and acting as a solid reaccumulation zone.
DYOR
#Ethereum #ETH #CryptoAnalysis #TechnicalAnalysis #Altcoins #CryptoTrading #MACD #PriceAction #BearishTrend #SupportZone #CryptoMarket #BTC #CryptoNews
BTC pump is a short squeeze....watch outNo one is buying the "dip" esp when it's on a massive downward trend. What we're witnessing is a classic short squeeze, which won't last long. Do not expect this to keep just going up because it likely won't and back to low 80k or below. Best of luck and always do your own due diligence!

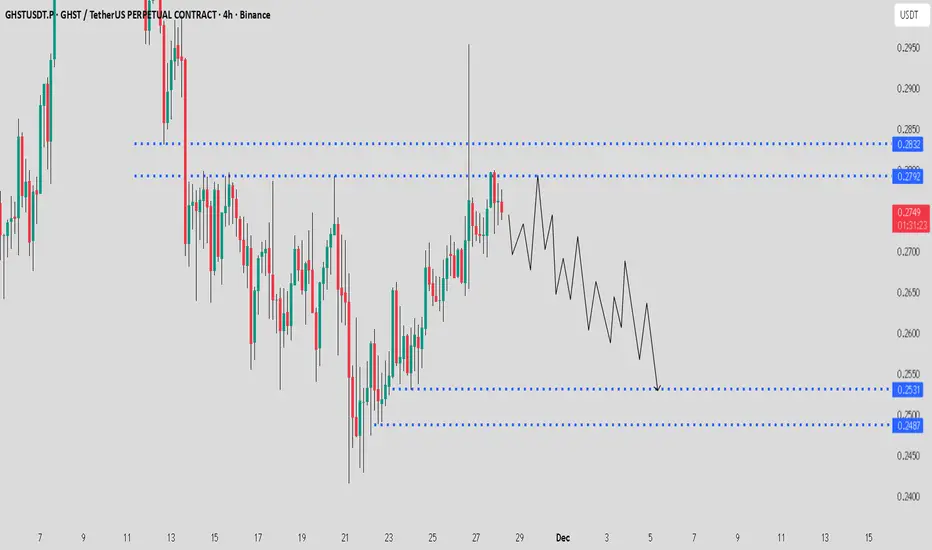
GHST / USDT Weak below FVG resistance_More downside expectedGHST / USDT is showing weakness after rejecting from the FVG resistance. Price is likely to move towards the $0.2530 – $0.2487 zone before any potential reaction. This area remains the safer zone for taking profit on shorts. More downside is still possible, so manage risk and keep stops above the upper marked level.