Dow Jones - DJI 20 March - 24 March Pair : Dow Jones - DJI30
Description :
Impulse Correction Impulse
Break of Structure
Flag Pattern
Bearish Channel in Long Time Frame and Short Time Frame as an Corrective Pattern
Divergence
Completed " 12345 " Impulsive Wave " ABC " Corrective Wave
Dowsignals

DOW JONES is forming a bottom, aiming at the 1D MA50 again.Dow Jones (DJI) is trading sideways for the 4th straight 1D candle on the bottom (Lower Lows trend-line) of the long-term Channel Down. As the 1D RSI touched the 30.00 oversold level and rebounded, similar to the September 27 bottom, while the 1D MA50 (blue trend-line) crossed below the 1D MA100 (green trend-line) to form the 1st Bearish Cross since that bottom, we treat this as a strong medium-term buy opportunity, targeting the 1D MA50 and 33100. We need a closing above the 1D MA50 to justify further uptrend as that level rejected the index on March 06.
-------------------------------------------------------------------------------
** Please LIKE 👍, FOLLOW ✅, SHARE 🙌 and COMMENT ✍ if you enjoy this idea! Also share your ideas and charts in the comments section below! **
-------------------------------------------------------------------------------
💸💸💸💸💸💸
👇 👇 👇 👇 👇 👇

DOW JONES Don't get confused.It's starting a new multiyear rallyThis is a chart we've looked into in the recent past for Dow Jones (DJI) but amidst the recent uncertainty, we think it is necessary to refresh in order to keep things into a longer term perspective.
The time-frame is the 1W (weekly) where Dow is seen forming an Arc pattern on the 1W MA50 (blue trend-line), which since the 2009 housing crisis bottom, has formed every time it corrected on the 1W MA200 (orange trend-line) and rebounded (excluding of course the March 2020 COVID crash). On both of these occasions, this Arc pattern was an Accumulation Phase before a new multi-year rally.
The 1W RSI is also on a familiar pattern with those prior fractals, forming an Arc construct on a Lower Highs trend-line. Is this the final accumulation before Dow starts a new multi-year rally?
-------------------------------------------------------------------------------
** Please LIKE 👍, FOLLOW ✅, SHARE 🙌 and COMMENT ✍ if you enjoy this idea! Also share your ideas and charts in the comments section below! **
-------------------------------------------------------------------------------
💸💸💸💸💸💸
👇 👇 👇 👇 👇 👇

DOW JONES Any doubt we are completely off Bear limits anymore?This Dow Jones (DJI) from the start of the 2022 Bear Cycle until today with the 2007 - 2009 (Housing Crisis) Bear Cycle fractal plotted on it. As you see up until the mid October bottom, the two sequences practically traded in an identical way. Since then however, Dow has completely diverged from the 07/09 fractal and despite the late weakness, it is hard to claim that we are still in Bear Cycle territory.
Is there any doubt we are off Bear limits anymore?
-------------------------------------------------------------------------------
** Please LIKE 👍, FOLLOW ✅, SHARE 🙌 and COMMENT ✍ if you enjoy this idea! Also share your ideas and charts in the comments section below! **
-------------------------------------------------------------------------------
💸💸💸💸💸💸
👇 👇 👇 👇 👇 👇

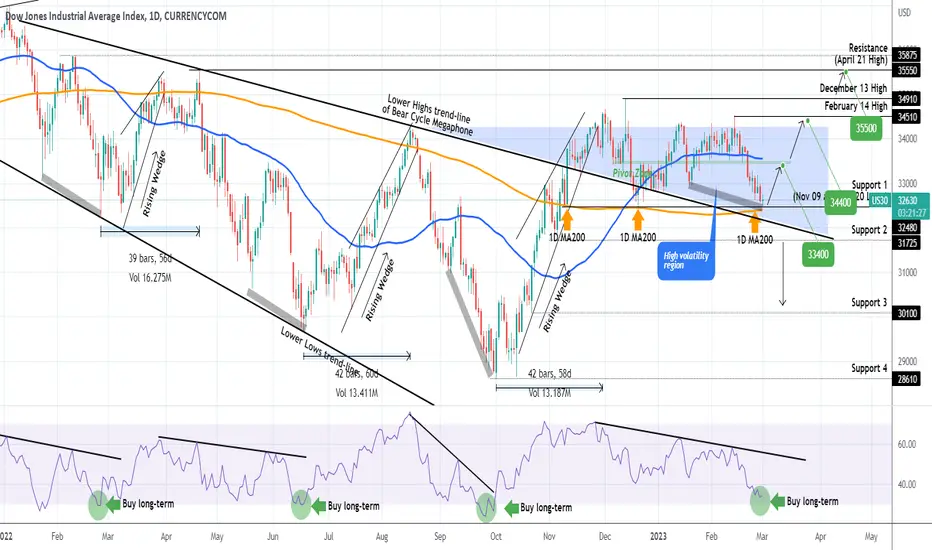
DOW JONES This is the bottom. Fractals from 2022 confirm.Not surprisingly to us, Dow Jones has stayed inside the High Volatility region that we have identified back in late November:
The 1D MA200 (orange trend-line) has supported twice already since November 10 and is now going for its 3rd hold. If we pay a closer attention to the 1D RSI we see that it has printed the very same pattern it made on all Lows during the 2022 Bear Cycle. That is basically 3 occasions. The RSI is very close to the 30.00 oversold barrier and as the 1D MA100 supports, it makes it the most optimal long-term buy level on a 2-month horizon.
Even though it has been mostly trading sideways within the High Volatility Zone, on RSI terms, it is comparable to all 2022 Lows that bottomed out on an oversold 30.00 1D RSI and started an aggressive rally in the form of a Rising Wedge.
Our Targets are: short-term = 33400 (Pivot Zone), medium-term = 34400 (February 14 Resistance), long-term 35500 (April 21 Resistance).
-------------------------------------------------------------------------------
** Please LIKE 👍, FOLLOW ✅, SHARE 🙌 and COMMENT ✍ if you enjoy this idea! Also share your ideas and charts in the comments section below! **
-------------------------------------------------------------------------------
💸💸💸💸💸💸
👇 👇 👇 👇 👇 👇
DOW30- Will CPI data trigger a break and a push above 35k?After the double bottom under 29k and a break above descending trend line resistance, Dji has started to consolidate (as if it was waiting for Nas100 and SP500 to catch up, and now are all aligned:) ).
Technically, the picture is bullish and crystal clear, with a price waiting for a trigger to break above the triangle's resistance.
CPI could provide this trigger and, in such an instance, bulls could push Dow above 35k.
P.S: I don't think we are out of the woods and this optimism will last, but I've learned to now argue with the market

DOW JONES Scalping range emerged and our medium-term plan.Dow Jones (DJI) got rejected yesterday following Powell's speech as the Resistance Zone of 34300 - 34370 held (August 16 and January 15 Highs respectively), we expect it to turn neutral for a while and trade sideways within the rough 33640 - 34180 Scalping Range illustrated on the chart.
The 4H MA50 (blue trend-line) has assumed the role of the Pivot and the 4H MA200 (orange trend-line) that of the Support. Our short-term trading plan is to scalp this range for as long as the price remains/ re-enters inside it. On the more medium-term, above the green Pivot Zone we are buyers targeting 34300, while below the Higher Lows trend-line we are sellers targeting 32700 (above the 32480 Support). Similarly, we will take the buy break-out if the price breaks the 34370 January 15 High and target the 34910 December 13 High.
Keep in mind that this Higher Lows trend-line is what helped us take this accurate buy entry 3 weeks ago as you can see on the chart below:
-------------------------------------------------------------------------------
** Please LIKE 👍, FOLLOW ✅, SHARE 🙌 and COMMENT ✍ if you enjoy this idea! Also share your ideas and charts in the comments section below! **
-------------------------------------------------------------------------------
💸💸💸💸💸💸
👇 👇 👇 👇 👇 👇

NDQ/DJI - Short; Significant Statistical Arbitrage opportunity!While the NDQ/DJI, itself, represents a significant trade opportunity here, even more notably, a number of the index components display remarkably skewed "Greeks"! (For example, APPL-GOOGL, CAT-PEP, TSLA-BA, etc..) E.g., It is a rather strait forward process - at these levels - to assemble baskets of stocks (Long) in each index (Short) with rather juicy, +30%-40% near term (<7 months!) profit targets.
All this is a strait forward process - once one starts looking :-)
p.s. Will provide ideas for some of these stock baskets if/as time allows.

DOW JONES A mix of patterns ahead of the Fed!The Dow Jones Industrial Average (DJI) has made a strong medium-term rise since our buy signal 12 days ago:
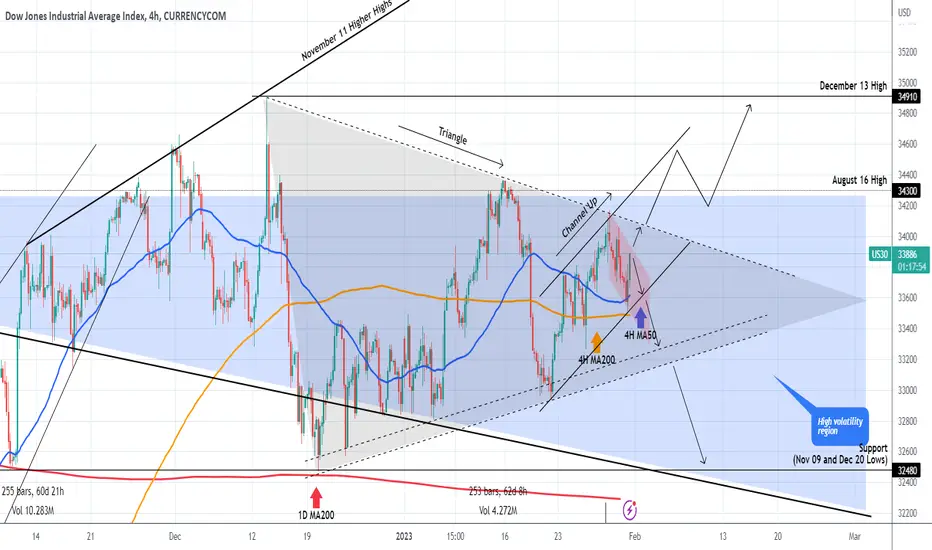
Still within the High Volatility region, hence neutral long-term, the price is rising today after finding Support within the 4H MA50 (blue trend-line) and 4H MA200 (orange trend-line). The medium-term pattern is a Triangle, the short-term a Channel Up.
However the price needs to break above the 2 day Channel Down (red) in order to test the top of the Triangle and if broken extend the Channel Up into the medium-term to test the 34910 December High.
A break below the Channel Up, should extend the red Channel Down towards the bottom of the Triangle again.
-------------------------------------------------------------------------------
** Please LIKE 👍, FOLLOW ✅, SHARE 🙌 and COMMENT ✍ if you enjoy this idea! Also share your ideas and charts in the comments section below! **
-------------------------------------------------------------------------------
💸💸💸💸💸💸
👇 👇 👇 👇 👇 👇
DOW JONES The High volatility zone continues to pay offThe Dow Jones Industrial Average (DJI) followed our previous call (almost) 3 weeks ago to perfection as after trading within the Triangle, it broke to the upside and hit the 34300 target:
The strong rejection of this week simply validates the argument that we've made since November, that the blue zone will be a High Volatility region for Dow as it is a confluence of major Support (Bear Cycle Lower Highs trend-line), Resistance (34300 August 16 High) and MA levels (1D MA300 and 1D MA50 (yellow and blue trend-lines respectively)).
It is now testing the (dashed) Higher Lows trend-line, which if successful can make another trip to 34300. But if it doesn't hold, the real medium-term Support Zone is within the former Lower Highs trend-line and (mostly) the 1D MA200 (orange trend-line), which has already held once successfully on December 20. A break below targets the 31725 Support (1) first and (on a much less likely scenario) the 30100 Support (2) in extension.
But why give away our 1D RSI blue-print and the symmetricality of each bullish - bearish phase that has been holding exceptionally well since the February 24 2022 bottom? As we explained in detail in our previous analysis, each bearish phase has been around 250 (4H) candles i.e. roughly 60 days. Considering that this is not a Bear Cycle bearish leg as it is obviously more sideways than making Lower Lows, we should be seeing an end of this phase by the 2nd week of February, if not earlier.
Based on the 1D RSI though, it has already started to form the bottoming process (green rectangle) as shown by the previous sequences. As a result, investors should be more patient with such drops and willing to buy the pull-back at this stage, than looking to short to Lower Lows.
-------------------------------------------------------------------------------
** Please LIKE 👍, FOLLOW ✅, SHARE 🙌 and COMMENT ✍ if you enjoy this idea! Also share your ideas and charts in the comments section below! **
-------------------------------------------------------------------------------
💸💸💸💸💸💸
👇 👇 👇 👇 👇 👇

DOW JONES On familiar 1W MA50 Support, ready for a +50% rally.The Dow Jones Industrial Average (DJI) has been holding the 1W MA50 (blue trend-line) as Support, closing all weekly candles above it since November 07 2022. This on its own is a major bullish pattern, but if we look on a much long-term, decade long perspective, we can see an even higher significance it historically has on the price action.
As you see on this 1W time-frame, ever since Dow's recovery from the 2008/09 Housing Crisis and the first touch of the 1W MA200 (orange trend-line) on August 2011, every time it bounces and recovers the 1W MA50, holding it as Support (blue circles), the index has grown from that bottom to the next top a minimum of +50% (with 55% of January 2018 being the maximum).
At the same time, the 1W RSI breaks above a Lower Highs trend-line. This time the RSI broke and even held and bounced off that Lower Highs trend-line (green arrow).
This chart shows that Dow Jones is no stranger to this pattern and technically, as long as the 1W MA50 holds, we should be treating it as a major bullish signal. A potential new +50% 2-3 year rally puts the target at 49000.
-------------------------------------------------------------------------------
** Please LIKE 👍, FOLLOW ✅, SHARE 🙌 and COMMENT ✍ if you enjoy this idea! Also share your ideas and charts in the comments section below! **
-------------------------------------------------------------------------------
💸💸💸💸💸💸
👇 👇 👇 👇 👇 👇

DOW JONES Will it invalidate the 2022 bearish fractal?The Dow Jones Industrial Average (DJI) has been stuck within a Triangle pattern (dashed lines) since it hit and bounced on the 1D MA200 (orange trend-line) on December 20 but has a clear rejection on the 4H MA100 (green trend-line), which is the short-term Resistance. At the same time we can also see that the 1D MA300 (yellow trend-line) has also resumed its old role as a Resistance, having kept the index below it form April 22 to November 10 earlier this year.
The 1D MA50 (blue trend-line) is now the pivot but technically in 2022 when it broke as Support, Dow kickstarted major sell-offs. Both on April 22 and August 28, the major sell-off were confirmed and Dow extended the selling to a new market (Lower) Low.
This is however the first time since December 20 2021, so basically a whole year, that the 1D MA200 is acting as a Support. At the same time, the RSI on the 1D time-frame is more similar to the May 20 and September 27 lows.
As a result we have technical proof to believe that as long as the 1D MA200 holds, Dow Jones has more probabilities to attempt a test on the 34300 former Resistance (August 16 High) and then move for the 34910 December 13 High. Closing above the 4H MA100 will confirm this move.
A closing below the 1D MA200 however has more chanced of testing the 31725 (Support 1) and 30100 (Support 2) levels successively.
Notice how proportional the Bottom-to-Top and Top-to-Bottom sequences have been since the February 24 Low. If the symmetry continues to hold and of course assuming Dow breaks below the 1D MA200, the next low should be around early February 2023.
-------------------------------------------------------------------------------
** Please LIKE 👍, SUBSCRIBE ✅, SHARE 🙌 and COMMENT ✍ if you enjoy this idea! Also share your ideas and charts in the comments section below! This is best way to keep it relevant, support me, keep the content here free and allow the idea to reach as many people as possible. **
-------------------------------------------------------------------------------
You may also TELL ME 🙋♀️🙋♂️ in the comments section which symbol you want me to analyze next and on which time-frame. The one with the most posts will be published tomorrow! 👏🎁
-------------------------------------------------------------------------------
💸💸💸💸💸💸
👇 👇 👇 👇 👇 👇

DOW JONES Can the 1st Golden Cross since Aug 2020 save the day?Yes the Dow Jones Industrial Average Index (DJI) formed a Golden Cross on the 1D time-frame (1D MA50 (blue trend-line) crossing above the 1D MA200 (orange trend-line)) for the first time since August 05 2020 (!) with the price approaching today the 1D MA50, the closest it has been since October 24. Can this provide Support and save the day for Dow preventing it from having a similar sell-off as in August - September and May - April?
Well we have to look at it step by step. As long as the price closes daily above the 1D MA50, we have a positive sign that the market treats it as Support. At the same time closing above the former Lower Highs trend-line (since the January 04 High) puts additional buying pressure. That will help at forming a Megaphone pattern (green dashed lines), which can be the necessary transition tool that offers the needed pull-back on profit taking and takes the index into the new Bull Phase.
At the same time keep an eye on the 1W MA50 (red trend-line), which was previously the Resistance of most of the 2022 correction and made the August 16 rejection. Prior to the 2022 correction, the 1W MA50 has been the absolute Support of the 2021 rally. If all the above keep supporting, we can expect Dow to test the 35550 (April 21 High) Resistance by the end of January.
On the other hand, a closing below the 1D MA200 will most likely initiate a sell-off that will reach at least as low as the 0.618 and 0.786 Fibonacci levels, similar to what happened in September and April.
Additionally, the RSI on the 1W time-frame got rejected on the Higher Highs trend-line that since February has caught all major peaks. It can be used as a very effective buy indicator as well as its Higher Lows trend-line has also caught all major Lows since May 23. On a side-note, this 1W RSI Channel Up can be a major bullish divergence signifying the trend change to long-term bullish.
-------------------------------------------------------------------------------
** Please LIKE 👍, SUBSCRIBE ✅, SHARE 🙌 and COMMENT ✍ if you enjoy this idea! Also share your ideas and charts in the comments section below! This is best way to keep it relevant, support me, keep the content here free and allow the idea to reach as many people as possible. **
-------------------------------------------------------------------------------
You may also TELL ME 🙋♀️🙋♂️ in the comments section which symbol you want me to analyze next and on which time-frame. The one with the most posts will be published tomorrow! 👏🎁
-------------------------------------------------------------------------------
💸💸💸💸💸💸
👇 👇 👇 👇 👇 👇

DOW JONES Has the narrative changed to bullish?The Dow Jones Industrial Average (DJI) has entered into a new short-term pattern on the 4H time-frame, a Bullish Megaphone. The 4H MA100 (green trend-line) is the pivot right in the middle of it and the short-term Support is the 1D MA300 (yellow trend-line), once a long-term Resistance which rejected the previous High on August 16.
Almost two months ago with our October 20 analysis, we argued why the trend has changed to bullish and if Dow broke above the 1D MA300, it would restore it on the long-term as well:
Is that still the case? In our view yes, especially when we see formerly bearish patterns on the 1D RSI and MACD indicators, turned to bullish. As you see we are at a point on the 1D RSI (blue circle) where the price was already below the 1D MA50 (blue trend-line) on April 26 and with the 4H MA100 as the Resistance was trending downwards. Same with the 1D MACD, which is so far ignoring the Bearish Cross. So instead of those indicators turning the price bearish, we are above the 1D MA300 and the 1D MA200 (orange trend-line) within a Bullish Megaphone. The once bearish narrative seems to have changed to bullish.
So what now? The 1D Golden Cross (MA50 crossing above the MA200) is the first such bullish formation since August 05 2020, back in the period when Dow Jones was recovering from the COVID pandemic crash. This means that as long as the 1D MA50/200 Support, we can buy the pull-backs and gradually target new Highs. Our next target is the 35550 (April 21 High) Resistance. Only break below the 1D MA50 and subsequent rejection upon testing it as a Resistance, will be a bearish signal, potentially going all the way back to 29000.
-------------------------------------------------------------------------------
** Please LIKE 👍, SUBSCRIBE ✅, SHARE 🙌 and COMMENT ✍ if you enjoy this idea! Also share your ideas and charts in the comments section below! This is best way to keep it relevant, support me, keep the content here free and allow the idea to reach as many people as possible. **
-------------------------------------------------------------------------------
You may also TELL ME 🙋♀️🙋♂️ in the comments section which symbol you want me to analyze next and on which time-frame. The one with the most posts will be published tomorrow! 👏🎁
-------------------------------------------------------------------------------
💸💸💸💸💸💸
👇 👇 👇 👇 👇 👇

DOW JONES ready to rally! Inflation peaked on a 100 year line!The Dow Jones index (DJI) has been on an enormous rise since late September that even made a Higher High above the 2022 descending Resistance. With inflation being the main catalyst of this 2022 correction, it should come as no surprise that when it normalizes, the index can start seeing growth again.
Well on July the Inflation Rate (USIRYY) got rejected on its most important Resistance level, the Lower Highs trend-line that has been in place since May 1920! This 100 year old trend-line has had another 2 rejections on inflationary peaks (February 1947 and March 1980).
As this chart shows, every inflation drop from a Lower Highs peak was followed by a multi-year rally on Dow Jones, essentially a new expansion period. An exception parhaps was May 1920 when DJI continued to fall for another year, despite a massive correction on Inflation.
As a result, if this Inflation rejection is sustainable and is the start of a major correction, it is more likely to see the stock market rally and enter a new period of growth.
What do you think?
-------------------------------------------------------------------------------
** Please LIKE 👍, SUBSCRIBE ✅, SHARE 🙌 and COMMENT ✍ if you enjoy this idea! Also share your ideas and charts in the comments section below! This is best way to keep it relevant, support me, keep the content here free and allow the idea to reach as many people as possible. **
-------------------------------------------------------------------------------
You may also TELL ME 🙋♀️🙋♂️ in the comments section which symbol you want me to analyze next and on which time-frame. The one with the most posts will be published tomorrow! 👏🎁
-------------------------------------------------------------------------------
💸💸💸💸💸💸
👇 👇 👇 👇 👇 👇

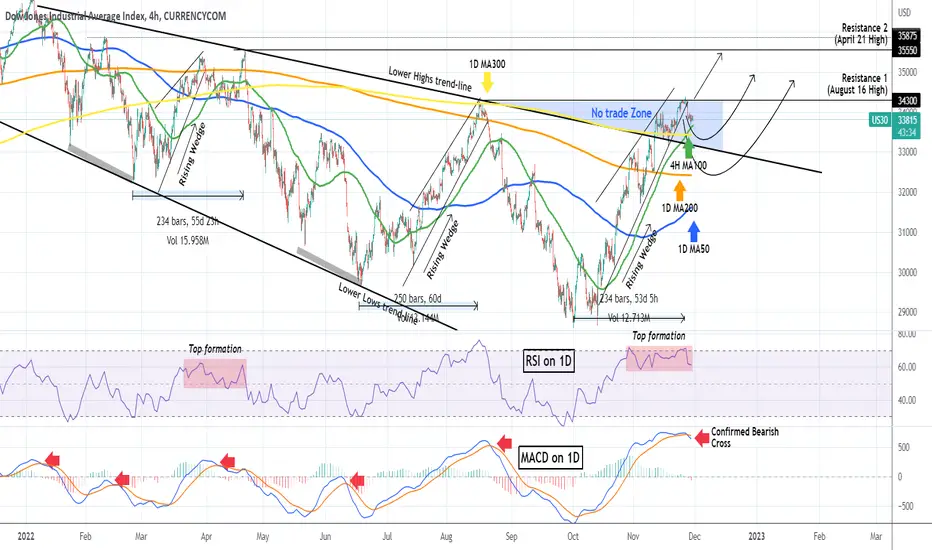
DOW JONES most likely topped at least short-termIt has been almost 6 weeks since Dow Jones (DJI) broke above the top (Lower Highs trend-line) of the Bearish Megaphone pattern that it has been trading in since the start of the year and the beginning of the 2022 correction. At the same time it broke above the 1D MA300 (yellow trend-line), which as we've mentioned numerous times was the barrier for a long-term bullish trend restoration:
As the price was basically rejected on the 34300 Resistance 1 (August 16 High), we can argue that the October - November rally has come to an end, with the price breaking below the Rising Wedge, while also the MACD on the 1D time-frame completed a Bearish Cross (red arrows). Unlike the previous counter trend rallies within the Bearish Megaphone, this time we may have the luxury to expect only a short-term pull-back, and not a new long-term selling sequence to a new market low.
As you see, we were correct for calling the area within the 34300 Resistance and the top (Lower Highs trend-line) of the former Bearish Megaphone, a 'No trade Zone'. A potential Support (and bounce point) can be that Lower Highs trend-line itself and if broken, the 1D MA50 (blue trend-line), which is traditionally the first Support during long-term uptrends. All this of course, assuming that the 4H MA100 (green trend-line), which is supporting now, breaks. If not, we can see one last attempt to break and close above Resistance 1 (34300) and target Resistance 2 (35550).
On a side note, see how the 1D RSI has been printing a Top formation similar to late March - early April. Also the November 25 top came exactly 234 days after the October 02 Low, which is symmetrical to February - April.
-------------------------------------------------------------------------------
** Please LIKE 👍, SUBSCRIBE ✅, SHARE 🙌 and COMMENT ✍ if you enjoy this idea! Also share your ideas and charts in the comments section below! This is best way to keep it relevant, support me, keep the content here free and allow the idea to reach as many people as possible. **
-------------------------------------------------------------------------------
You may also TELL ME 🙋♀️🙋♂️ in the comments section which symbol you want me to analyze next and on which time-frame. The one with the most posts will be published tomorrow! 👏🎁
-------------------------------------------------------------------------------
💸💸💸💸💸💸
👇 👇 👇 👇 👇 👇
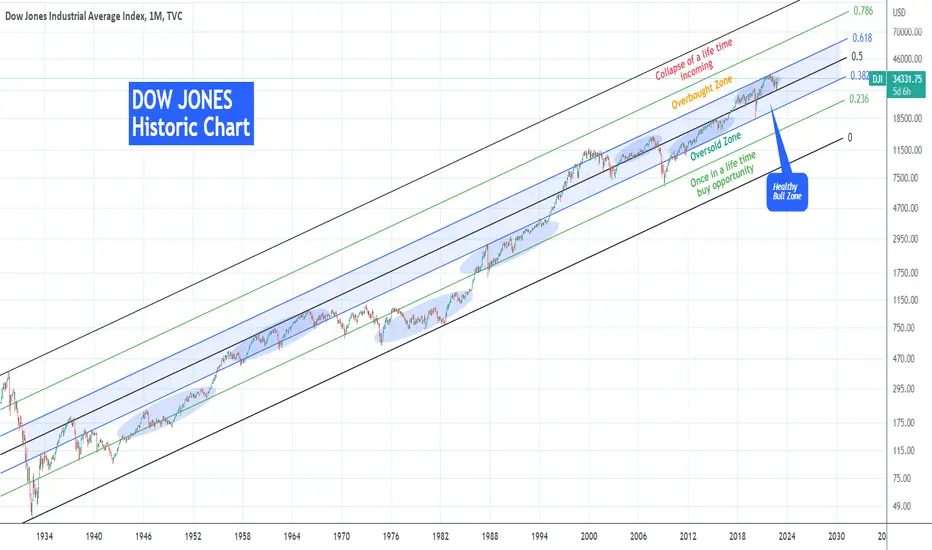
DOW JONES doing what it has always done through history. Rising.This is the Dow Jones Industrial Average Index (DJI) on the log scale since the great depression of the 1930s. A lot of talk is being done lately on whether or not this recent rally is sustainable, or if the high inflation can cause a deeper correction etc. In order to put things into perspective it is always useful to look into the longer term charts, preferably on a multi-year horizon.
This is on the 1M (monthly) time-frame where we've applied the Fibonacci Channel and its retracement levels on this 90 year price action. It is easy to realize that the Fibonacci levels have historically created zones of Support and Resistance. Right now, and despite the 2022 correction (Bear Market), Dow is within the 0.5 - 0.618 Fib, which is part of the larger 0.382 - 0.618 Fib Zone, which we call "Healthy Bull Zone" as when the index stays within it, it tends to rise on healthy growth levels.
To make things more interesting, Dow's early January top (All Time High) and subsequent rejection was made exactly on the 0.618 Fib. It shouldn't be a surprise that the recent October low and the subsequent rebound was made on the 0.5 Fib. This is a Support trend-line that 2017 only broke once during the 2020 COVID crash (which remarkably touched the 0.382 Fib and rebounded). In this 5 years Dow has been rising sustainably within this tight top half of the Healthy Bull Zone.
In fact, when the index trades within two levels tightly, it tends to do so for a very long time. Such periods are indicated by the blue ellipse patterns and besides the 2017 - 2022 one, we can see another 6 major periods.
As a result we can argue that right now Dow Jones is doing "what it always done through history" and that is rise sustainably within a tight Fibonacci zone long-term. This makes the index as bullish as it ever was.
Some added facts on this Channel. As you see we've categorized the zones based on the likely outcome they can provide. Next to the Healthy Bull Zone we see the Oversold (0.382 - 0.236 Fib) and Overbought (0.618 - 0.786 Fib) Zones, which is where the index presents a rare buy and sell opportunity respectively. In fact the 2008 Housing Crisis put us in an oversold position most recently and before that it was the 1987 Black Monday event. At the top of the Channel we have the 0.786 - 1.0 Fib 'Collapse Zone', where a mega collapse event is likely, and the index has only been there at the height of trading before the Great Depression. At the bottom of the Channel we have the 0.236 - 0.0 Fib 'Once in a life time buy opportunity Zone', which as you can imagine is the extremely oversold region where Dow has historically been the most attractive level to buy. The very bottom (March 2009) of the Housing Crisis marginally pierced through and before that (again marginally) the 1987 Black Monday.
** It is worth noting that from 1974 to 1986, the market traded almost entirely within this extremely oversold Fib zone. It was when the U.S. were ravaged by extremely high inflation levels (aftermath of the Vietnam war among others), with many sceptics today comparing the present day to that era.
-------------------------------------------------------------------------------
** Please LIKE 👍, SUBSCRIBE ✅, SHARE 🙌 and COMMENT ✍ if you enjoy this idea! Also share your ideas and charts in the comments section below! This is best way to keep it relevant, support me, keep the content here free and allow the idea to reach as many people as possible. **
-------------------------------------------------------------------------------
You may also TELL ME 🙋♀️🙋♂️ in the comments section which symbol you want me to analyze next and on which time-frame. The one with the most posts will be published tomorrow! 👏🎁
-------------------------------------------------------------------------------
👇 👇 👇 👇 👇 👇
💸💸💸💸💸💸
👇 👇 👇 👇 👇 👇
DOW JONES Too close to the August 16 High!It has been almost 2 weeks since Dow Jones (DJI) broke above the top (Lower Highs trend-line) of the Bearish Megaphone pattern that it has been trading in since the start of the year and the beginning of the 2022 correction. At the same time it broke above the 1D MA300 (yellow trend-line), which as we've mentioned numerous times was the barrier for a long-term bullish trend restoration:
The index is now very close to making another major bullish break-out as it is very close to the 34300 Resistance (1) which was formed by the August 16 High, which was rejected on the (former) Lower Highs trend-line and 1D MA300. If broken it will be the first time in 2022 that Dow Jones will break a Lower High. In this case, we will automatically target 35550 (Resistance 2), which was formed by the April 21 (Lower) High.
If the price gets rejected though, the index should seek the short-term Supports of 1) the 4H MA100 (green trend-line), which during the July - August and March - April counter rallies was the supporting level (when broken, the downtrends started) and 2) the 1D MA200 (orange trend-line), which held as Support for the first time in a year on November 10. Keep in mind that during Dow's bull rallies, the 1D MA50 (blue trend-line) is typically the Support.
On the downside, watch the 1W RSI, which has been glued to the top of the Channel Up in the past two weeks. Failure to break above it, should accelerate the sell sentiment towards the 1D MA50. The trigger for that can be a Bearish Cross on the 1D MACD, which is very close to be formed. All prior Bearish Cross in 2022 have kickstarted major sell-offs.
-------------------------------------------------------------------------------
** Please LIKE 👍, SUBSCRIBE ✅, SHARE 🙌 and COMMENT ✍ if you enjoy this idea! Also share your ideas and charts in the comments section below! This is best way to keep it relevant, support me, keep the content here free and allow the idea to reach as many people as possible. **
-------------------------------------------------------------------------------
You may also TELL ME 🙋♀️🙋♂️ in the comments section which symbol you want me to analyze next and on which time-frame. The one with the most posts will be published tomorrow! 👏🎁
-------------------------------------------------------------------------------
👇 👇 👇 👇 👇 👇
💸💸💸💸💸💸
👇 👇 👇 👇 👇 👇

DOW JONES Holding the 1W MA50 could repeat the 2016/17 rally!This is the price action of the Dow Jones Industrial Average Index (DJI) since the 2008/09 Bear Cycle of the Housing Crisis. On the log 1W chart, we can fit it within a Channel Up pattern, with the January 2022 top as its latest Higher High. As you see there is considerable room to fall and touch the bottom (Higher Lows trend-line) of the Channel Up but on the Sep 26 - Oct 10 1W candles, the 1W MA200 (orange trend-line) acted as Support and pushed the price back above the 1W MA50 (blue trend-line).
It is important to mention that while the candle action was on Lower Lows, the 1W RSI was on Higher Lows, i.e. on a Bullish Divergence. The last time we had all this conditions fulfilled together, was during the August 2015 - February 2016 correction. As you see, the RSI was on Higher Lows while the price Double Bottomed, found Support on the 1W MA200 and rebounded back above the 1W MA50. The 1W MA50 then turned into a Support and never broke and that gave way to the very strong 2016/17 rally.
You can see that its bars pattern fractal (black) fits almost perfectly on the late 2021/2022 price action. As a result, we could expect a gradual recovery into a strong rally in Q3 2023, especially if the 1W MA50 holds as a Support. If not, the 2022 Channel Down (red) can give more Lower Lows until Dow hits the bottom of its 14 year old Channel Up.
-------------------------------------------------------------------------------
** Please LIKE 👍, SUBSCRIBE ✅, SHARE 🙌 and COMMENT ✍ if you enjoy this idea! Also share your ideas and charts in the comments section below! This is best way to keep it relevant, support me, keep the content here free and allow the idea to reach as many people as possible. **
-------------------------------------------------------------------------------
You may also TELL ME 🙋♀️🙋♂️ in the comments section which symbol you want me to analyze next and on which time-frame. The one with the most posts will be published tomorrow! 👏🎁
-------------------------------------------------------------------------------
👇 👇 👇 👇 👇 👇
💸💸💸💸💸💸
👇 👇 👇 👇 👇 👇

DOW JONES Will a Rate Cut do more harm than good to stocks?Bold question and should certainly raise some eyebrows but let's look at the complete picture. This chart displays Dow Jones (DJI) and the Federal Reserve Interest Rate (blue trend-line) on the 1M (monthly) time-frame.
I will make it quick to save us time and then each person can individually make their own conclusions from the chart. The combination of the Fed raising the rates since the start of the with Dow dropping, hasn't been seen often historically on this data set dating back to June 1954. In fact historically, Dow (stock markets in general) tend to rise along with rates. Some times (4 in history) when the Rate Cut happens, Dow drops as well. Most of the times the stock rally continued without a major drop even after the Rate Cuts.
Basically the only time on this data-set that resembles today (assuming the Fed pauses or cuts in 2023) is 1969/70, 1972-74 and 1983/84, with the latter largely associated with Fed Chair Volcker monetary practices. During those periods, Dow started falling as the Rate was rising and then dropped after the Rate cut.
Do you think we are repeating such a period? Will a Rate Cut in the near future do more harm than good to the stock market?
-------------------------------------------------------------------------------
** Please LIKE 👍, SUBSCRIBE ✅, SHARE 🙌 and COMMENT ✍ if you enjoy this idea! Also share your ideas and charts in the comments section below! This is best way to keep it relevant, support me, keep the content here free and allow the idea to reach as many people as possible. **
-------------------------------------------------------------------------------
You may also TELL ME 🙋♀️🙋♂️ in the comments section which symbol you want me to analyze next and on which time-frame. The one with the most posts will be published tomorrow! 👏🎁
-------------------------------------------------------------------------------
👇 👇 👇 👇 👇 👇
💸💸💸💸💸💸
👇 👇 👇 👇 👇 👇

DOW JONES broke above all Bear Market barriers!The Dow Jones index (DJI) broke last week, following the impressive drop on monthly inflation, above both the Lower Highs trend-line dating back to the January 05 market high and the 1D MA300 (yellow trend-line), which was the level that rejected the previous Lower High on August 16.
We've been discussing the importance of this level as a Rejection Zone for over a month and didn't hesitate to claim that a break above the 1D MA300 would restore the long-term bullish trend:
We are not backing down from this claim. The continuous monthly drop on the CPI is lifting market hopes again for a looser monetary policy but technically, there are still some key levels to consider. The price is approaching the 34300 Resistance (1), which is essentially the August 16 High. Right now it appears that we are inside a no-trade zone (blue triangle) where any direction is possible.
A closing above the 34300 Resistance (1) would be a bullish break-out signal targeting the 35540 Resistance (2), which is practically the April 21 Lower High. On the other hand, a break below the 1D MA300 and below the former Lower Highs, should seek the 1D MA200 (orange trend-line) but more importantly the 1D MA50 (blue trend-line) as Supports, a usual buyers accumulation level during Bull Runs.
P.S. Watch the huge bullish divergence on the RSI 1W time-frame.
-------------------------------------------------------------------------------
** Please LIKE 👍, SUBSCRIBE ✅, SHARE 🙌 and COMMENT ✍ if you enjoy this idea! Also share your ideas and charts in the comments section below! This is best way to keep it relevant, support me, keep the content here free and allow the idea to reach as many people as possible. **
-------------------------------------------------------------------------------
You may also TELL ME 🙋♀️🙋♂️ in the comments section which symbol you want me to analyze next and on which time-frame. The one with the most posts will be published tomorrow! 👏🎁
-------------------------------------------------------------------------------
👇 👇 👇 👇 👇 👇
💸💸💸💸💸💸
👇 👇 👇 👇 👇 👇

DOW JONES biggest monthly rally since 1976! Bear Market over?The Dow Jones Industrial Average (DJI) closed the October with its biggest monthly gain since January 1976, rising by +14%! The huge green monthly candle suceeded at (marginally) breaking and closing above the 1M MA10 (blue trend-line) for the first time since January 2022, which was the All Time High and practically the start of the current inflation led Bear Cycle. At the same time, the 1M RSI is close to testing its MA.
Just to have some perspective, the previous Bear Cycle of the 2008/09 Housing Crisis, never saw a 1M candle break above the 1M MA10 nor the 1M RSI break or simply come that close to its MA. Can a break above it signal the end of the current Bear Market? A break above the 1M MA20 (green trend-line) should practically confirm it.
-------------------------------------------------------------------------------
** Please LIKE 👍, SUBSCRIBE ✅, SHARE 🙌 and COMMENT ✍ if you enjoy this idea! Also share your ideas and charts in the comments section below! This is best way to keep it relevant, support me, keep the content here free and allow the idea to reach as many people as possible. **
-------------------------------------------------------------------------------
You may also TELL ME 🙋♀️🙋♂️ in the comments section which symbol you want me to analyze next and on which time-frame. The one with the most posts will be published tomorrow! 👏🎁
-------------------------------------------------------------------------------
👇 👇 👇 👇 👇 👇
💸💸💸💸💸💸
👇 👇 👇 👇 👇 👇

DOW JONES Repeating the July bullish fractal. Still time to buy!It was just 10 days ago when we made a case for a medium-term buy on the Dow Jones index (DJI), against popular belief, as we had early signs that the index made a June 17 type bottom and was about to repeat the June-Aug rebound:
Our view has been confirmed so far and following the 1D RSI break above the Lower Highs and the 1D MACD Bullish Cross, the price quickly has come a few clicks away from the 1D MA50 (red trend-line).
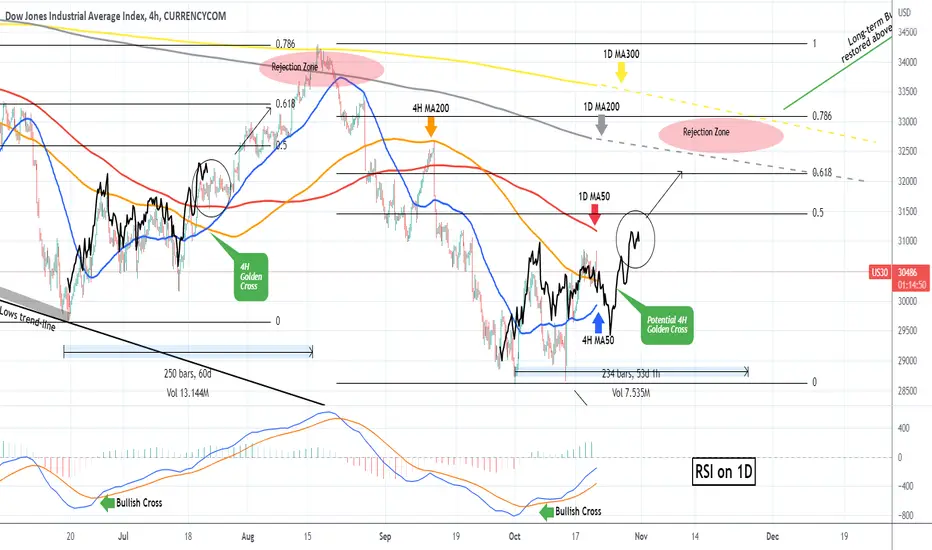
Today's analysis is on the 4H time-frame, in order to get a more detailed look on the short-term. We see that Dow Jones has already broken above both the 4H MA200 (orange trend-line) and the 4H MA50 (blue trend-line) which is supporting currently. Based on the 1D RSI it seems that we are still in the early stages of this uptrend to a Lower High (at least). The 4H Golden Cross (MA50 above MA200) hasn't formed yet and in order to get a better understanding of Dow's analogous position compared to July, I've plotted the June-July sequence on today's price action (black line).
As you see, based on that, the 1D MA50 break should come by next week's end (the earliest), though of course this isn't absolute as even though similar, the current price action hasn't followed the exact pattern of June-July. Above the 1D MA50, the next volatility zone should be within the 0.5 - 0.618 Fibonacci retracement levels, making way for the rejection zone (and the medium-term target) within the 1D MA200 (grey trend-line) and the 1D MA300 (yellow trend-line).
-------------------------------------------------------------------------------
** Please LIKE 👍, SUBSCRIBE ✅, SHARE 🙌 and COMMENT ✍ if you enjoy this idea! Also share your ideas and charts in the comments section below! This is best way to keep it relevant, support me, keep the content here free and allow the idea to reach as many people as possible. **
-------------------------------------------------------------------------------
You may also TELL ME 🙋♀️🙋♂️ in the comments section which symbol you want me to analyze next and on which time-frame. The one with the most posts will be published tomorrow! 👏🎁
-------------------------------------------------------------------------------
👇 👇 👇 👇 👇 👇
💸💸💸💸💸💸
👇 👇 👇 👇 👇 👇