US100: Pullback to fill the GAP below
🧩 SKILLING:US100 – Pullback scenario targeting the GAP support zone
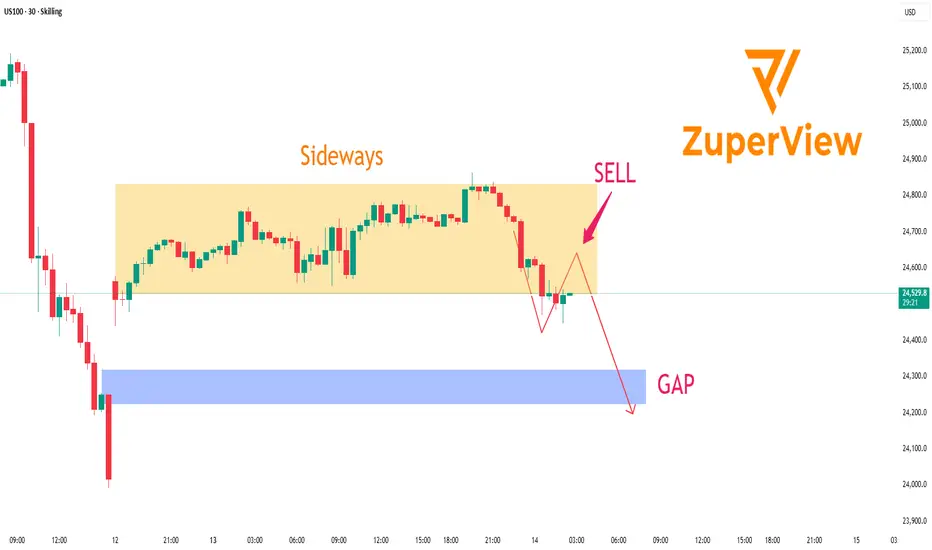
📊 30-Minute Chart Analysis
On the 30-minute timeframe, US100 is showing signs of a short-term corrective move after failing to hold its previous support zone.
Price is currently trading below the Trend indicator’s resistance area, suggesting that sellers have regained temporary control.
After a strong drop, the market is forming a technical pullback to retest the resistance zone. This is often where traders look for opportunities to continue following the prevailing bearish momentum.
________________________________________
🧭 Trading Scenario (For Analysis Purposes Only)
• Potential SELL Zone: 24,650 – 24,740 (resistance and Trend zone)
• Target Area: 24,250 – 24,350 (GAP support area below)
• Invalidation Level: Above 24,750 — if price closes above this level, the short-term bearish structure could be invalidated.
________________________________________
🔎 Technical Outlook
• Short-term trend: Bearish
• Market structure: Forming a pullback–continuation pattern
• Trend indicator: Has flipped bearish, confirming renewed selling pressure
• GAP support: Likely to act as a key area for potential stabilization or reaction from buyers
________________________________________
⚠️ Important Note
This analysis is for educational and informational purposes only and should not be considered financial advice.
Traders should combine this view with their own risk assessment, price action, and macroeconomic context before making any trading decisions.
________________________________________
💡 Summary:
US100 is in a short-term correction phase. If price continues to reject the 24,700 resistance area, the downside scenario toward the 24,250–24,350 GAP support zone remains valid.
________________________________________
Please like and comment below to support our traders. Your reactions motivate us to do more analysis in the future 🙏✨
Harry Andrew @ ZuperView
Dowtrend
Bearish Cypher on the Daily DJI?Ruh oh. It's probably not a given considering the flip floppy nature of the Trumpian markets, where every move hinges on his every word, but my whiskers are twitchin'. That's usually not good.
What do you think?
Owhooooo!

US30: Thoughts and Analysis Pre-FOMCToday's focus: US30
Pattern – N/A
Support – 36,280
Resistance – 36,900
Hi, and thanks for checking out today's update. Today, we are looking at US30 on the daily chart.
Today's video asks if US30 will continue to track higher despite being well off its moving average. This can be a warning if you believe in mean revision. The other point we are looking at in today's report is whether we will see a stall at resistance and previous highs if the price continues to increase.
A key driver could be tomorrow's FOMC; traders will be looking to see if rates remain on hold as expected and what we will hear from the FED in the statement and projections. Ideas are that we could see an end to aggressive rate policy, and what could be coming next?
If it's dovish, we will look for stocks to rally; if it's hawkish, we will look for stocks to decline. Expectations are already in for May rate cuts to be priced in. Will we hear anything from the Fed to substantiate this?
The FOMC will be held at 6:00 am AEDT, and the FOMC press conference will be held at 6:30 am Thursday.
Good trading.

DOW I Continued strong development is indicatedWelcome back! Let me know your thoughts in the comments!
** DOW Analysis - Listen to video!
We recommend that you keep this pair on your watchlist and enter when the entry criteria of your strategy is met.
Please support this idea with a LIKE and COMMENT if you find it useful and Click "Follow" on our profile if you'd like these trade ideas delivered straight to your email in the future.
Thanks for your continued support!

Medium Term Key Levels for US30 (PMLs)These are my medium term key PMLs for US30. It is in a range at the moment.

Dow Jones table for 10 may.Yesterday Dow Jones was in a very small range but today may we can see a volatile session because inflation data is going to be published today.
After the data maybe Dow Jones can decide the direction of the market.

GBPUSD LONG1. Main trend is making HH and HL, but market is sideways now.
2. S&R with max significance.
3. Trend lines are properly visible.
4. Bullish Flag Continuous Pattern is there.
5. Fibonacci Retracement at 23% having significance.
6. No Divergence found.

GBP-USD | LongPlan A:
If DXY goes bearish - Long
EP: 1.18497
SL: 1.17347
TP1: 1.19350
TP2: 1.19955
TP3: 1.20526
Plan B:
If DXY goes for 0.382 LH - Short
EP: 1.17368
SL: 1.18044
TP: 1.16220

Condition View on #DOWJONES #US30My Conditional view on CAPITALCOM:US30 Futures
Will enter in trade if 15 Mins candle close above level of 30665. Will wait for target 31390. (725 Points Gain)
My Stop loss would be 30500 (165 Points Risk)
Note: This is my personal analysis, only for learning

✅NZD_CAD NEXT MOVE|LONG🚀
✅NZD_CAD broke the key structure level
While trading in an local downtrend
Which makes me bearish
And I think that after the retest of the broken level is complete
A rebound and bearish continuation will follow
SHORT🔥
✅Like and subscribe to never miss a new idea!✅

✅GBP_USD SWING SHORT🔥
✅GBP_USD is trading in a downtrend
Along the falling resistance line
Which makes me bearish biased
And the pair is about to retest the resistance
Thus, a pullback and a move down are expected
With the target of retesting the level below
SHORT🔥
✅Like and subscribe to never miss a new idea!✅

JICPT| ZM consolidates around 100 with possible reversalHello everyone. Last November, I posted an idea titled 'Don't rush to buy Zoom for the new wave of Covid' . I'm actually right, price has dropped by more than 60% since then.
Now, I observed a possible reversal pattern, with downtrend violation. Now, I need $94 to be served as a solid defense line, in addition, $128 is required to be firmly conquered. By then, I would be more interested in the long setup.
What do you think?


Dow Jones Industrial Bearish Bat?Looking at this one day chart it looks to me like DJI is
forming a Bearish Bat Harmonic.
For me, there is a tight PRZ with a .886 D point of a
Bearish Bat Harmonic, a 2.618 ABCD completion and a
2.0 AB ext.
I will be looking for a reversal here, around $37,400.
My whiskers are telling me that we could trend up
until Friday and maybe see a dump by Monday.
The Alternate Bat would be in play if we push
up above this level, so we would not be out of the woods.
What do you think is up next?
Owhooooo!

DJI DOW JONES Bulls Have a lot of JUICE ; 40,000 by MAY 2021What people have not learned about the Bulls? They keep on COMING! Ever seen a cow studded by a man bull? Just watch out for the pointy end! But seriously, everyone doubts the dow. Might as well spell the next short "DOWnt" because Bulls are still in control of the weekly chart.
Take Profit May 2021
40,000

JICPT| Bullish setup of NQ on 60mHello everyone. Nasdaq has been down by more than 3% yesterday. It recovered some losses in the over-night session before heading down again.
I just observed a bullish setup on the 60m with reasons below:
1. The downtrend line has been violated.
2. On the daily, price has reached the bottom of the first range. Buyer may join in at this level or there will be further down the road.
Basing on my Dual-MA trading system, it is still downtrend. So the I just put red arrow around the target level of 15300 for your reference. You may close partial position if the index moves as I expected.
Please trade safe.

Low Volume Push On DIA, Will We Roll Over Or Head HigherSame as I put for SPY , DIA is looking a little sketchy right now. Same trend is in play as back in February when it was approaching new record levels. Low volume push higher before rolling over. Plus this week there's a fair amount of economic catalysts to factor in, on top of the first round of Q1 earnings.
This week there are plenty of economic events to take into consideration. One of the foremost things to take into consideration will be the kick-off of Q1 earnings results. The market could gain a glimpse of any progress made as vaccine distribution continues. Companies like Pepsi (NASDAQ: PEP ), Bed Bath & Beyond (NASDAQ: BBBY ), and Delta Air Lines (NYSE: DAL ) could shed some light on the temperature of the economy. This week will also bring consumer price inflation figures into focus. Tuesday, the Commerce Department delivers these at 8:30 AM ET. Inflationary fears remain a hot topic of conversation right now, even as the S&P and Dow reach new highs. This will also weave in with the numerous Federal Reserve speeches this week as discussions continue about interest rates. Thursday will also bring some attention to U.S. retail figures. The consensus forecast? Retail sales are expecting a jump of 5.5%. That would represent an increase from February’s decline of 3%, the largest dip since last April. Whether or not these events spark momentum in the stalled rally for small-cap stocks is to be seen. Looking at benchmark ETFs like the Russell 2000 Small-Cap ETF (NYSE: IWM ), it hasn’t mirrored the same trends as the broader markets. However, it has bounced back a bit from its late March lows.
Quote Source: Best Penny Stocks To Buy Right Now? 3 For This Week’s Watch List

Rectangle breakoutThis pair continues down
Rectangle breakout. Wait the pullback, then sell.
Target: Rectangle size
Keep it simple.
Good trade!!!

Dowtrend line and 61.8 fibo rejectedDowtrend line and 61.8 fibo level was rejected.
Aditional, an engulfing bearish candle confirmation was appear.
Target: Next support.
SL: Just above latest higher high price.
Keep it simple.
Good trade!!!

Flag breakoutDowtrend continues
Wait for pullback, then sell.
Target: Uptrend line since September 2017
Keep it simple
Good trade!!!
(Watch my related idea)

Dow... Weekly updateAs analysed in the attached chart dow exactly moved as per the technical levels.
The levels in the attached chart are valid for the whole month of July.
This chart gives an insight in to technical setup for the week 13-17 July 2020
Enjoy the setup for trading.
Like... Share.. Follow... for more oppurtunities.

Downtrend channel continue- Rejection bearish candle
- Downtrend channel continue
Target: Next support
Good trade!!!

Dow makes HH, but 55 ema is the secret to retesting the lows!We broke downward out of the rising wedge so beautify. It looked like the top of the B wave was in until price decided to make a HH, which may be a potential bull trap. If we can range between 22k - 24k, my EW count will still be in check. A break below 22k will confirm my count and I expect to see many bears entering here. Another wave up would launch us to the 200ma/ema. Will monitor closely to see if we break either direction!
