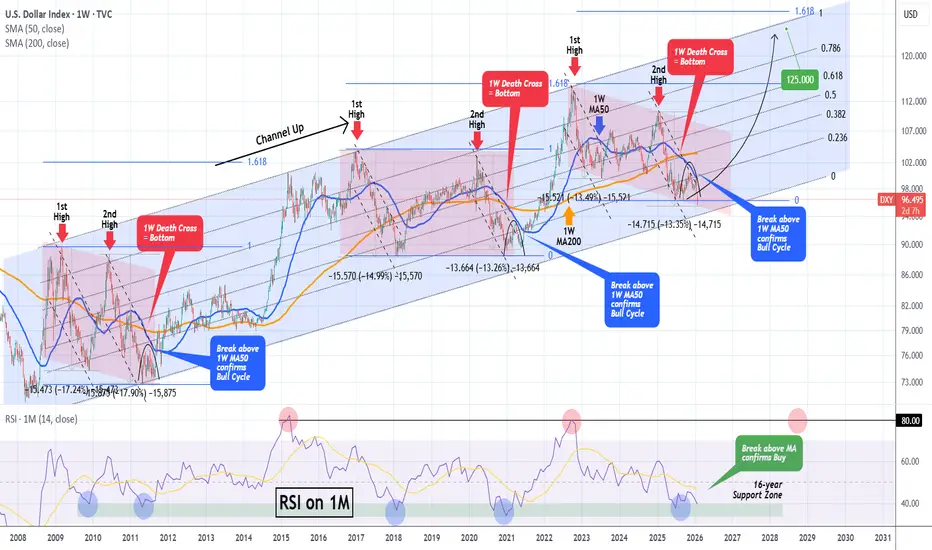
DXY has bottomed and is starting a massive 2-year rallyThe U.S. Dollar index (DXY) has been trading within a Channel Up since the March 2008 bottom during the U.S. Housing Crisis. This is not the first time we use this pattern to identify key macro trend shifts, in fact we revisited it 2 months ago, calling for 'a final pull-back before a massive rally'.
Well the time for this rally is here as yesterday it completed a -13.35% decline from the January 2025 High a year ago.
That decline was technically the Bearish Leg of this pattern's correction phase (red Channel). This is part of its incredible symmetry, with similar correction phases throughout this time period followed by bullish phases, that eventually lead to price rallies to the 1.618 Fibonacci extension.
All conditions for the new Bull Cycle (Bullish Leg) have been fulfilled. Along with the price being at the bottom of the Channel Up, with the -13.35% decline being a benchmark correction historically, we are also past a 1W Death Cross, which has always been a bottom signal on this multi-year Channel Up.
This has always happened at the end of the Bear Cycles (red correction phase) with the Arc pattern making a multi-week Double Bottom before the decisive rebound the breaks above the 1W MA50 (blue trend-line). That break-out is the confirmation of the Bull Cycle start (Bullish Leg).
With the 1M RSI having already touched its 16-year Support Zone, which has provided the most optimal Buy Signals throughout this pattern, we expect the Dollar Index to start rising aggressively in the long-term, targeting the 120.000 - 128.000 Zone on its way to the 1.618 Fib ext, which has been where the previous Higher Highs (Cycle Tops) were priced. 125.000 is a fair Target within a 2-year time-frame.
Notice also that a solid peak indicator (Sell signal) is when the 1M RSI hits 80.00, indicating that the market is massively overbought (overheated trend).
---
** Please LIKE 👍, FOLLOW ✅, SHARE 🙌 and COMMENT ✍ if you enjoy this idea! Also share your ideas and charts in the comments section below! This is best way to keep it relevant, support us, keep the content here free and allow the idea to reach as many people as possible. **
---
💸💸💸💸💸💸
👇 👇 👇 👇 👇 👇
Dollar Index Futures DX1!
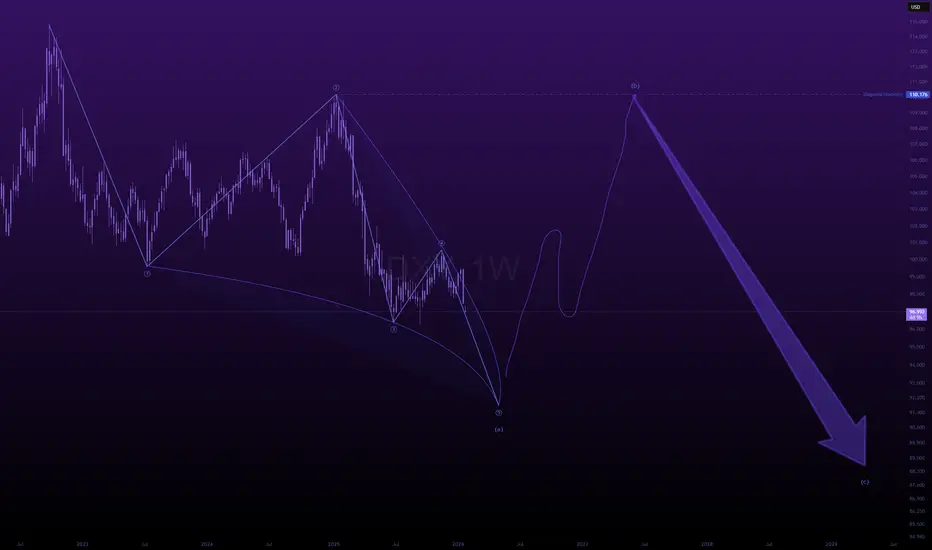
the death of the dollar.the us dollar continues to be suppressed despite multiple efforts at a reversal.
usually weakness like this confirms a larger trend,
a larger trend to the downside.
---
if the us dollar sweeps the recent weekly lows,
it will most likely confirm a macro top,
a top which won't get swept for many more years to come.
---
if the us dollar sweeps the recent weekly low, it will confirm, alt season in the crypto market, and the final leg up in the traditional market.
---
that last leg up in the traditional and crypto market could look extended \ out of proportion relative to the rest of the trend preceding it.
DAX 3-Drives Pattern - Monster Short SignalOK, I admit, it’s very early to call this a three-drives pattern.
But as a trader, I always think, “What if?”
This is my way of preparing early in the process. It allows me to make educated decisions, rather than FOMO trades.
What I am waiting for now is a break of the yellow CIB line. Typically, after such a break, price pulls back to retest it. This behavior is similar to what we see when the median line of a fork is broken.
If this setup triggers, it would clearly be a long-term play. Or it could be over vevry quick via a very sharp, violent move to the south.
Let’s watch it and prepare for this thesis.

can the dxy hit 130?read that title 1 more time.
---
this is an old idea from my old account (i will pin it to the bottom of this post)
---
what i am suggesting right now, is kind of contrarian.
i'm suggesting the us dollar strengthens.
not in a small way,
but in a monsterous way which ends up being felt across the globe.
---
from the 2000 lows, i believe the dxy has been in a corrective uptrend (correcting all of the previous price action which came before the 2008 low.
---
choosing to label this corrective uptrend as a complex double combination.
---
if i am correct about my theory here,
the dxy will rally into the year ahead,
and will wreck havoc on risk assets.
---
🎯 = 130

DXY preparing a 2-month rally.The U.S. Dollar index (DXY) has been consolidating within a 6-month Rectangle pattern following the very bearish first half of 2025. As this consolidation Rectangle evolved, the price managed to break above all of its MA Resistance levels in succession: 1D MA50 (blue trend-line), 1D MA100 (green trend-line) and a little more than a month ago, the 1D MA200 (orange trend-line).
This slow process hints towards the formation of a long-term Support base, in preparation for a 2026 Bull Cycle. The first steps of such a process is establishing the conditions for shorter term rallies. And what this chart shows us is that, every time the index made a 1D MACD Bullish Cross, just like the one it completed today, it started an uptrend.
This time, we also have a Double Bottom on the 1D RSI, which also made Higher Highs, being a Bullish Divergence against the price's Lower Highs.
As a result, it may be time for the 6-month Rectangle to break upwards and the first technical Targe is the 0.382 Fibonacci retracement level at 101.550.
---
** Please LIKE 👍, FOLLOW ✅, SHARE 🙌 and COMMENT ✍ if you enjoy this idea! Also share your ideas and charts in the comments section below! This is best way to keep it relevant, support us, keep the content here free and allow the idea to reach as many people as possible. **
---
💸💸💸💸💸💸
👇 👇 👇 👇 👇 👇

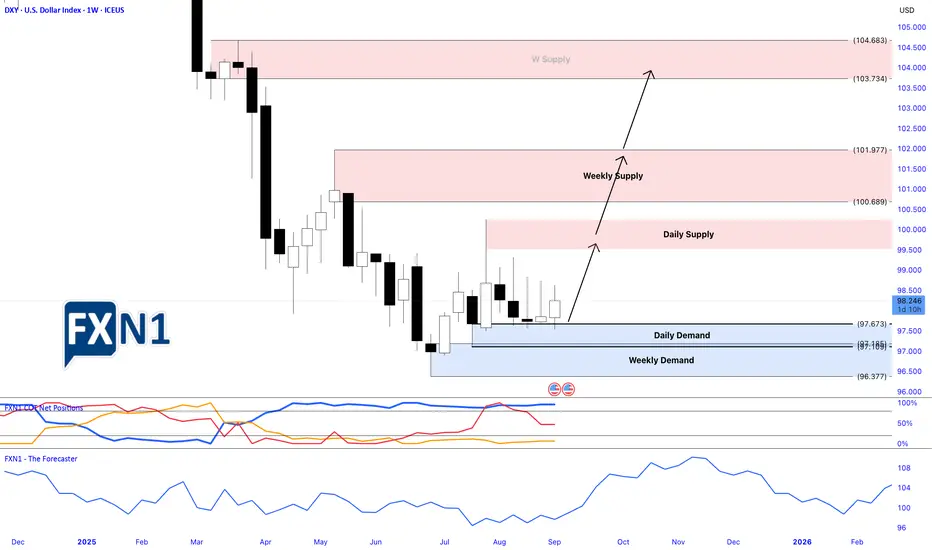
Dollar Index Respects Trend Support — Buyers in Control💵 DXY DOLLAR INDEX | Swing Trade Setup 📊
Strategic Bullish Recovery with Multi-Layer Entry Strategy
📈 CURRENT MARKET STATUS
Current Price: 98.02 - 98.36 USD 📍 | Bias: BULLISH SWING TRADE 🟢 | Timeframe: 4H-Daily Swing Trade ⏰ | Market Condition: Pullback to Support Zone 💪
🎯 TECHNICAL SETUP
Plan: Bullish breakout from triangular moving average pullback with strong support confirmation from the 97.50-97.90 demand zone. 📉➡️📈
📍 MULTI-LAYER ENTRY STRATEGY (Thief Strategy)
Using Limit Order Layering - Scale-In Approach for Risk Management
Utilize multiple buy limit orders to reduce entry risk and maximize fill probability:
🔵 Layer 1 @ 97.60 📍 - 30% Position Size - Initial Entry at Strong Support ✅
🔵 Layer 2 @ 97.70 📍 - 30% Position Size - Secondary Level Confirmation ✅
🔵 Layer 3 @ 97.80 📍 - 25% Position Size - Tertiary Entry Momentum Build 📈
🔵 Layer 4 @ 97.90 📍 - 15% Position Size - Final Layer Aggressive Entry 🚀
✅ Pro Tip: Adjust layer prices based on your risk tolerance and account size. Scalable entry reduces overall trade risk and improves entry quality significantly. 💡
🛑 STOP LOSS
🔴 Hard SL @ 97.50 📍 - Below demand zone for protection 🛡️
📊 Risk: -50 pips maximum per trade 📉
⚠️ NOTE: Stop loss placement is your personal risk decision. Dear Ladies & Gentleman (Thief OG's) - Manage your own risk parameters accordingly. This is YOUR choice, YOUR responsibility, YOUR profit or loss. 🎯
🎁 PROFIT TARGETS
🟢 Target 1 (Easy Win) @ 98.30 📍 - +50 pips 💰 - Take 25% profit and lock in gains immediately ✅
🟢 Target 2 (Main Target) @ 98.60 📍 - +80 pips 💵 - Take 40% profit at moving average resistance zone 📊
🟢 Target 3 (Extended) @ 98.80 📍 - +100 pips 🤑 - Trailing stop on remaining 35% position for momentum capture 🚀
🟢 Target 4 (Aggressive) @ 99.00+ 📍 - +130+ pips 🎊 - Let your winners run with intelligent trailing stops for maximum profit 📈
⚠️ NOTE: High voltage electric gate acts as STRONG RESISTANCE + overbought zone detected at 98.50-98.70. This is a potential market TRAP zone - please take profits responsibly and don't get greedy. Final TP is YOUR personal choice based on YOUR strategy and risk appetite. 🎲
💡 TECHNICAL ANALYSIS BREAKDOWN
Bullish Confluence Factors ✅:
✅ Strong support from 97.50-97.90 demand zone (Historical reaction area proven) 📍
✅ Triangular moving average confirmation (Key technical indicator) 📊
✅ Pullback from overbought conditions (Healthy correction setup) 🔄
✅ Potential base formation pattern (Accumulation zone visible) 🏗️
⚡ 52-week range: 96.22 - 110.18 (Plenty of room for upside movement) 📈
Risk Factors to Monitor ⚠️:
⚠️ Overbought signals at 98.50-98.70 (Strong resistance overhead) 🚧
⚠️ Market trap potential (Price rejection very possible) 🪤
⚠️ Thin year-end trading volumes (Additional volatility risk) 📉
🌍 RELATED PAIRS TO WATCH (Dollar Correlation Analysis)
HIGH NEGATIVE CORRELATION 🔴 (Inverse to DXY - If DXY up, these go down):
🔗 EUR/USD - Correlation: -0.95 ⚡ (STRONGEST HEDGE PAIR) - EUR is 57.6% of DXY weight, watch for BrexitNews & ECB statements 📢
🔗 Gold (XAUUSD) - Correlation: -0.90 ⚡ (Safe-haven inverse) - Precious metals rise when USD weakens, strong economic indicator 💛
🔗 Crude Oil (XTIUSD) - Correlation: -0.75 ⚡ (Commodity proxy) - Weaker dollar = higher oil prices, OPEC decisions matter 🛢️
🔗 Silver (XAGUSD) - Correlation: -0.88 ⚡ (Precious metals) - Follows gold closely but with more volatility, watch industrial demand 🏭
🔗 Bitcoin (BTCUSD) - Correlation: -0.65 ⚡ (Crypto hedge) - Dollar weakness = crypto strength, watch Fed policy closely 🪙
OTHER MAJOR PAIRS 📊 (Direct constituents of DXY Index):
🔗 USD/JPY - DXY Weight: 13.6% 📊 - Currently 156.44 - Watch BOJ (Bank of Japan) statements + Yen carry trades 🇯🇵
🔗 GBP/USD - DXY Weight: 11.9% 📊 - Brexit dynamics remain + BoE policy movements important 🇬🇧
🔗 USD/CAD - DXY Weight: 9.1% 📊 - Oil-sensitive pair, commodity correlations + BoC rate decisions 🇨🇦
🔗 USD/SEK - DXY Weight: 4.2% 📊 - Nordic economy barometer + Riksbank policy 🇸🇪
🔗 USD/CHF - DXY Weight: 3.6% 📊 - Safe-haven currency pair, SNB decisions matter 🇨🇭
📰 FUNDAMENTAL FACTORS & ECONOMIC DRIVERS
🔴 HIGH IMPACT CATALYSTS (Coming Up)
📌 FOMC Minutes Release ⏰ - CRITICAL for USD direction 🚨 - Expected guidance on 2026 rate cuts (2 cuts currently priced in by markets) 📉 - Dovish bias would support DXY weakness, hawkish would support strength 📊
📌 Fed Chair Announcement (Early January 2026) - Trump administration to announce Powell's successor 👔 - Market uncertainty = potential big USD volatility swings 💥 - Could change entire policy expectations for 2026 🎯
📌 US Non-Farm Payroll (NFP) (First Friday of Each Month) 👥 - Strong employment data = Bullish for USD 📈 - Weak employment data = Bearish for USD 📉 - Previous trend showing mixed signals, watch closely 🔍
📌 US CPI Release (Mid-month Inflation Data) 📊 - Inflation currently at 2.7% (Dec 18, 2025 data) 📍 - Below Fed target of 3%, supports rate-cut narrative 🎯 - This weakens USD support structure 📉
📌 US Pending Home Sales 🏠 - Already jumped +3.3% in November = Bullish economic indicator ✅ - Consumer strength supports USD flows 💪
🟠 MACRO HEADWINDS PRESSURING DXY (Current Environment)
💨 2025 Dollar Decline - Already down -9.6% year-to-date (worst year since 2017!) 📉 - This is a major structural weakness signal for USD
💨 Trump Tariff Uncertainty - Aggressive tariff policies creating significant dollar weakness 📉 - Protectionism narrative reduces USD safe-haven demand 🚫
💨 Fed Independence Concerns - Political pressure on Federal Reserve reduces hawkish USD support 📢 - Powell successor uncertainty adds volatility 🎲
💨 Rate Differential Narrowing - Other central banks holding rates higher relative to US expectations 📊 - Makes USD less attractive on yield basis 💰
💨 Fiscal Deficit Concerns - US government spending pressures mounting 🏛️ - Structural USD weakness risk for 2026 ⚠️
🟢 BULLISH DXY FACTORS (Supporting Our Trade)
💪 Stronger GDP - Q3 GDP data came in strong, showing economic resilience 📈 - Manufacturing sector showing signs of recovery 🏭
💪 Labor Market Resilience - Despite recent volatility, employment remains relatively stable 👥 - Fewer major job losses than expected 📊
💪 Safe-Haven Demand - Geopolitical tensions support USD flows into safe assets 🛡️ - Middle East conflicts, Russia-Ukraine ongoing ⚠️
💪 Real Yield Attractiveness - US 10Y Treasury yield at 4.13% is attractive vs. peer nations 💰 - Investors seeking better returns flowing to USD 📈
💪 Month-End Flows - Potential technical bounces from dollar repositioning happening now 📊 - Year-end rebalancing creates support zones 🎯
📊 HISTORICAL CONTEXT & KEY LEVELS
🔵 96.22 - 52-week LOW (October 2025) - Major support zone 📍
🔵 97.50-97.90 - DEMAND ZONE (Our current trade setup area) ✅ - Strong historical reaction level 📊
🔵 98.30-98.70 - RESISTANCE ZONE (Strong overbought area with trap potential) 🚧 - Take profits here, don't be greedy 💡
🔵 99.00 - Psychological round number resistance 📍 - Major price target for aggressive traders 🎯
🔵 110.18 - 52-week HIGH (February 2025 event-driven spike) - Distant target for extended bull 🚀
🎲 RISK MANAGEMENT CHECKLIST (Must Do)
✅ Only risk 1-2% of your account per single trade 💰 - Never go all-in, always protect capital 🛡️
✅ Use stop loss without ANY exceptions 🛑 - No emotional decisions, pre-set your exit 📍
✅ Scale into positions with limit orders 📊 - Don't chase market price, let price come to you 🎯
✅ Monitor FOMC announcements closely 📢 - Set alerts for important economic releases 🔔
✅ Watch geopolitical news (Fed, Trump statements) 📰 - Breaking news can reverse markets instantly ⚡
✅ Take profits at resistance levels 💹 - Lock in gains, don't let winners turn into losers 📈
✅ Don't add to losing positions 🚫 - Patience is key, better opportunities always come 🎯
✅ Keep detailed records of all entries/exits 📝 - Track your performance and improve continuously 📊
⚡ TRADE PLAN SUMMARY
🎯 Setup: Swing trade LONG on DXY from demand zone 97.50-97.90 📍
🎯 Entry Method: 4-layer limit order strategy (Scale-in approach recommended) 📊
🎯 Stop Loss: Hard stop at 97.50 (No exceptions, no moving it) 🛑
🎯 Profit Targets: 98.30 (T1) → 98.60 (T2) → 98.80 (T3) → 99.00+ (T4) 🎁
🎯 Risk/Reward Ratio: Approximately 1:1.6 to 1:2.6 depending on which layer you enter 💹
🎯 Timeframe: 4H-Daily swing trade (3-7 trading days typical duration) ⏰
🎯 Conviction Level: MEDIUM-HIGH (Technical confluence + demand zone + economic setup) 📈
🟢 PROBABILITY EDGE SUMMARY
This setup combines multiple confluence factors for higher probability:
📊 Technical Setup - EMA pullback + demand zone confirmation
🏗️ Structural Setup - Triangular pattern + base formation
😊 Sentiment Setup - Oversold conditions creating bounce opportunity
📈 Fundamental Setup - Rate expectations + economic data supporting
Estimated Win Rate: 55-60% (Based on confluence factors, not guaranteed) 📈
Risk/Reward Ratio: Minimum 1:2.0 target recommendation 💰
Best Trading Sessions: New York + London overlap (9am-12pm EST) ⏰
💬 FINAL THOUGHTS FOR TRADERS
Dear Ladies & Gentleman (Thief OG's) 🎩 - This is a carefully crafted setup based on real market data and technical confluence. However, markets are always unpredictable. Your discipline in following your trading plan matters MORE than being right 100% of the time.
Trade responsibly. Manage your risk. Take your profits. Protect your capital. 💪
The best traders aren't the ones who win every trade - they're the ones who survive and profit over time through disciplined risk management and emotional control. 🎯
Good luck traders! May your profits flow like the currency you're trading! 📈💰
Remember: Your broker, your rules. Your strategy, your risk. Adjust all levels to match YOUR trading plan perfectly. ✅

1 last visit to the trenches.good eve'
us dollar looks interesting to me,
starting to print a 3 day - 1 week hidden bear on various oscillators,
stuck at the 100 resistance.
so long as it bear flags beneath this 100 level, i believe the dxy is going to come down 1 final time to the low 90's before a bottom is attained.
---
calling this one a leading diagonal, despite the irregular structures in the sub-waves.
with something like the dxy, i don't mind being a bit more flexible with how i approach charting it.
---
🎯 = 93

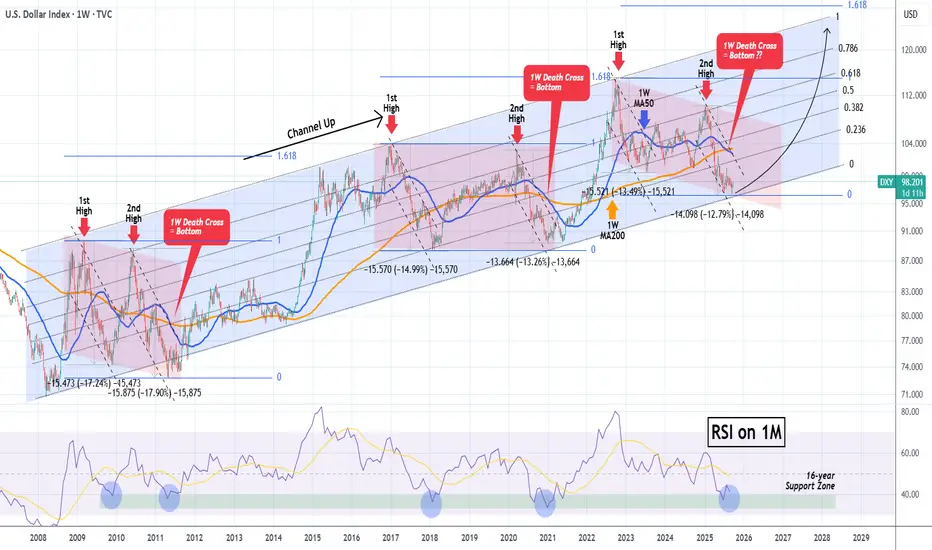
DXY is making perhaps the final pull-back before a massive rallyThe U.S. Dollar index (DXY) has been trading within a Channel Up since the March 2008 bottom during the U.S. Housing Crisis. This is not the first time we use this pattern to identify key macro trend shifts, in fact we revisited it a little over 2 months ago.
The incredible symmetry it's been showing, with clear correction phases (red Channels) followed by bullish phases, eventually lead to price rallies to the 1.618 Fibonacci extension.
Right now the price is past a 1W Death Cross, which has always been a bottom signal on this multi-year Channel Up, and is pulling back on perhaps the final mini drop before the new 2-year Bullish Leg begins.
This has always happened at the end of the Bear Cycles (red correction phase) with the Arc pattern showing a final pull-back before the decisive rebound the breaks above the 1W MA50 (blue trend-line). That break-out is the confirmation of the Bull Cycle start (Bullish Leg).
With the 1M RSI having already touched its 16-year Support Zone, which has provided the most optimal Buy Signals throughout this pattern, we expect the Dollar Index to start rising aggressively in the long-term, targeting the 120.000 - 128.000 Zone on its way to the 1.618 Fib ext, which has been where the previous Higher Highs (Cycle Tops) were priced.
Notice also that a solid peak indicator (Sell signal) is when the 1M RSI hits 80.00, indicating that the market is massively overbought (overheated trend).
---
** Please LIKE 👍, FOLLOW ✅, SHARE 🙌 and COMMENT ✍ if you enjoy this idea! Also share your ideas and charts in the comments section below! This is best way to keep it relevant, support us, keep the content here free and allow the idea to reach as many people as possible. **
---
💸💸💸💸💸💸
👇 👇 👇 👇 👇 👇

DXY bottomed and is starting the new Bullish Leg.The U.S. Dollar index (DXY) has been trading within a Channel Up since the October 01 Low last week even broke above its 1D MA200 (orange trend-line) for the first time since March 05 2025.
Technically, that is confirmation for the long-term continuation of the uptrend. As long as the 1D MA50 (blue trend-line) holds, we expect DXY to start the new Bullish Leg of the Channel Up as yesterday it hits its bottom.
There is a high symmetry between the last three Bullish Legs but since the 'weakest' one has been +2.17%, we have a Target at 101.100. As you can see, that would even test the 1W MA50 (red trend-line), which is the natural long-term Resistance of the market.
Notice also the 1D RSI bounce on its 2-month Support Zone as well as the just formed Bullish Cross on the 4H MACD. All perfectly aligned with bottom formations signaling buy opportunities.
---
** Please LIKE 👍, FOLLOW ✅, SHARE 🙌 and COMMENT ✍ if you enjoy this idea! Also share your ideas and charts in the comments section below! This is best way to keep it relevant, support us, keep the content here free and allow the idea to reach as many people as possible. **
---
💸💸💸💸💸💸
👇 👇 👇 👇 👇 👇

Nasdaq 100, USD Index: Thanksgiving PerformanceToday I’m digging into my Excel data to see how the Nasdaq and the US Dollar Index performed across the three trading days either side of Thanksgiving.
Matt Simpson, Market Analyst at City Index.

USD Index, AUD/USD Hint at Near Term ReversalsAs outlined in last week’s video, I suspect the US dollar may have the potential to break higher as part of its wave C before momentum realigns with its dominant bearish trend. However, Monday’s shooting star candle just below 100, coupled with an overbought RSI (2), warns of a potential pullback ahead of any breakout.
Also note that AUD/USD has formed a spinning top doji near the September low, suggesting that bearish momentum is waning despite closing lower for a fourth consecutive day.
With the RBA likely to deliver a hawkish tone when they hold rates today, there’s potential for a short-term bounce in the Australian dollar. However, if I’m right in expecting an eventual bullish breakout in the US dollar index, I’ll also be watching for evidence of a swing high on AUD/USD once that anticipated bounce is delivered.
Matt Simpson, Market Analyst at City Index

USD Bullish Reversal Into Resistance - Next Week Is Pivotal The Fed have pushed back on committing to another 25bp cut in December, maintaining a data-dependent stance. Traders will keep a close watch on next week’s ADP employment and ISM reports to gauge the likelihood of a Christmas cut from the Fed. I update my longer-term outlook for the US dollar index and review the FX majors to pick out the strong from the weak.
Matt Simpson, Market Analyst at City Index.

DXY has started a new long-term Bullish Leg to 103.500.Four months ago (June 26, see chart below) we gave a strong Buy Signal on the U.S. Dollar Index (DXY), which in a month's time it hit our 100.000 Target:
Now we see the 3-year Channel Down starting the next Bullish Leg having priced its bottom (Lower Low) on September 17. As you can see this is almost the exact same triple Lower Lows bottoming process as in 2023, using also the same Fibonacci retracement levels as Targets. We have the huge 1W RSI Bullish Divergence to also confirm this.
Based on this symmetry, we have started a Bullish Leg similar to July's 2023. That peaked marginally below the 0.5 Fibonacci level. As a result, we expect DXY to target at least 103.500 by early 2026.
-------------------------------------------------------------------------------
** Please LIKE 👍, FOLLOW ✅, SHARE 🙌 and COMMENT ✍ if you enjoy this idea! Also share your ideas and charts in the comments section below! This is best way to keep it relevant, support us, keep the content here free and allow the idea to reach as many people as possible. **
-------------------------------------------------------------------------------
💸💸💸💸💸💸
👇 👇 👇 👇 👇 👇

Technical Outlook for USD Index, EUR/USD, GBP/USDWhile my bias for the US dollar index remains bearish on the higher timeframes, a near-term bullish setup may have emerged. And that could see a pullback on EUR/USD and possible GBP/USD.
Matt Simpson, Market Analyst at City Index and Forex.com.

Dollar Index Big Map: Trend Is Your Friend This year, the dollar has been in the red all the way down — until it hit the strong support line of a multi-decade uptrend (white). From there, it bounced to the upside. So, what’s next?
I’d like to share with you a big map of the Dollar Index.
I assume that we are still within the large second leg ((Y)) of the ((WXY)) corrective structure (white).
Within this structure, we can see a smaller-degree (WXY) correction (blue).
Currently, the market is moving in the last leg C of the final upward move in blue wave (Y).
Many times, I’ve observed how beautifully these wave structures align with strong pivot points.
The ultimate target for wave ((Y)) is near the top of wave ((W)), around 121.
This level also matches the target where blue wave (Y) equals blue wave (X) — an amazing correlation!
There are two key confirmation levels marked on the map:
Bullish confirmation — above 110 (this would invalidate the bearish scenario).
Bearish confirmation — below 89 (this would invalidate the ((WXY)) structure).

DXY Is it finally time for the Dollar to shine?The U.S. Dollar index (DXY) has been trading within a Channel Up since the March 2008 bottom during the U.S. Housing Crisis. This pattern has been showing incredible symmetry, having clear correction phases (red Channels) followed by bullish phases, where the price rallied to the 1.618 Fibonacci extension.
Right now the price has almost hit the bottom of this multi-year Channel Up, while at the same time making a new (2nd) bottom for the 2nd Bearish Leg of the (red) correction phase.
With the 1M RSI having already touched its 16-year Support Zone, which has provided the most optimal Buy Signals throughout this pattern, we expect the Dollar Index to start rising aggressively in the long-term, targeting at lest 120.000 on its way to the 1.618 Fib ext.
-------------------------------------------------------------------------------
** Please LIKE 👍, FOLLOW ✅, SHARE 🙌 and COMMENT ✍ if you enjoy this idea! Also share your ideas and charts in the comments section below! This is best way to keep it relevant, support us, keep the content here free and allow the idea to reach as many people as possible. **
-------------------------------------------------------------------------------
💸💸💸💸💸💸
👇 👇 👇 👇 👇 👇
DXY Dollar Heist: Can You Escape @100?🔥 DXY Dollar Index Bank Heist Plan (Swing Trade) 🔥
Asset: DXY Dollar Index 💵Plan: Bullish 📈Thief Trading Style: Layered Limit Order Strategy 🕵️♂️
🏦 The Heist Plan 🏦
Dear Thief OG's, Ladies & Gentlemen, get ready to pull off the ultimate DXY heist! 💰 We're using the Thief Layering Strategy to stack multiple limit orders and maximize our loot. Follow the plan, adjust to your risk, and let’s escape with the cash! 🚨
📈 Entry: The Break-In
Strategy: Deploy multiple buy limit orders to layer your entries like a master thief 🕴️. Suggested levels:
98.00 💸
98.20 💸
98.40 💸
98.60 💸
Flexibility: Add more layers based on your risk appetite or market conditions 📊.
Pro Tip: Set an alert on TradingView to catch the breakout or pullback at these levels 🚨.
🛑 Stop Loss: The Escape Route
Thief SL: Set at 97.50 to protect your stash 🛡️.
Risk Management: Adjust SL based on your lot size, risk tolerance, and number of layered entries ⚖️.
Warning: Don’t get caught! This is a high-stakes heist—stick to your risk plan 🔥.
🎯 Target: The Getaway
Police Barricade: Resistance at 100.30 🚓—watch out!
Our Target: Take profits at 100.00 to escape with the loot before the market traps you 🏃♂️💨.
🧠 Why This Heist?
The DXY is showing bullish momentum based on real-time market data 📡:
Macro Factors: Strong USD demand driven by economic indicators (check COT reports, geopolitics, and intermarket analysis) 🌍.
Technical Setup: Layered entries align with swing trade pullbacks and key support zones 📉.
Scalpers 👀: Stick to quick long-side trades with trailing SL to lock in profits 💰.
⚠️ Trading Alerts: Stay Sharp!
News Releases: Avoid new trades during high-impact news to dodge volatility traps 🚫.
Position Management: Use trailing stop-loss to secure your profits and stay safe 🛡️.
💪 Boost the Heist!
Hit the Boost Button to power up our Thief Trading Style! 🚀 Every like and view strengthens our crew, helping us rob the market with precision. Let’s make money and vanish like pros! 🤑
Stay tuned for the next heist plan, Thief OG’s! 🕵️♂️🎉

EURUSD: Exhausting Uptrend Around 1.1930-1.2400The EUR/USD pair shows signs of losing momentum on the chart, which is expected as it is currently in the final (5th) wave of a larger wave C or 3.
The RSI indicates a second consecutive bearish divergence, but the uptrend could continue for a while. The price is likely to reach at least 1.1930, which is the level where wave C equals wave A, for symmetry.
The blue box highlights the target area based on the Fibonacci sequence. It starts at 1.1930 and peaks around 1.2400, where wave 5 of wave C is projected to cover 61.8% of the distance from wave 1 to wave 3.
We’re not predicting the reversal point yet; we’ll let the market reveal it in due time.
Wishing us all lucky trades!

Is the DXY Poised for a Breakout?Analyzing the Bullish PotentialThe DXY (US Dollar Index) appears to be on the verge of a significant upward rally. Last week, I shared my analysis highlighting a potential trigger point for a long entry, which the price subsequently surpassed, confirming the setup. According to the latest COT reports, commercial traders have reached their highest net positions of 2023. Historically, whenever commercials hit new highs, it often signals the beginning of a bullish trend in the DXY.
Additionally, we observe that many currencies measured against the dollar have weakened recently, supporting my thesis of a continued upward move for the DXY. Seasonal patterns also point toward a potential bullish phase.
Is this the moment for the DXY to initiate a strong bullish trend? Only time will tell, but the technical and fundamental signals are aligning in favor of a possible rally.
✅ Please share your thoughts about Dollar index in the comments section below and HIT LIKE if you appreciate my analysis. Don't forget to FOLLOW ME; you will help us a lot with this small contribution.
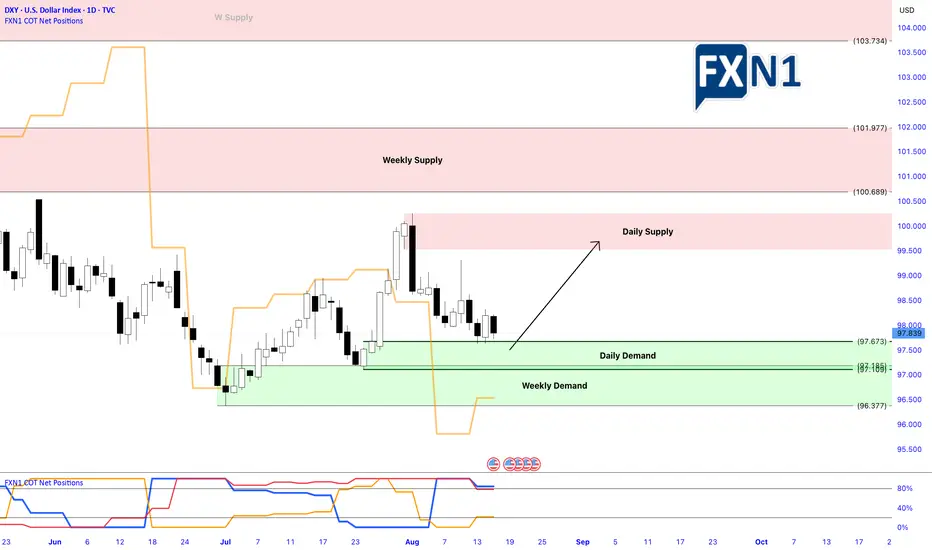
Dollar Index Surges:Bullish Momentum Sparks New OpportunitiesThe DXY Dollar Index Futures kicked off the new week with a strong bullish candle, signaling renewed upward momentum. According to the latest Commitment of Traders (COT) data, non-commercial traders are reducing their bearish bets, indicating a shift in market sentiment. Meanwhile, commercial traders are holding positions at levels not seen since 2021, suggesting confidence in the dollar’s strength. Retail traders, on the other hand, continue to push against the trend, maintaining bearish pressure. Recently, the price retested a key demand zone at the end of last week, which could present a strategic buy opportunity at a discounted level. What are your thoughts on this setup?
✅ Please share your thoughts about DXY in the comments section below and HIT LIKE if you appreciate my analysis. Don't forget to FOLLOW ME; you will help us a lot with this small contribution.

DXY:Key Levels and Political Events: Preparing for the Next MoveThe latest Commitment of Traders (COT) report indicates that there have been negligible changes in the behavior of commercial traders regarding the DXY. Meanwhile, retail traders have significantly reduced their long positions, cutting about 30% of their holdings to the short side. In contrast, non-commercial traders have increased their long positions by approximately 11.14%, suggesting a divergence in market sentiment: retailers appear to be leaning toward shorting the dollar, while non-commercials might be starting to accumulate long positions.
Over the past week, the price rebounded at our daily demand zone, which could signal a potential continuation of the upward trend in the coming week. However, the market's next move will depend heavily on how it opens after the weekend and the market's reaction to the upcoming Trump-Putin meeting.
What are your thoughts on these developments?
✅ Please share your thoughts about DXY in the comments section below and HIT LIKE if you appreciate my analysis. Don't forget to FOLLOW ME; you will help us a lot with this small contribution.
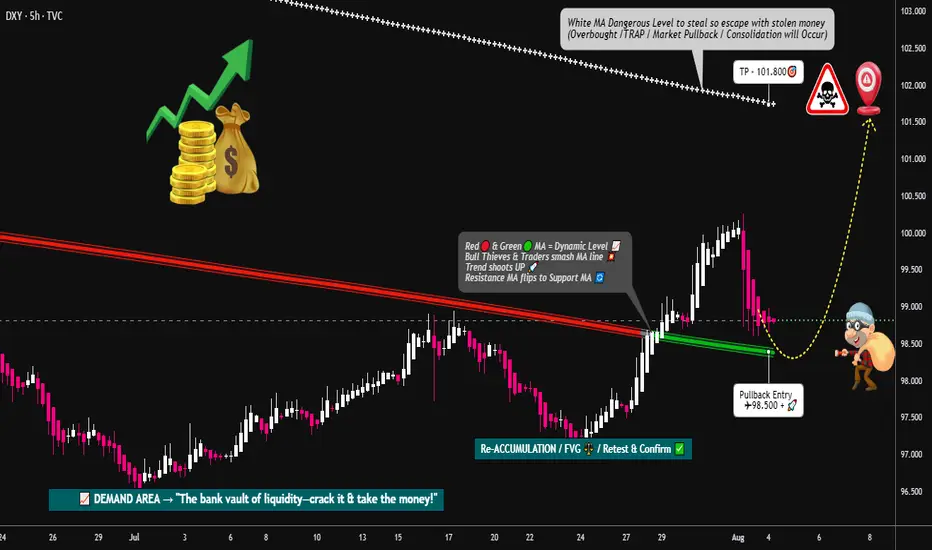
DXY Locked & Loaded: Robber's Gameplan for Profit Pullout💸💼 "DXY Market Heist Blueprint – The Thief's Bullish Escape Plan" 💼💸
Rob the Market, Not the Rules – Trade Smart, Trade Sharp, Trade Thief Style™
🌍 Hey Money Makers, Risk Takers & Market Robbers!
Hola! Ola! Bonjour! Hallo! Marhaba! 🙌
Let’s break into the DXY vault and swipe those profits with precision. 💼💸
🧠💡This Thief Trading Style™ Master Plan is a high-stakes operation backed by technical setups, macro-fundamentals, and robbery-level insights. Follow the blueprint laid out on the chart. Our target? The High-Risk Yellow ATR Zone – where the real treasure is buried.
💼 ENTRY: "The Vault Is Open – Grab the Bullish Bags!"
Enter long as price approaches key pullback levels within a 15–30 min timeframe. Use the most recent candle wick’s swing low/high for sniper-style DCA entries.
🔑 Layer multiple limit orders like a thief stacking getaway bags (aka the DCA / Layering Method). Be patient and precise.
🛑 STOP LOSS: "Don’t Get Caught by the Market Police"
📍 Place SL just below the nearest 4H swing low (example: 97.300) depending on your strategy (scalping/swing).
⚖️ Your SL should reflect your risk appetite, lot size, and how many limit orders you’re running. Thieves don’t risk it all on one job. 🎭
🎯 TARGET: 101.800 (or Escape Before the Sirens)
Once the target zone nears, decide whether to collect full loot or exit before resistance hits. We trade smart, not greedy. 🧠💰
📈 Why This Heist Makes Sense: Market Conditions Breakdown
Bullish momentum supported by macro drivers and intermarket forces
COT report and sentiment leaning in favor of USD
Dollar Index structure showing signs of reversal + trend confirmation
Consolidation trap zones hinting at institutional accumulation
💡 This is not just a blind entry—it's a well-researched and time-tested plan. Check the chart details and refer to:
🔗 Fundamentals | COT Reports | Sentiment Score | Quantitative Outlook
🚨 NEWS & POSITION MANAGEMENT ALERT
Before jumping in, beware of high-impact news!
🗞️ To keep your trades safe and stress-free:
Avoid opening new positions during major news releases
Use trailing SLs to protect gains
Monitor volatility triggers (economic calendar is your best friend!)
🏴☠️💥 BOOST THE ROBBERY – Hit That Like/Boost Button
The more you boost, the stronger the heist crew becomes! 💪🚀
Help fellow traders steal opportunities with the Thief Trading Style™ – calculated, bold, and sharp.
🔥 Let's continue to outsmart the markets and make each trade count. Stay tuned for the next heist update – fresh trades, deeper insights, and bigger bags. 🤑💼
🔔 Disclaimer: This plan is not financial advice. Use it for educational and entertainment purposes. Always conduct your own analysis and manage risk accordingly.
📌 Markets shift quickly. Stay adaptable, informed, and always ready to pivot.
USD Set To bounce? EUR/USD, USD/JPY, USD/CHFIt has been a week since the US dollar plunged following a weak NFP report. Given it has consolidated within a tight range near last week's low, alongside price action clues on EUR/USD, USD/JPY and USD/CHF, I suspect the dollar could bounce before its losses resume.
Matt Simpson, Market Analyst at City Index and Forex.com
