DOLLAR INDEX- BULLISH TO $102Right now there's a lot of gloom & doom around the DXY, with articles being published about it crashing. I'd be very careful as now is the time that institutions are more likely to buy the Dollar, while everyone else is scared off.
Confluences👇
⭕️A-B-C Correction Complete (3 Sub-Wave Correction).
⭕️Gold Bearish (Negative Correlation to DXY).
⭕️Downside LQ Grabbed From Multi-Month Low.
DXY

USDCHF - LONGS DOLLAR BULLS BACK Off the back of last week Friday we have seen dollar strength kickback into the markets.
The weekly candle closed with a wick sweeping liquidity at a major monthly support zone (0.77139) which held and buyers have come back into the market.
TP1: 0.78590
TP2: 0.79097
TP3:079550

The "US Bitcoin Reserve" is a Lie. (A Macro Deep Dive)While Retail is chasing headlines about a "Strategic Bitcoin Reserve," Smart Money is aggressively de-risking. Why? Because the "News" is a linguistic misunderstanding, and the "Macro" just turned violently bearish.
If you are buying this dip because you think the US Government is about to print trillions to buy Bitcoin, you are walking into a trap. Today, we are going to deconstruct the three pillars of this bearish thesis: The "Project Vault" Deception, The Kevin Warsh Pivot, and the Technical Reality of DXY and ETHUSD .
__________________________________________________________________________________
1. The "Project Vault" Deception (Fact Check) 🕵️♂️
The entire bullish narrative right now hangs on the rumor that the administration's "$12 Billion Project Vault" is a secret plan to accumulate Bitcoin.
This is false.
I dug into the executive details. "Project Vault" is indeed a strategic reserve, but not for Crypto. It is a stockpile for Critical Minerals ,specifically Gallium, Cobalt, and Lithium—to secure the US defense supply chain against China.
• Retail hears: "Vault" = Cold Storage for BTC.
• Reality: "Vault" = Warehouses for EV Batteries and Fighter Jet components.
• The Takeaway: The market is pricing in a massive liquidity injection for Crypto that simply does not exist. When this realization hits the masses, the repricing will be severe.
__________________________________________________________________________________
2. The Macro Villain: Kevin Warsh 🦅
While everyone watches the "Reserve" headlines, they are ignoring the single most important variable: The Federal Reserve.
The new nominee for Fed Chair, Kevin Warsh , is the ultimate Hawk.
• History: He resigned from the Fed in 2011 specifically because he opposed Quantitative Easing (QE).
• Philosophy: He believes in a "Smaller Fed," "Positive Real Rates," and a "Strong Dollar."
• The Impact: Warsh is the anti-thesis to the "Money Printer Go Brrr" narrative. His nomination is a signal that the era of easy liquidity is ending. This is a Liquidity Withdrawal Event , and risk assets like BTCUSD are the first to suffer.
__________________________________________________________________________________
3. The Technical Truth: DXY & ETH 📉
The charts are confirming the Macro view perfectly. The "Smart Money" is already positioning for a liquidity crunch.
A) The DXY (US Dollar Index) Squeeze
The Dollar is waking up.
• Price Action: DXY is compressing tight at 26.9950 , sitting exactly at the confluence of the EMA50 and EMA200 . This is a massive decision point.
• Momentum: Stochastic is overbought (95.3), BUT ADX is at 52.2 . This tells us the trend strength is real.
• The Trigger: A 4H close above 27.09 (Upper Bollinger Band) triggers a breakout. If the Dollar flies, Crypto dies. It’s that simple.
B) Ethereum (The Canary in the Coal Mine)
If the "US Reserve" story were real, insiders would be front-running it on ETHUSD . Instead, ETH is lifeless.
• Structure: We have confirmed a CHoCH Bearish . Price is trading below every major Moving Average (20, 50, 200).
• The Trap: RSI is oversold (25.1), but ADX is 53.0 . Do not mistake "Oversold" for "Reversal." High ADX + Low RSI = A strong, relentless downtrend.
• Volume: We are trading at 39% below average volume . There is ZERO institutional support at these levels. The "Smart Money" has left the building.
__________________________________________________________________________________
4. The Operational Risk (The "John Lick" Scandal) 🚨
Finally, for those who believe the US Government is competent enough to manage a trillion-dollar Bitcoin reserve, look at the news from last week. A government contractor’s son was caught draining US-seized wallets on Telegram to flex wealth.
The Reality: The US Government cannot even secure the Bitcoin it already has. The idea that they are about to execute a sophisticated sovereign accumulation strategy is a fantasy.
__________________________________________________________________________________
🎯 The Verdict & Strategy
The "Strategic Reserve" narrative marked the top. The "Kevin Warsh" reality will drive the trend.
• The Trade: I am fading this narrative entirely.
• Invalidation: A DXY breakdown below 26.41 or an ETH reclaim of 3,403 (Bearish Order Block).
• Target: As long as DXY holds above the EMA200, I am targeting a flush on BTCUSD to 70k and ETH to 2,224 .
Do not trade the Headlines. Trade the Liquidity.
Do you trust the "US Reserve" hype?
A) Yes, HODL for nation-state adoption 🇺🇸
B) No, the chart is broken 📉
Vote A or B below! 👇

DXY — FRGNT FUN COUPON FRIDAY Q1 | D6 | W5 | Y26📅 Q1 | D6 | W5 | Y26
📊 DXY — FRGNT FUN COUPON FRIDAY
🔍 Analysis Approach
I’m applying a developed version of Smart Money Concepts, with a structured focus on:
• Identifying Key Points of Interest (POIs) on Higher Time Frames (HTFs) 🕰️
• Using those POIs to define a clear and controlled trading range 📐
• Refining those zones on Lower Time Frames (LTFs) 🔎
• Waiting for a Break of Structure (BoS) as confirmation ✅
This process keeps me precise, disciplined, and aligned with market narrative, rather than reacting emotionally or chasing price.
💡 My Motto
“Capital management, discipline, and consistency in your trading edge.”
A positive risk-to-reward ratio, combined with a high-probability execution model, is the backbone of any sustainable trading plan 📈🔐
⚠️ On Losses
Losses are part of the mathematical reality of trading 🎲
They don’t define you — they are necessary, expected, and managed.
We acknowledge them, learn, and move forward 📊➡️
🙏 I appreciate you taking the time to review my Daily Forecast.
Further context and supporting material can be found in the Links section.
Stay sharp 🧠
Stay consistent 🎯
Protect your capital 🔐
— FRGNT 🚀📈
TVC:DXY

DXY | FRGNT WEEKLY FORECAST | Q1 | W6 | Y26📅 Q1 | W6 | Y26
📊 DXY | FRGNT WEEKLY FORECAST |
🔍 Analysis Approach
I’m applying a developed version of Smart Money Concepts, with a structured focus on:
• Identifying Key Points of Interest (POIs) on Higher Time Frames (HTFs) 🕰️
• Using those POIs to define a clear and controlled trading range 📐
• Refining those zones on Lower Time Frames (LTFs) 🔎
• Waiting for a Break of Structure (BoS) as confirmation ✅
This process keeps me precise, disciplined, and aligned with market narrative, rather than reacting emotionally or chasing price.
💡 My Motto
“Capital management, discipline, and consistency in your trading edge.”
A positive risk-to-reward ratio, combined with a high-probability execution model, is the backbone of any sustainable trading plan 📈🔐
⚠️ On Losses
Losses are part of the mathematical reality of trading 🎲
They don’t define you — they are necessary, expected, and managed.
We acknowledge them, learn, and move forward 📊➡️
🙏 I appreciate you taking the time to review my Daily Forecast.
Further context and supporting material can be found in the Links section.
Stay sharp 🧠
Stay consistent 🎯
Protect your capital 🔐
— FRGNT 🚀📈
TVC:DXY

DXY — 97.368 Range AcceptancePrice held above 95.906 after a second liquidity sweep, but acceptance back into the range above 97.368 was not present, keeping long engagement unjustified.
Market data behavior observation.
No prediction. No instruction.
— Danel Fadejev
CORE5 Tradecraft
Institutional Logic. Modern Technology. Real Freedom.

XAUUSD is at strong SupportXAUUSD remains in a strong bullish continuation structure after an aggressive impulsive rally, with price now consolidating above a major higher-timeframe demand zone aligned with key Fibonacci retracement levels, signaling healthy profit-taking rather than trend exhaustion. The recent rejection from the highs reflects a controlled pullback into value, where buyers are defending structure and liquidity, keeping the broader uptrend intact as long as price holds above the demand region. From a fundamentals perspective, gold continues to be supported by persistent geopolitical uncertainty, expectations of future Federal Reserve rate cuts, softer US dollar momentum, and declining real yields, all of which strengthen safe-haven demand and institutional positioning in precious metals. With inflation risks still present, central bank gold accumulation ongoing, and risk sentiment remaining fragile, the technical confluence of bullish market structure, demand zone support, and macroeconomic tailwinds favors further upside expansion after consolidation, making dips technically attractive within a trend-following, momentum-based trading framework focused on liquidity, smart money flow, and higher-timeframe continuation.

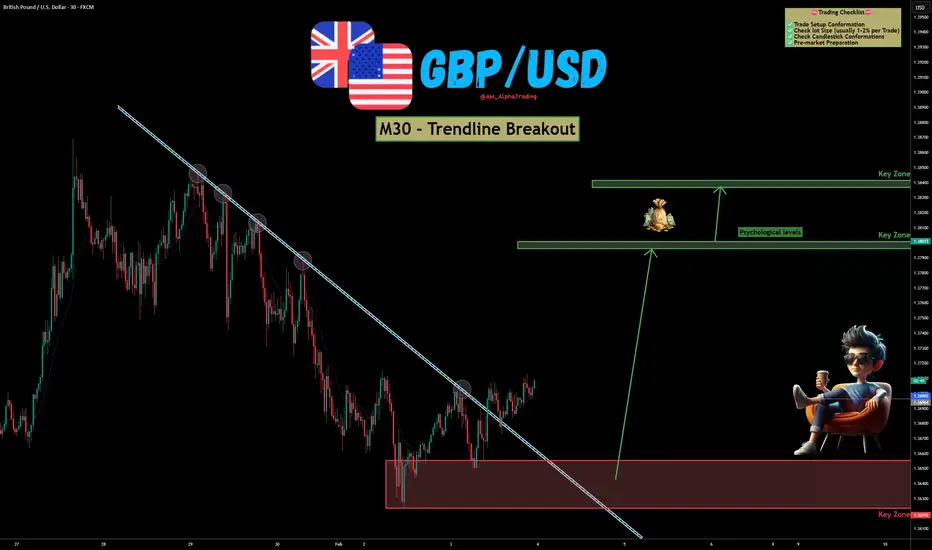
GBP/USD – Trendline Breakout | Bullish Reversal SetupGBP/USD has shown a clear breakout above a well-respected descending trendline on the M30 timeframe, hinting at a potential shift from bearish to bullish momentum. Price action is reacting strongly from a key demand zone, increasing the probability of continuation to the upside. OANDA:GBPUSD
📊 Technical Overview :
Price respected the descending trendline multiple times, confirming its validity.
The recent clean breakout and hold above the trendline suggests buyers are stepping in.
A strong base has formed at the lower demand zone, acting as a launchpad for the move.
Upside targets are aligned with psychological levels and higher-timeframe key zones, offering a favorable risk-to-reward setup.
As long as price holds above the breakout area, bullish continuation remains the preferred bias.
✅ Support this analysis with a
LIKE 👍 | COMMENT 💬 | FOLLOW 🔔
It helps a lot & keeps the ideas coming!
⚠️ Disclaimer: This analysis is for educational purposes only and does not constitute financial advice. Forex trading involves high risk. Trade only with capital you can afford to lose and always do your own research.
XAGUSD: still under pressure🛠 Technical Analysis: On the H4 chart, Silver (XAGUSD) has printed a sharp reversal from the major resistance zone near 120, confirming exhaustion after the parabolic rally. Price is now trading around 86.84 and has slipped back below the mid-range resistance (around 92–96), shifting momentum to the downside. The current structure suggests a corrective phase with potential consolidation inside the 80–84 demand area before the next leg. Notably, price is still hovering just above the SMA 200, while the SMA 50 and SMA 100 remain overhead, acting as dynamic resistance. A clean breakdown and hold below the 82.03 support would open the way toward the next support cluster near 72.00. If selling pressure accelerates, the deeper support area around 63.94 becomes the extended downside target. A bullish alternative would require reclaiming 90+ and holding above the 92–96 zone, which currently looks less likely while price stays capped under those levels.
———————————————
❗️ Trade Parameters (SELL)
———————————————
➡️ Entry Point: Sell on a confirmed break below 82.03
🎯 Take Profit: 63.94
🔴 Stop Loss: 91.08
⚠️ Disclaimer: This is a potential trade idea based on current analysis; market conditions and price direction are subject to change based on news factors and volatility.

XAUUSD: rejection at 5,100🛠 Technical Analysis: On the H4 timeframe, Gold remains in a broader bullish trend, but the latest move shows a sharp reversal from the major 5,600 resistance zone, followed by a heavy bearish impulse. Price has rebounded back into the 5,050–5,100 area, where the chart marks a key resistance/supply zone that is now acting as a selling pivot. This looks like a classic retest after a breakdown: if buyers fail to reclaim and hold above the zone, the correction is likely to resume. The moving averages are still stacked bullishly (SMA50 above SMA100 above SMA200), but price is currently below the SMA50, signaling a corrective phase within the larger uptrend. The projected scenario expects reverse near 5,000–5,100 and then continuation lower toward the next structural support at 4,573.95. If bearish pressure accelerates, the lower support zone around 4,300 becomes the extended downside objective. A clean recovery and sustained hold back above the 5,100 resistance would weaken the sell idea and favor stabilization.
———————————————
❗️ Trade Parameters (SELL)
———————————————
➡️ Entry Point: Sell on rejection from the 5,050–5,100 (more conservative ~4981.32)
🎯 Take Profit: 4,573.95 (extended target: 4,300)
🔴 Stop Loss: 5,252.90
⚠️ Disclaimer: This is a potential trade idea based on current analysis; market conditions and price direction are subject to change based on news factors and volatility.

EURUSD — FRGNT DAILY FORECAST Q1 | D5 | W5 | Y26📅 Q1 | D5 | W5 | Y26
📊 EURUSD — FRGNT DAILY FORECAST
🔍 Analysis Approach
I’m applying a developed version of Smart Money Concepts, with a structured focus on:
• Identifying Key Points of Interest (POIs) on Higher Time Frames (HTFs) 🕰️
• Using those POIs to define a clear and controlled trading range 📐
• Refining those zones on Lower Time Frames (LTFs) 🔎
• Waiting for a Break of Structure (BoS) as confirmation ✅
This process keeps me precise, disciplined, and aligned with market narrative, rather than reacting emotionally or chasing price.
💡 My Motto
“Capital management, discipline, and consistency in your trading edge.”
A positive risk-to-reward ratio, combined with a high-probability execution model, is the backbone of any sustainable trading plan 📈🔐
⚠️ On Losses
Losses are part of the mathematical reality of trading 🎲
They don’t define you — they are necessary, expected, and managed.
We acknowledge them, learn, and move forward 📊➡️
🙏 I appreciate you taking the time to review my Daily Forecast.
Further context and supporting material can be found in the Links section.
Stay sharp 🧠
Stay consistent 🎯
Protect your capital 🔐
— FRGNT 🚀📈
FX:EURUSD

DXY TO THE MOON ! Q1 | D5 | W5 | Y26 FRGNT DAILY FORECAST📅 Q1 | D5 | W5 | Y26
📊 DXY — FRGNT DAILY FORECAST
🔍 Analysis Approach
I’m applying a developed version of Smart Money Concepts, with a structured focus on:
• Identifying Key Points of Interest (POIs) on Higher Time Frames (HTFs) 🕰️
• Using those POIs to define a clear and controlled trading range 📐
• Refining those zones on Lower Time Frames (LTFs) 🔎
• Waiting for a Break of Structure (BoS) as confirmation ✅
This process keeps me precise, disciplined, and aligned with market narrative, rather than reacting emotionally or chasing price.
💡 My Motto
“Capital management, discipline, and consistency in your trading edge.”
A positive risk-to-reward ratio, combined with a high-probability execution model, is the backbone of any sustainable trading plan 📈🔐
⚠️ On Losses
Losses are part of the mathematical reality of trading 🎲
They don’t define you — they are necessary, expected, and managed.
We acknowledge them, learn, and move forward 📊➡️
🙏 I appreciate you taking the time to review my Daily Forecast.
Further context and supporting material can be found in the Links section.
Stay sharp 🧠
Stay consistent 🎯
Protect your capital 🔐
— FRGNT 🚀📈
TVC:DXY

Bearish reversal off pullback resistance?US Dollar Index (DXY) is rising towards the pivot, which acts as a pullback resistance and could reverse to the 1st support.
Pivot: 97.85
1st Support: 96.44
1st Resistance: 98.70
Disclaimer:
The opinions given above constitute general market commentary and do not constitute the opinion or advice of IC Markets or any form of personal or investment advice.
Any opinions, news, research, analyses, prices, other information, or links to third-party sites contained on this website are provided on an "as-is" basis, are intended to be informative only, and are not advice, a recommendation, research, a record of our trading prices, an offer of, or solicitation for, a transaction in any financial instrument and thus should not be treated as such. The information provided does not involve any specific investment objectives, financial situation, or needs of any specific person who may receive it. Please be aware that past performance is not a reliable indicator of future performance and/or results. Past performance or forward-looking scenarios based upon the reasonable beliefs of the third-party provider are not a guarantee of future performance. Actual results may differ materially from those anticipated in forward-looking or past performance statements. IC Markets makes no representation or warranty and assumes no liability as to the accuracy or completeness of the information provided, nor any loss arising from any investment based on a recommendation, forecast, or any information supplied by any third party

They lied to you about Bitcoin to take your money !You Invested your life savings into Bitcoin because they told you its the supercycle !
At the first few weeks ..you gained a small profit and everytime you turn on the news or social media you saw everyone cheering and posting new ATH targets for Bitcoin..some of them said 200k and others said its going to a million Dollars !
These people had thousands of followers and everyone was grateful and positive in their replies but guess what ! It was all FAKE lol...that's right each and everyone of them is a scammer and 99% of their followers are fake bots !
If you look closely to their accounts you'd see that all of their posts were bullish at the top and bearish at the bottom, their whole accounts are dedicated to give false hopes and deceiving charts in order to trap their followers in a dead trade that provides the real trading whales with exit liquidity !
Look at Jim Cramer .. he's the text book example of a trading scammer and investors actually gained money by inversing his financial advices lol..and he's not alone, most of the social media influencers are exactly like him and the more followers they have the more evil they are.
Now Bitcoin crashed to 70k in a matter of days ... 50% of your wallet is gone ! so are you going to sell now ? But market might recover soon and 70k might be the bottom !
If you check the social media right now everyone is saying a different story and you are confused and lost between the moon boys and the realistic investors.. what are you going to do now ? Are you gonna accept your losses and save the rest of your money or are you going to hold to Zero and fullsend it ?
Come let me help you my friend .. your first mistake was that you believed and trusted other people with your money .. people who gain profit only if you lose your money !
Second mistake was that you didn't do your own research ... You had no idea where the market is going and you risked everything with zero knowledge or experiance.
So how to fix this ? The answer is damage control !
Market has been going down for a while now and the chart seems to be forming a Head & shoulders so as soon as the price goes up to form the right shoulder you need to get the hell out and save yourself from the real crash!
Second step which is a very important step for now and the future is that you unfollow and block everyone who told you its the supercycle ! Once you get those parasites out of your social media feed then you should start looking for real investors who were calling the top at 100k + and were telling their followers to take profit and get out.
Third step is that you need to learn how to read charts .. read about candles patters and find your own buy & sell signals, DO NOT LISTEN TO ANYONE AT ALL including myself !
You can use paper trading in Trading view app to learn how to trade with fake money and once you master a technique stick to it and implement it to real trading.
Above is my expectation for Bitcoin so 2026 should be very interesting and I would be honored if you check my other posts for more ideas and please like and follow my account to support me.
Stay safe out there friends ! Thank you and best regards,

bitcoin expands to 751kgood morning,
a small retracement over the last few days has sent 95% of the market into total panic mode.
these are the times to be buying, when others are terrified beyond belief, running for cover.
---
i predict btc is going to enter into a multi-month- parabola once the previous all the high is properly tested. we don't particularly have to tap the previous all time highs, just gotta hold my green box to confirm expansion.
---
often times, extreme fear + miner capitulation create major bottoms, and this time is no different. while retail panic sells their entire bag and exits crypto, there are large entities purchasing everything. don't take my word for it, just see the data yourself 👇
---
gold was in a similar situation not too long ago, i'm sure you remember it yourself. the same kind of feeling you are experiencing today relative to the crypto cycle (structurally speaking). historically, gold runs first, while crypto lags behind it by many months. in all the previous occurrences where gold ran first, crypto ended up outperforming ten fold after.
---
my prediction here is very contrarian during these times, and it could be difficult to believe that this is exactly how it's going to play out, so i'm going to add a few more pieces of evidence to back up my theory.
---
in previous cycles, btc did not top until the business cycle topped 👇
---
in previous cycles, when dxy broke beneath 97, it triggered end of cycle crypto expansions. we are currently testing the last of supply at 97 before the next leg down 👇
---
i believe this final phase will cause btc dominance to drop rapidly as money aggressively rotates into emerging tech in the alt coin ecosystem. we refer to this occurence as "alt season". not all alt coins will perform equally. focus on emerging tech above all else and don't get shaken out. this is the final test of conviction, and only the strongest hands will make it through this.
---
🎯 = 751k

NAS100 Short: "Back On The Table" (The Software Disruption) PEPPERSTONE:NAS100
The 26,000 level has proven to be a formidable ceiling for the Nasdaq over the last few months. After several failed attempts to sustain a breakout, the technical and macro signals suggest the short thesis is back on the table with a more defined risk-reward profile.
🏛️ The Macro Shift: Uncertainty & Disruption
Rather than a single event, we are seeing a "clustering" of risks that the market is struggling to price:
Structural Disruption & The MSFT Precedent: Recent advancements in AI-driven automation (Anthropic/Claude) have put a spotlight on SaaS valuations. We saw a significant compression in the IGV (Software ETF) recently. Critically, Microsoft (MSFT) beat expectations last week but saw its stock drop, signaling a "sell-the-news" regime where AI margins are now under forensic scrutiny.
The Information Gap: With the government shutdown impacting official labor releases, we are in a "Data Blackout." Without a jobs floor to rely on, the VIX is reflecting a defensive rotation as certainty evaporates.
The Earnings Cliff: Eli Lilly (LLY) reported a beat this morning, but this is a "divergence" play—liquidity is moving out of "Paper Tech" and into "Real Economy" growth. Alphabet (GOOGL) reports after today’s close; if they follow Microsoft's lead of "beat but drop," the Nasdaq wedge will snap.
Yield Gravity & The "Warsh" Curve: As the 10Y yield holds near 4.30%, elevated discount rates weigh on high-multiple growth. Investors are ramping up bets on higher long-dated yields following the Kevin Warsh Fed Chair nomination, creating a "valuation ceiling" that high-beta tech cannot easily break.
🏛️ The "Perpetual" Information Gap
Today's ADP Employment and ISM Services are now the only data points the market has to trade on.
The Data Blackout (NFP Suspended): Despite the late-January budget deal framework, the Bureau of Labor Statistics (BLS) confirmed this morning that the January Non-Farm Payrolls (NFP) report will NOT be released this Friday as scheduled. We are effectively "flying blind" on the most critical jobs floor. Because the NFP is postponed, these private prints now carry 2x the normal market weight.
The VIX "Certainty Premium": Markets reward clarity. With official labor data on ice due to the partial shutdown, the VIX is reflecting a defensive rotation as investors refuse to bid tech "blindly" into the apex of this wedge.
Private Data Sensitivity: Because of the government's silence, today's ADP Employment and ISM Services PMI numbers will carry 2x the normal market weight. If these private prints miss, there is no "Official NFP" to save the narrative on Friday, accelerating the tech flush.
📊 Technical View: Compression With a Double Top Toward Apex
The Double Top: After the initial rejection in late Q4, the recent re-test of 26,000 failed to find follow-through, leaving a clear "M-structure" at the ceiling. Institutional supply is heavy at these levels.
The Compression Wedge: Price is coiling within a narrowing wedge toward its apex. Historically, when a market "hammers" on the upper bound and fails twice, the eventual breakout is forced toward the path of least resistance: Down.
Volatility Coiling: This "wedge-within-a-top" suggests that indecision is exhausted. The narrowing range indicates a high-velocity expansion is imminent.
🏛️ Scenarios to Watch: The Catalyst Checklist
The validity of this short rests on whether the "Real Economy" validates the "Software Disruption" lead during today’s data block.
✅ Thesis Confirmation (The Bearish Breakout):
ISM Services PMI < 53.5: Confirms the non-manufacturing core is cooling alongside tech.
Alphabet (GOOGL) Guidance: Any sign that AI CapEx is peaking or search margins are eroding.
ADP Jobs > 50K: Forces yields higher (10Y > 4.301%), increasing valuation pressure on growth.
VIX > 18.00: Signals a transition to "Sell the Rip" psychology.
⚠️ The Red Flags (The Invalidation Checklist):
ISM Services PMI > 55.0: Signals demand is too robust to fade; 26,000 likely breaks to the upside.
10Y Yield < 4.20%: Removes valuation "gravity" and allows a tech re-rating.
DXY < 97.00: A weakening Dollar restores global liquidity, overriding technical resistance.
Bottom Line: We aren't fighting the trend; we are observing a Range Regime that has yet to be broken. If the wedge snaps, we're looking for a mean-reversion test of the lower value zones.
🏁 Your Afternoon Watchlist (CET)
14:15: ADP Private Payrolls (Forecast: ~41k–50k)
16:00: ISM Services PMI (Forecast: 53.5)
16:30: EIA Oil Inventories (The "Real Economy" check)

Q1 | D4 | W5 | Y26 DXY — FRGNT DAILY FORECAST📅 Q1 | D4 | W5 | Y26
📊 DXY — FRGNT DAILY FORECAST
🔍 Analysis Approach
I’m applying a developed version of Smart Money Concepts, with a structured focus on:
• Identifying Key Points of Interest (POIs) on Higher Time Frames (HTFs) 🕰️
• Using those POIs to define a clear and controlled trading range 📐
• Refining those zones on Lower Time Frames (LTFs) 🔎
• Waiting for a Break of Structure (BoS) as confirmation ✅
This process keeps me precise, disciplined, and aligned with market narrative, rather than reacting emotionally or chasing price.
💡 My Motto
“Capital management, discipline, and consistency in your trading edge.”
A positive risk-to-reward ratio, combined with a high-probability execution model, is the backbone of any sustainable trading plan 📈🔐
⚠️ On Losses
Losses are part of the mathematical reality of trading 🎲
They don’t define you — they are necessary, expected, and managed.
We acknowledge them, learn, and move forward 📊➡️
🙏 I appreciate you taking the time to review my Daily Forecast.
Further context and supporting material can be found in the Links section.
Stay sharp 🧠
Stay consistent 🎯
Protect your capital 🔐
— FRGNT 🚀📈
TVC:DXY

Weekly Low Set – Gold Showing Bullish Continuation Into MidweekGold remains in a high-volatility environment, though conditions have slightly calmed compared to last week. Even with reduced leverage across prop firms, price continues to show strong intent.
This week’s structure so far:
Monday: Strong displacement down, creating what appears to be the weekly low
Tuesday: Sideways consolidation with gradual price appreciation
Wednesday (Asia): Holding above weekly open and value, suggesting continued bullish intent
Despite aggressive swings, price has respected higher-timeframe levels and is now trading above key weekly references. As long as price continues to hold above the weekly open and does not re-enter Monday’s low structure, I favor continuation higher through the remainder of the week.
I’m not chasing momentum here — I’m watching for pullbacks into value during active sessions to confirm continuation.
Volatility is still elevated. Patience and location remain critical.

GBP/USD – Fundamental Drive in Play (30.01.2026)📝 Description 🔍 Setup (Market + Fundamentals) FX:GBPUSD
GBP/USD has rallied strongly but is now facing heavy selling pressure at a well-defined resistance zone. Multiple rejections from the same supply area signal buyer exhaustion.
On the fundamental side, USD strength is supported by:
1.New Fed leadership announcement
2.Political agreement to avoid a US government shutdown, reducing uncertainty and favoring the dollar
Technically, price is breaking below the rising trendline, with EMA & Ichimoku losing bullish momentum.
📍 Support & Resistance
🟨 Resistance Zone: 1.3825 – 1.3865
🟥 1st Support: 1.3600
🟥 2nd Support: 1.3500
Volume profile supports downside liquidity below current price
⚠️ Disclaimer
This analysis is for educational purposes only.
Forex trading involves risk — always use proper risk management and trade responsibly.
💬 Support the Idea 👍 Like if you see GBP/USD turning bearish
💬 Comment: Sell from resistance or wait for deeper confirmation?
🔁 Share with traders watching USD fundamentals
#GBPUSD #ForexTrading #FundamentalAnalysis #PriceAction #ResistanceZone #USDStrength #TradingView #Kabhi_TA_Trading

EUR/USD – H1 - Fundamental Pressure Takes Control 📝 Description🔍 Setup (Fundamental + Technical) FX:EURUSD
EUR/USD has lost bullish structure after breaking below the rising trendline and confirming a bearish retest. Price is also trading below the Ichimoku cloud, with a bearish cloud crossover, signaling trend weakness.
📉 Fundamental catalyst:
1.Announcement of a new Fed Chair and political agreement to avoid a U.S. government shutdown
2. This reduces uncertainty and supports USD strength, pressuring EUR/USD lower
📍 Support & Resistance
🟨 Resistance Zone: 1.1980 – 1.2030
🟥 1st Support: 1.1715
🟥 2nd Support: 1.1620
Volume profile shows thin demand below, favoring continuation
#EURUSD #ForexTrading #FundamentalAnalysis #TrendlineBreak #BearishBias #USDStrength #PriceAction #TradingView #Kabhi_TA_Trading
⚠️ Disclaimer
This analysis is for educational purposes only.
Trading involves risk — always use proper risk management and trade with confirmation.
💬 Support the Idea👍 Like if you see EUR/USD heading lower
💬 Comment: Sell the retest or wait for breakdown continuation?
🔁 Share with traders watching USD fundamentals

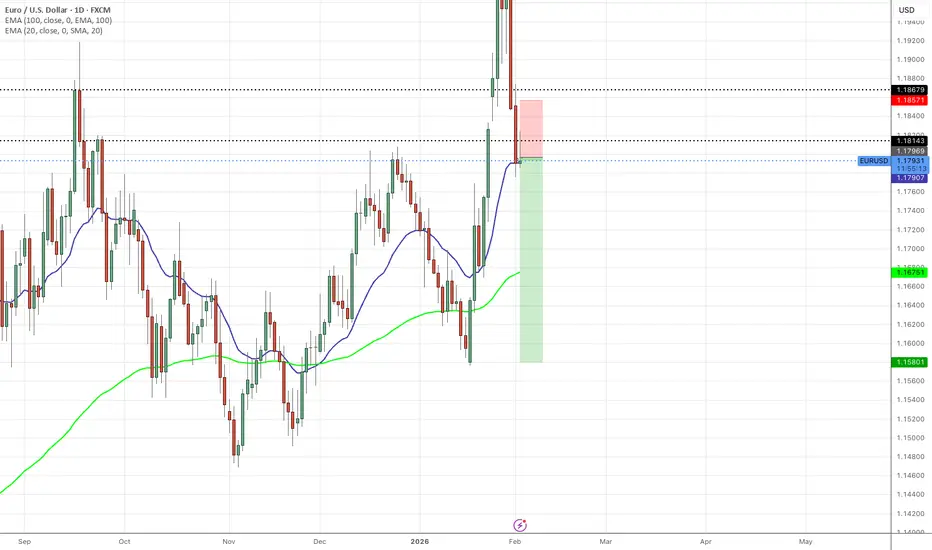
EURUSD SHORTS - IMMENSE SELL PRESSURE CONTINUATIONAfter closing in profit yesterdays move i am expecting a continuation of EURUSD sells.
EURUSD has failed to maintain price above 1.18679 support zone, we can see immense selling pressure on the daily and on the weekly a bearish pin bar candle this also in confluence with the dollars strength and the rising dollar.
I am expecting the pair to continue this downside momentum.
TP1: 1.17500
TP2; 1.16768
GBPUSD SHORTS UPDATED - MAJOR SUPPORT AND RESISTANCE BREAK On the daily we can see GBPUSD failed to maintain price above 1.37500 area with the last day of the month candle last week closing below.
Here we can see in the past a significant amount of sellers enter the market. Expecting the pair to go into a free fall.
After yesterdays retrace I have re entered expecting the bigger fall to start now
TP1: 1.35500
TP2: 1.34110

DXY Rebound Ahead! Buy!
Hello,Traders!
DXY reclaims a key horizontal demand after liquidity sweep, showing strong bullish displacement. Break in internal structure signals smart money accumulation, favoring continuation toward higher buy-side liquidity. Time Frame 2H.
Buy!
Comment and subscribe to help us grow!
Check out other forecasts below too!
Disclosure: I am part of Trade Nation's Influencer program and receive a monthly fee for using their TradingView charts in my analysis.
